Comparative Study
. 2021 Aug 2;4(8):e2122591.
doi: 10.1001/jamanetworkopen.2021.22591.

Assessment of Receptive and Expressive Language Skills Among Young Children With Prelingual Single-Sided Deafness Managed With Early Cochlear Implantation

Affiliations
Comparative Study

Assessment of Receptive and Expressive Language Skills Among Young Children With Prelingual Single-Sided Deafness Managed With Early Cochlear Implantation

Tine Arras et al. JAMA Netw Open. .

Abstract

Importance: Pediatric single-sided deafness (SSD) can seriously affect development, causing impaired spatial hearing skills, speech-language delays, and academic underachievement. Early cochlear implantation likely improves hearing-related outcomes, but its association with language development remains unclear.

Objective: To investigate whether early cochlear implantation is associated with language outcomes for children with prelingual SSD.

Design, setting, and participants: The Cochlear Implant for Children and One Deaf Ear study was initiated in 2015 and recruited participants at 4 academic hospitals in Flanders, Belgium, through 2019. This cohort study included 3 groups of children aged 2 to 5 years: children with SSD and a cochlear implant, children with SSD without a cochlear implant, and a control group with normal hearing. Language and hearing skills were assessed 1 to 2 times per year until the age of 10 years. Study completion rates were high (82%). Data analysis was performed from October to December 2020.

Exposure: Unilateral cochlear implant.

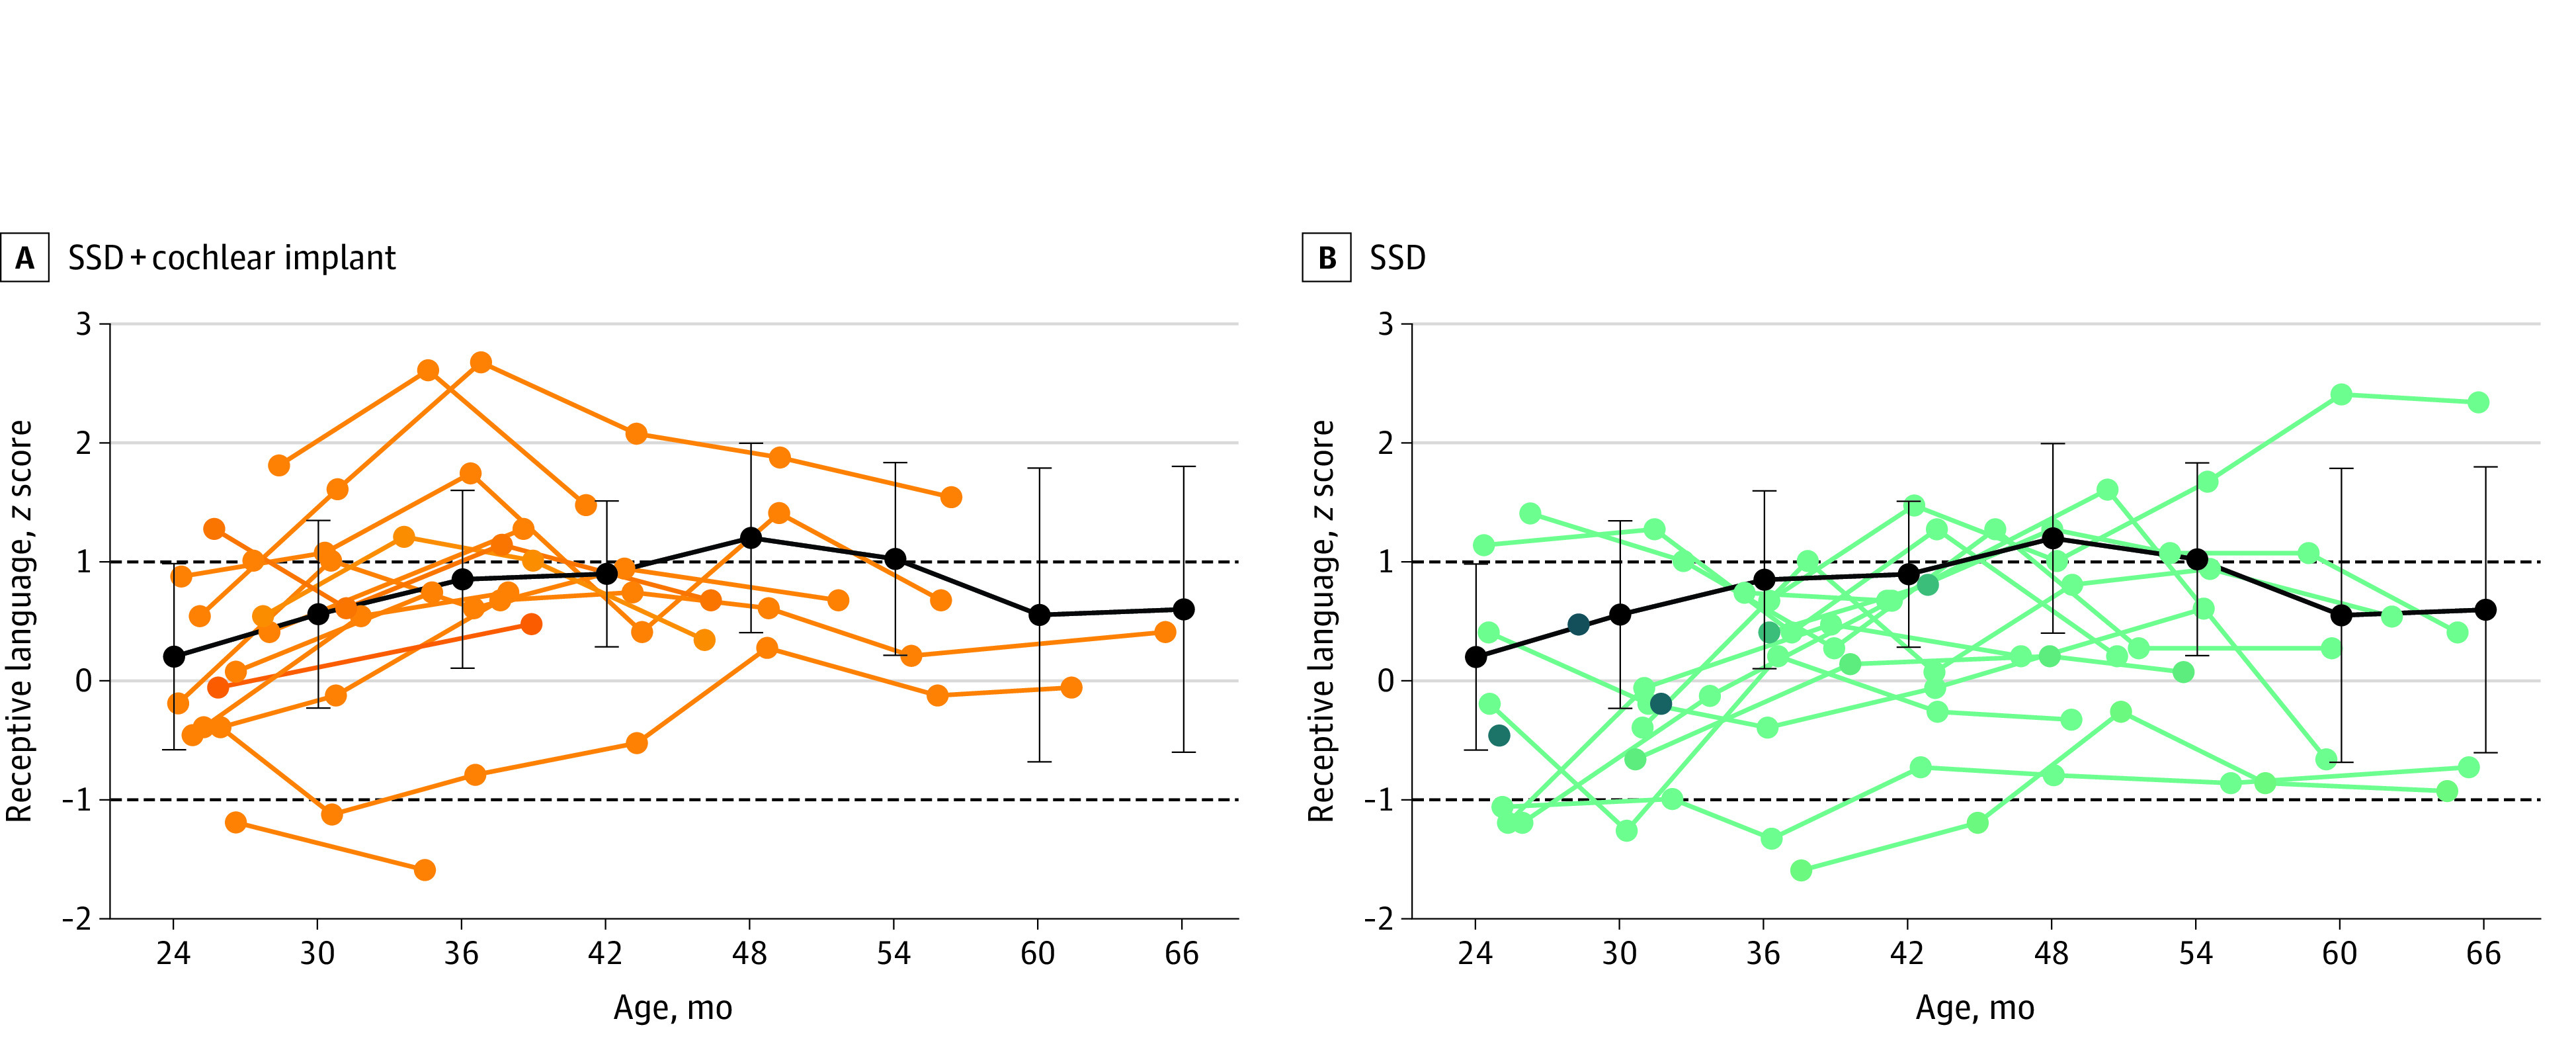
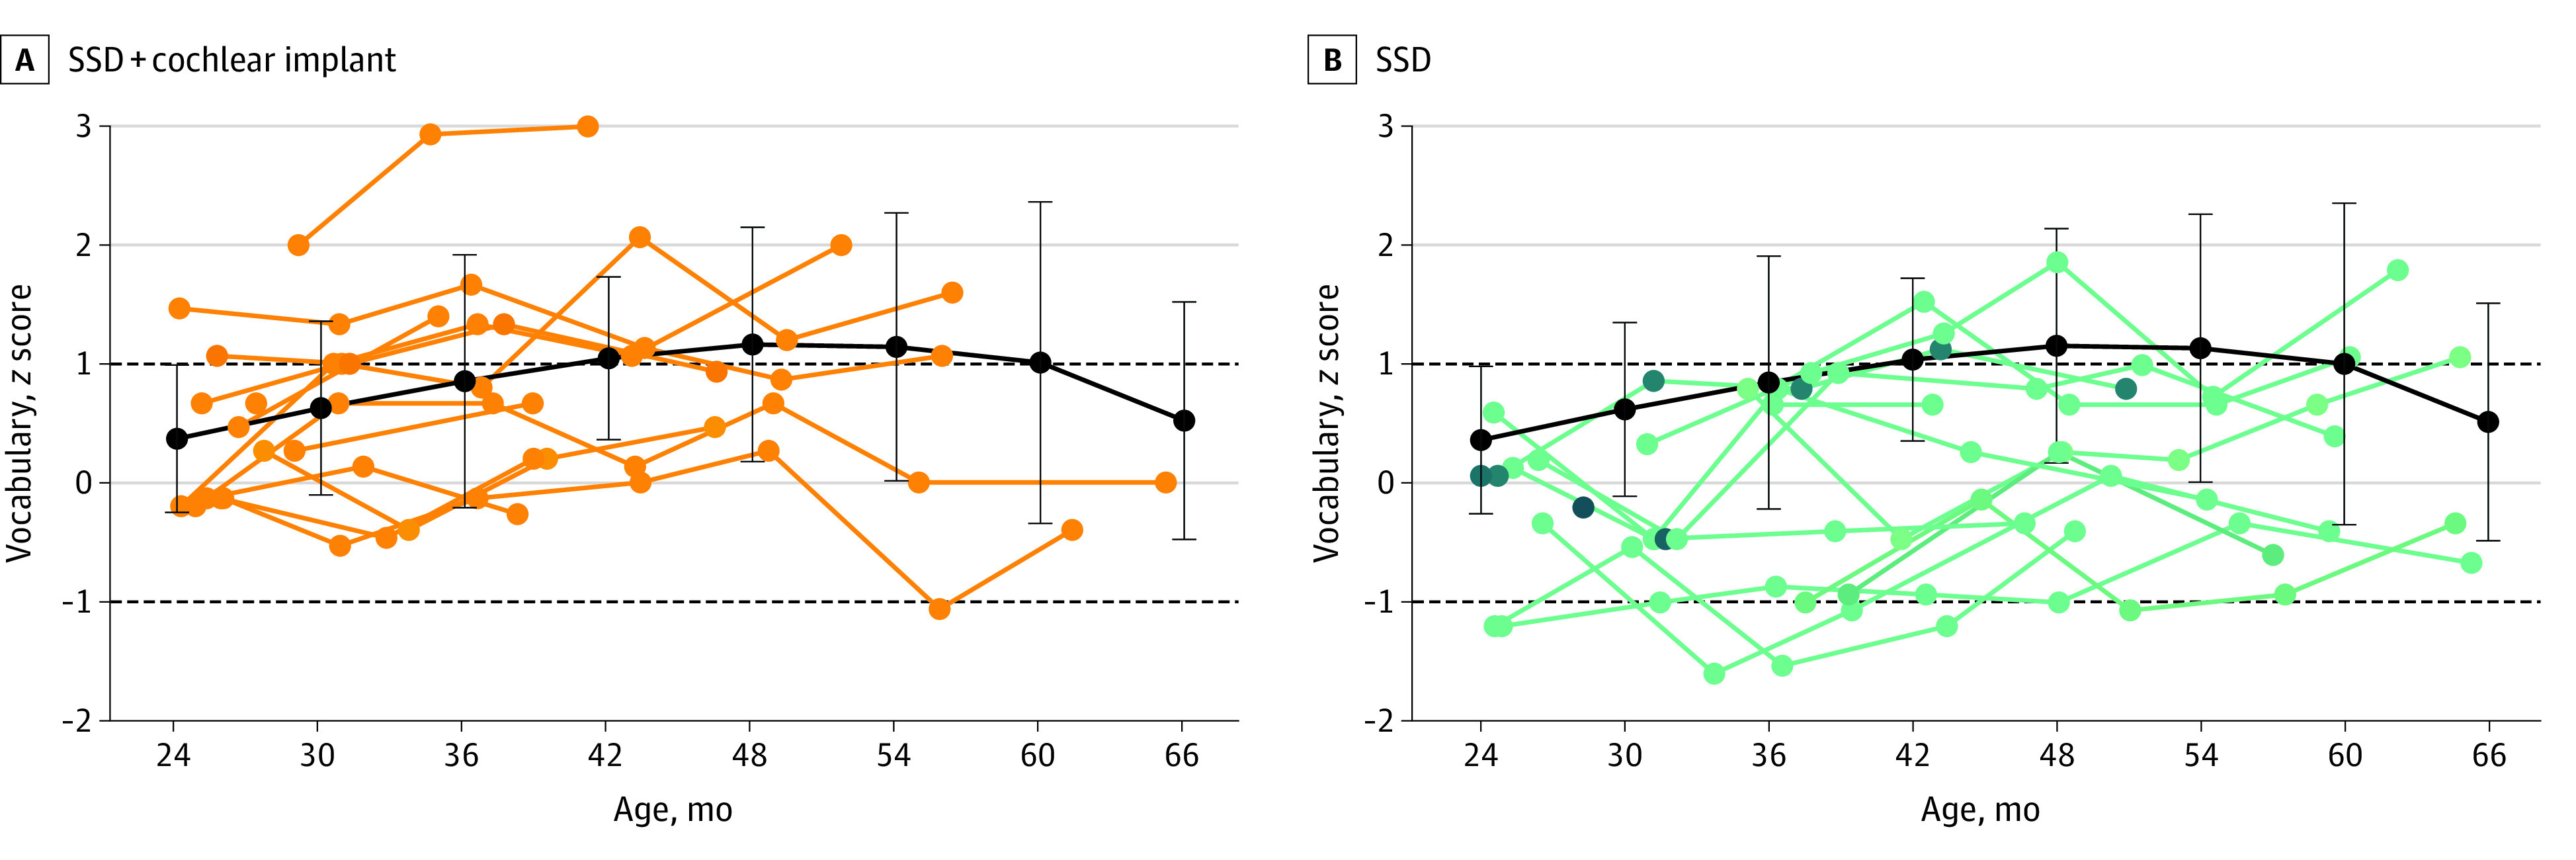
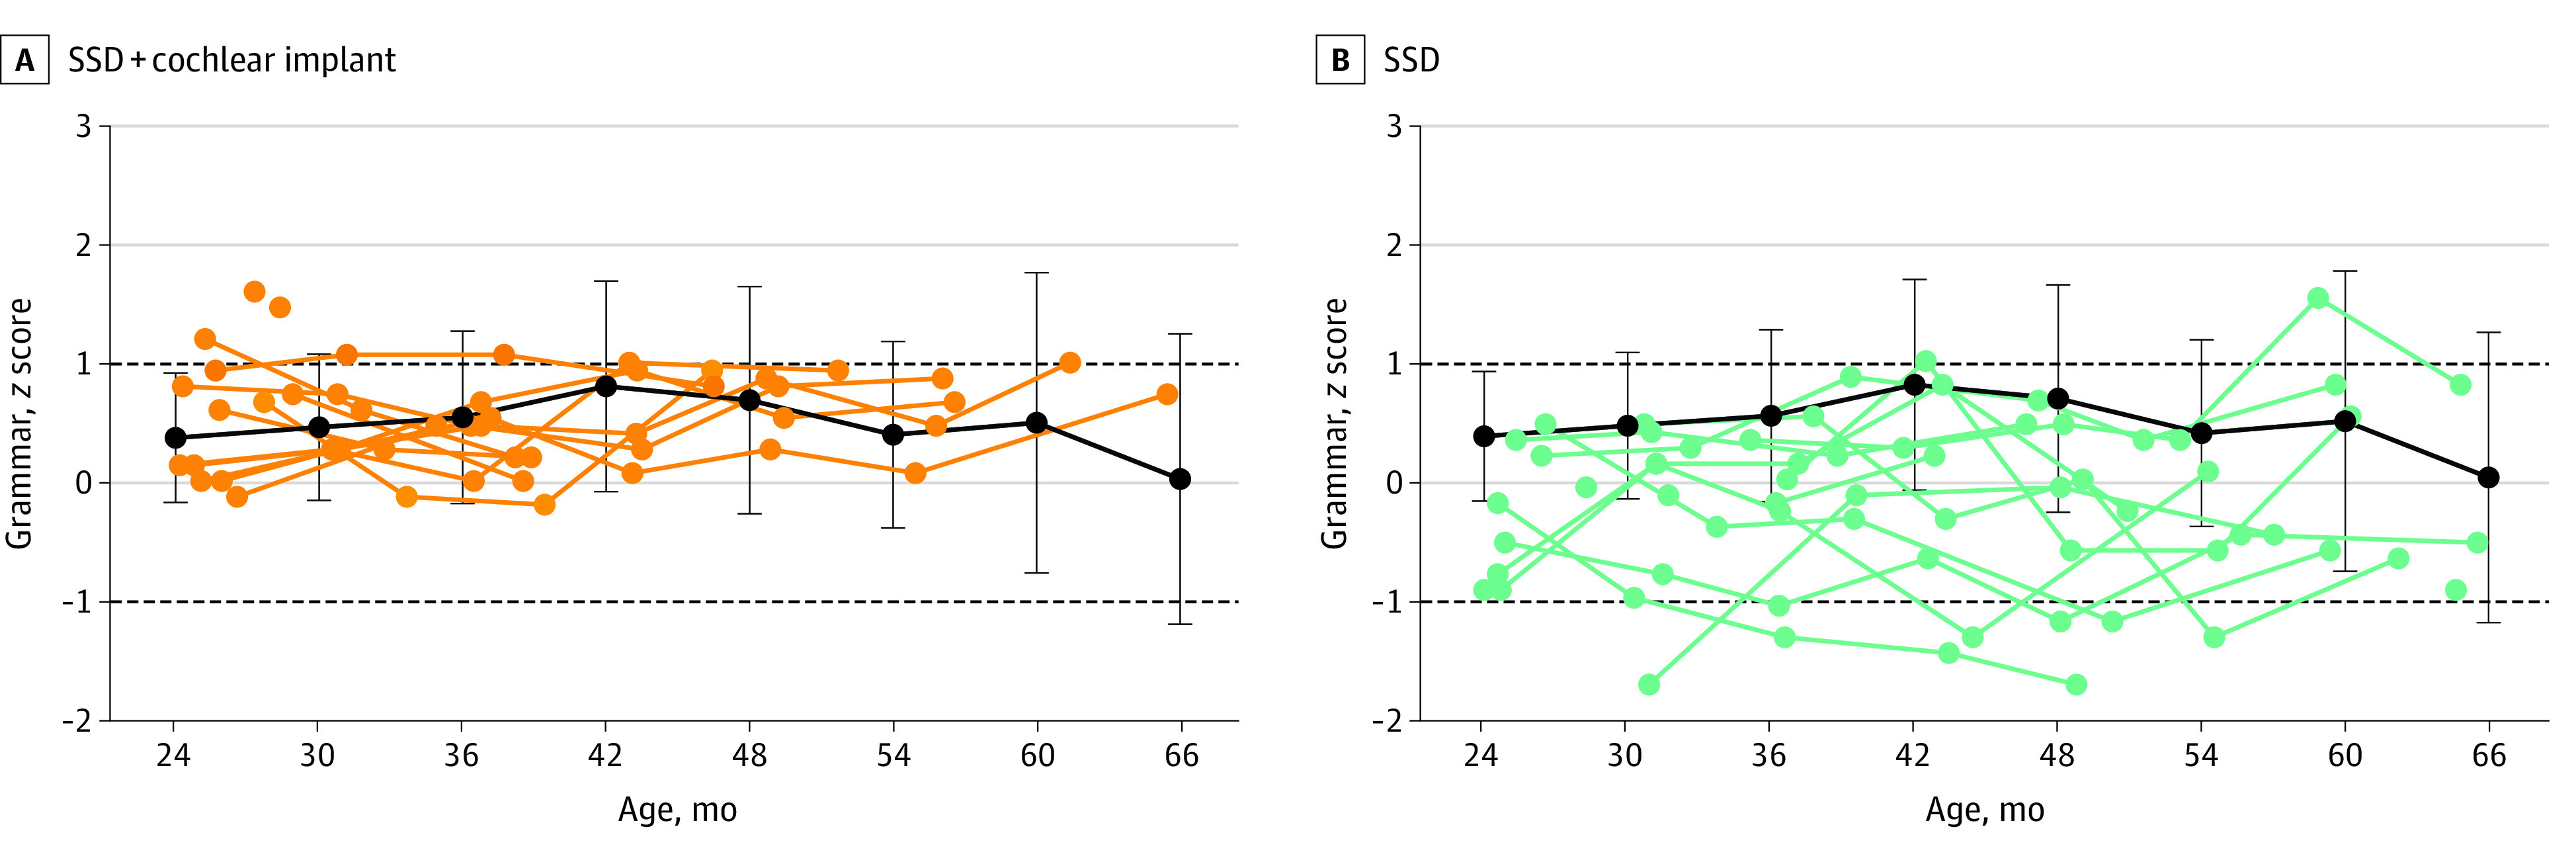
Main outcomes and measures: Longitudinal vocabulary, grammar, and receptive language scores. The implanted group was hypothesized to outperform the nonimplanted group on all language tests.

Results: During the recruitment period, 47 children with prelingual SSD without additional disabilities were identified at the participating hospitals. Fifteen of the 34 children with an intact auditory nerve received a cochlear implant (44%, convenience sample). Sixteen of the remaining children were enrolled in the SSD control group (50%). Data from 61 children (mean [SD] age at the time of enrollment, 2.08 [1.34] years; 26 girls [42%]) were included in the analysis: 15 children with SSD and a cochlear implant, 16 children with SSD without a cochlear implant, and 30 children with normal hearing. Children with SSD and a cochlear implant performed in line with their peers with normal hearing with regard to grammar. In contrast, children with SSD without a cochlear implant had worse grammar scores than the group with implants (-0.76; 95% CI, -0.31 to -1.21; P = .004) and the group with normal hearing (-0.53; 95% CI, -0.91 to -0.15; P = .02). The 3 groups had similar vocabulary and receptive language abilities.

Conclusions and relevance: These findings suggest that early cochlear implantation is associated with normal grammar development in young children with prelingual SSD. Although further follow-up will reveal the long-term outcomes of the cochlear implant for other skills, the current results will help clinicians and policy makers identify the best treatment option for these children.


Conflict of interest statement

Conflict of Interest Disclosures: Dr Philips reported being an employee of Cochlear, Ltd. No other disclosures were reported.

Figures

Figure 1.
Figure 1.. Individual Receptive Language Scores of Children With Single-Sided Deafness (SSD) Compared With Children With Normal Hearing
Individual receptive language scores (z scores) are shown for children with SSD and cochlear implants (A) and children with SSD without cochlear implants (B), as a function of age. The black lines and error bars indicate the mean (SD) score of the children with normal hearing, averaged per age interval of 6 months (24 months, 20 children; 30 months, 20 children; 36 months, 14 children; 42 months, 15 children; 48 months, 15 children; 54 months, 14 children; 60 months, 13 children; and 66 months, 14 children). The dashed lines at 1 and −1 indicate the range of average performance, according to the test’s standard values.
Figure 2.
Figure 2.. Individual Vocabulary Scores of Children With Single-Sided Deafness (SSD) Compared With Children With Normal Hearing
Individual vocabulary scores (z scores) for children with SSD and cochlear implants (A) and children with SSD without cochlear implants (B) are shown as a function of age. The black lines and error bars indicate the mean (SD) score of the children with normal hearing, averaged per age interval of 6 months (24 months, 19 children; 30 months, 20 children; 36 months, 15 children; 42 months, 13 children; 48 months, 16 children; 54 months, 15 children; 60 months, 13 children; and 66 months, 12 children). Two outliers were removed in correspondence with the linear mixed models used in the data analysis. The dashed lines at 1 and −1 indicate the range of average performance, according to the test’s standard values.
Figure 3.
Figure 3.. Individual Grammar Scores of Children With Single-Sided Deafness (SSD) Compared With Children With Normal Hearing
Individual grammar scores (z scores) for children with SSD and cochlear implants (A) and children with SSD without cochlear implants (B) are shown as a function of age. The black lines and error bars indicate the mean (SD) score of the children with normal hearing, averaged per age interval of 6 months (24 months, 19 children; 30 months, 21 children; 36 months, 14 children; 42 months, 14 children; 48 months, 16 children; 54 months, 15 children; 60 months, 13 children; and 66 months, 12 children). Six outliers were removed in correspondence with the linear mixed models used in the data analysis. The dashed lines at 1 and −1 indicate the range of average performance, according to the test’s standard values.

Similar articles

Cited by

References

    1. Morton CC, Nance WE. Newborn hearing screening: a silent revolution. N Engl J Med. 2006;354(20):2151-2164. doi:10.1056/NEJMra050700 - DOI - PubMed
    1. Van Kerschaver E, Stappaerts L. Jaarrapport Gehoor 2009-2010-2011: universele gehoorscreening in Vlaanderen—doelgroepbereik, testresultaten en resultaten van de verwijzingen. Published 2011. Accessed July 21, 2021. https://www.kindengezin.be/img/rapportGehoor2009-2010-2011.pdf
    1. Reeder RM, Cadieux J, Firszt JB. Quantification of speech-in-noise and sound localisation abilities in children with unilateral hearing loss and comparison to normal hearing peers. Audiol Neurootol. 2015;20(1)(suppl):31-37. doi:10.1159/000380745 - DOI - PMC - PubMed
    1. Wolter NE, Cushing SL, Vilchez-Madrigal LD, et al. . Unilateral hearing loss is associated with impaired balance in children: a pilot study. Otol Neurotol. 2016;37(10):1589-1595. doi:10.1097/MAO.0000000000001218 - DOI - PubMed
    1. Lieu JEC, Tye-Murray N, Karzon RK, Piccirillo JF. Unilateral hearing loss is associated with worse speech-language scores in children. Pediatrics. 2010;125(6):e1348-e1355. doi:10.1542/peds.2009-2448 - DOI - PMC - PubMed

Publication types