. 2021 Sep 1;13(9):evab193.
doi: 10.1093/gbe/evab193.

Mitogenomes of Accipitriformes and Cathartiformes Were Subjected to Ancestral and Recent Duplications Followed by Gradual Degeneration

Affiliations

Mitogenomes of Accipitriformes and Cathartiformes Were Subjected to Ancestral and Recent Duplications Followed by Gradual Degeneration

Adam Dawid Urantówka et al. Genome Biol Evol. .

Abstract

The rearrangement of 37 genes with one control region, firstly identified in Gallus gallus mitogenome, is believed to be ancestral for all Aves. However, mitogenomic sequences obtained in recent years revealed that many avian mitogenomes contain duplicated regions that were omitted in previous genomic versions. Their evolution and mechanism of duplication are still poorly understood. The order of Accipitriformes is especially interesting in this context because its representatives contain a duplicated control region in various stages of degeneration. Therefore, we applied an appropriate PCR strategy to look for duplications within the mitogenomes of the early diverged species Sagittarius serpentarius and Cathartiformes, which is a sister order to Accipitriformes. The analyses revealed the same duplicated gene order in all examined taxa and the common ancestor of these groups. The duplicated regions were subjected to gradual degeneration and homogenization during concerted evolution. The latter process occurred recently in the species of Cathartiformes as well as in the early diverged lineages of Accipitriformes, that is, Sagittarius serpentarius and Pandion haliaetus. However, in other lineages, that is, Pernis ptilorhynchus, as well as representatives of Aegypiinae, Aquilinae, and five related subfamilies of Accipitriformes (Accipitrinae, Circinae, Buteoninae, Haliaeetinae, and Milvinae), the duplications were evolving independently for at least 14-47 Myr. Different portions of control regions in Cathartiformes showed conflicting phylogenetic signals indicating that some sections of these regions were homogenized at a frequency higher than the rate of speciation, whereas others have still evolved separately.

Keywords: Accipitriformes; Aves; Cathartiformes; ancestral state; concerted evolution; control region; duplication; gene order; mitochondrial genome; mitogenome; phylogeny; rearrangement.


Figures

<sc>Fig</sc>. 1.
Fig. 1.
The comparison of mitochondrial gene orders between ND5 and 12S rRNA for a typical vertebrate gene order (A), a typical avian gene order (B), an ancestral duplicated gene order assuming the tandem duplication of the cytb to CR segment (C), and rearrangements observed in Cathartiformes, Accipitriformes, and Strigiformes (D) and including the most fully duplicated avian gene order (GO-FD) as well as gradually degenerated rearrangements in Accipitriformes (GO-II, GO-IV) and Strigiformes (GO-S1, S2, and S3). ND5, NADH dehydrogenase subunit 5 gene; cytb, cytochrome b gene; T, tRNA gene for threonine; P, tRNA gene for proline; ND6, NADH dehydrogenase subunit 6; E, tRNA gene for glutamic acid; CR, control region; F, tRNA gene for phenylalanine; 12S, 12S rRNA gene. Pseudogenes are marked by ψ and colored correspondingly to their functional gene copy.
<sc>Fig</sc>. 2.
Fig. 2.
Phylogenetic tree obtained in MrBayes showing relationships between Cathartiformes and Accipitriformes with Strigiformes used as an outgroup. The values at nodes, in the following order MB/PB/IQ/MP, indicate: posterior probabilities found in MrBayes (MB) and PhyloBayes (PB) as well as bootstrap percentages in IQ-TREE (IQ) and support in Shimodara–Hasegawa-like approximate likelihood ratio test calculated in morePhyML (MP). The asterisk “*” indicates the maximal possible support value. The posterior probabilities <0.5 and the percentages <50% were marked by a dash “-.” The number after species name indicates the number of individual.
<sc>Fig</sc>. 3.
Fig. 3.
Strategy used in this study for identification of gene orders within duplicated regions in the mitogenomes of Cathartes aura (A), Cathartes burrovianus (B), Coragyps atratus (B), Sagittarius serpentiarius (B), Sarcoramphus papa (B), and Vultur gryphus (B). L, tRNA for leucine; ND5, NADH dehydrogenase subunit 5; cytb, cytochrome b; T, tRNA for threonine; P, tRNA for proline; ND6, NADH dehydrogenase subunit 6; E, tRNA for glutamic acid; CR, control region; F, tRNA for phenylalanine; 12S, 12S rRNA; V, tRNA for valine; 16S, 16S rRNA. ND5-F, Cytb-F, CR-R, D-F, D-R, CR-F, 12S-R: primers that were used for amplification of three overlapping mitogenomic fragments.
<sc>Fig</sc>. 4.
Fig. 4.
The maximum parsimony and maximum likelihood reconstruction of ancestral states as well as mapping of three mitochondrial gene orders (GO-FD, GO-II, GO-IV, shown in fig. 1) onto the phylogenetic relationships of Cathartiformes and Accipitriformes. The values and area of colors at nodes correspond to the probability of the given ancestral state. The number after species name indicates the number of individual.
<sc>Fig</sc>. 5.
Fig. 5.
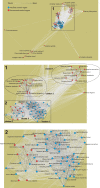
Cluster analysis of 45 pairs of control regions sequences (the first and the second copies) from representatives of Accipitriformes, Cathartiformes, and Strigiformes made in CLANS software (Frickey and Lupas 2004). The analyzed sequences are represented by vertices connected by edges reflecting attractive forces proportional to the negative logarithm of E-value calculated for the high scoring segment pairs (HSPs). The gray shade intensity of the connections is proportional to these forces. The edges with E-value <0.001 are shown. The number after species name indicates the number of individual.
<sc>Fig</sc>. 6.
Fig. 6.
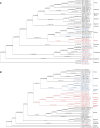
Consensus cladograms of phylogenetic trees inferred in four programs, MrBayes, PhyloBayes, IQ-TREE, and (more)PhyML, including the second control region copies of Aegypius monachus (A), Gyps fulvus (B), and Spilornis cheela (B and C). Pairs of CRs from the same species are colored, whereas CRs without the second copy in the tree are in black. The blue and red colors indicate the corresponding first and second copies of CR, respectively. The taxa names are in the format Genus_species-X_CY, where X is the individual number (if present) and Y is the number of control region, that is, 1 or 2. The values at nodes, in the following order N/MB/PB/SH-I/BP-I/SH-P/BP-P, indicate the number of trees containing a given node (N), posterior probabilities found in MrBayes (MB) and PhyloBayes (PB), as well as SH-aLRT and nonparametric bootstrap support values calculated in IQ-TREE (SH-I and BP-I) and (more)PhyML (SH-P and BP-P). The posterior probabilities <0.5 and the percentages <50% were indicated by a dash “-.” SH-aLRT means approximate likelihood ratio test based on Shimodara–Hasegawa procedure. See supplementary table S6, Supplementary Material online, for details about the data sets.
<sc>Fig</sc>. 7
Fig. 7
Consensus cladograms of phylogenetic trees inferred in four programs, MrBayes, PhyloBayes, IQ-TREE, and (more)PhyML, including the second control region copies of representatives from Aquilinae (A) as well as Circinae, Accipitrinae, Buteoninae, Milvinae, and Haliaeetinae (B). For other explanations, see figure 6.
<sc>Fig</sc>. 8.
Fig. 8.
Observed phylogenetic positions of second control region copies from given species or groups of Accipitriformes. Their most frequent positions in the phylogenetic trees are indicated by arrows. The number of phylogenetic trees supporting the given position is shown in black fonts; the number of tree topology tests that did not reject the given position is shown in blue fonts; the number of tree topology tests that rejected the given position is shown in red fonts. The taxa names are in the format Genus_species-X_CY, where X is the individual number (if present) and Y is the number of control region, that is, 1 or 2.
<sc>Fig</sc>. 9.
Fig. 9.
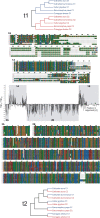
Differences between log-likelihood values for individual alignment sites of Cathartiformes control regions for two tree topologies t1 and t2 assuming different relationships between CRs (the plot inside). Above and under the plot, there are these two trees and alignment fragments supporting the given topology. The position of these fragments is marked in the plot. The labels C1 and C2 as well as blue and red colors indicate the corresponding first and second copies of CR, respectively. Ca, Cathartes aura; Cb, Cathartes burrovianus; Vg, Vultur gryphus; Sp, Sarcoramphus papa; Co, Coragyps atratus.
<sc>Fig</sc>. 10.
Fig. 10.
Box plots of differences between length of tree branches leading to CR2s and CR1s sequences of individual species calculated from all trees. The part of the plot for small values was enlarged and presented as an inset. The thick line indicates the median, the boxes show the quartile range and the whiskers denote the range without outliers.
<sc>Fig</sc>. 11.
Fig. 11.
Probable evolution of control region duplications superimposed onto the phylogeny of Strigiformes, Cathartiformes, and Accipitriformes. Two CRs were indicated as blue and red lines. The tonal transition from blue to red indicates gradual homogenization of CR sequences.

Similar articles

Cited by

References

    1. Abbott CL, Double MC, Trueman JW, Robinson A, Cockburn A.. 2005. An unusual source of apparent mitochondrial heteroplasmy: duplicate mitochondrial control regions in Thalassarche albatrosses. Mol Ecol. 14(11):3605–3613. - PubMed
    1. Akiyama T, et al.2017. Gene duplication and concerted evolution of mitochondrial DNA in crane species. Mol Phylogenet Evol. 106:158–163. - PubMed
    1. Anisimova M, Gascuel O.. 2006. Approximate likelihood-ratio test for branches: a fast, accurate, and powerful alternative. Syst Biol. 55(4):539–552. - PubMed
    1. Arndt A, Smith MJ.. 1998. Mitochondrial gene rearrangement in the sea cucumber genus Cucumaria. Mol Biol Evol. 15(8):1009–1016. - PubMed
    1. Bernt M, Braband A, Schierwater B, Stadler PF.. 2013. Genetic aspects of mitochondrial genome evolution. Mol Phylogenet Evol. 69(2):328–338. - PubMed

Publication types