

Detecting Heterogeneity of Intervention Effects Using Analysis and Meta-analysis of Differences in Variance Between Trial Arms
- PMID: 34432720
- PMCID: PMC8478324
- DOI: 10.1097/EDE.0000000000001401
Detecting Heterogeneity of Intervention Effects Using Analysis and Meta-analysis of Differences in Variance Between Trial Arms
Abstract
Background: Randomized controlled trials (RCTs) with continuous outcomes usually only examine mean differences in response between trial arms. If the intervention has heterogeneous effects, then outcome variances will also differ between arms. Power of an individual trial to assess heterogeneity is lower than the power to detect the same size of main effect.
Methods: We describe several methods for assessing differences in variance in trial arms and apply them to a single trial with individual patient data and to meta-analyses using summary data. Where individual data are available, we use regression-based methods to examine the effects of covariates on variation. We present an additional method to meta-analyze differences in variances with summary data.
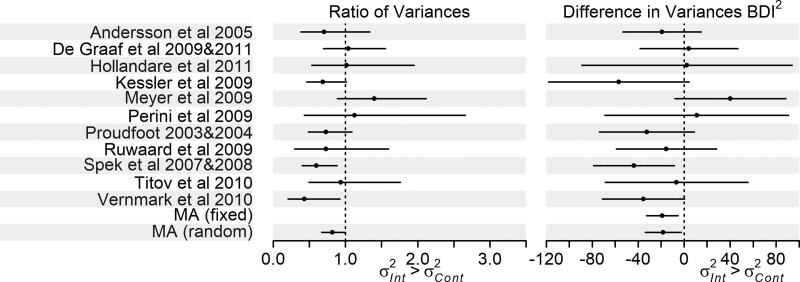
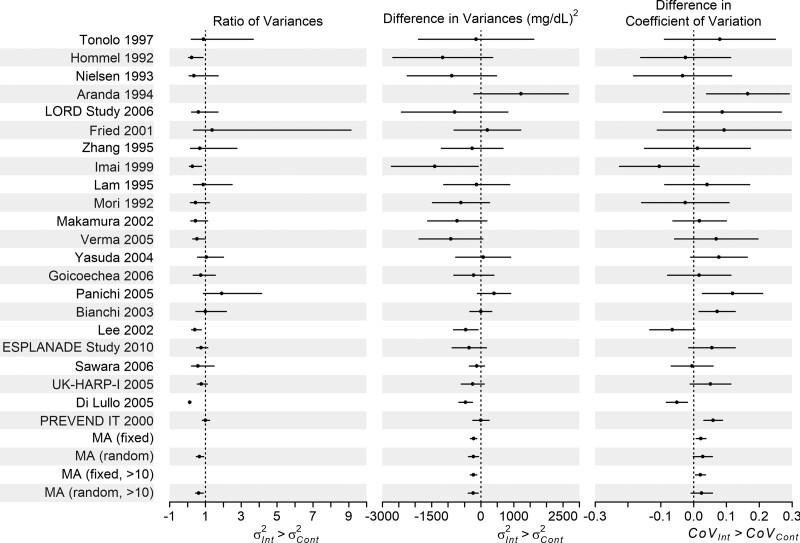
Results: In the single trial, there was agreement between methods, and the difference in variance was largely due to differences in prevalence of depression at baseline. In two meta-analyses, most individual trials did not show strong evidence of a difference in variance between arms, with wide confidence intervals. However, both meta-analyses showed evidence of greater variance in the control arm, and in one example, this was perhaps because mean outcome in the control arm was higher.
Conclusions: Using meta-analysis, we overcame low power of individual trials to examine differences in variance using meta-analysis. Evidence of differences in variance should be followed up to identify potential effect modifiers and explore other possible causes such as varying compliance.
Copyright © 2021 The Author(s). Published by Wolters Kluwer Health, Inc.
Conflict of interest statement
The authors report no conflicts of interest.
Figures
References
-
- Brookes ST, Whitely E, Egger M, Davey Smith G, Mulheran PA, Peters TJ. Subgroup analyses in randomized trials: risks of subgroup-specific analyses; power and sample size for the interaction test. J Clin Epidemiol. 2004;57:229–236. - PubMed
-
- Yusuf S, Wittes J, Probstfield J, Tyroler HA. Analysis and interpretation of treatment effects in subgroups of patients in randomized clinical trials. JAMA. 1991;266:93–98. - PubMed
-
- Alemayehu D, Chen Y, Markatou M. A comparative study of subgroup identification methods for differential treatment effect: performance metrics and recommendations. Stat Methods Med Res. 2018;27:3658–3678. - PubMed
Publication types
MeSH terms
Grants and funding
LinkOut - more resources
Full Text Sources
