Observational Study
. 2021 Aug 25;16(8):e0256436.
doi: 10.1371/journal.pone.0256436. eCollection 2021.

Clinical correlates of circulating cell-free DNA tumor fraction

Affiliations
Observational Study

Clinical correlates of circulating cell-free DNA tumor fraction

Joerg Bredno et al. PLoS One. .

Abstract

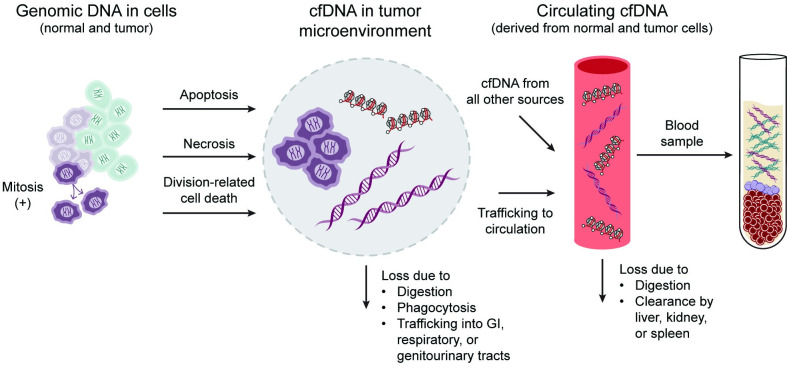
Background: Oncology applications of cell-free DNA analysis are often limited by the amount of circulating tumor DNA and the fraction of cell-free DNA derived from tumor cells in a blood sample. This circulating tumor fraction varies widely between individuals and cancer types. Clinical factors that influence tumor fraction have not been completely elucidated.

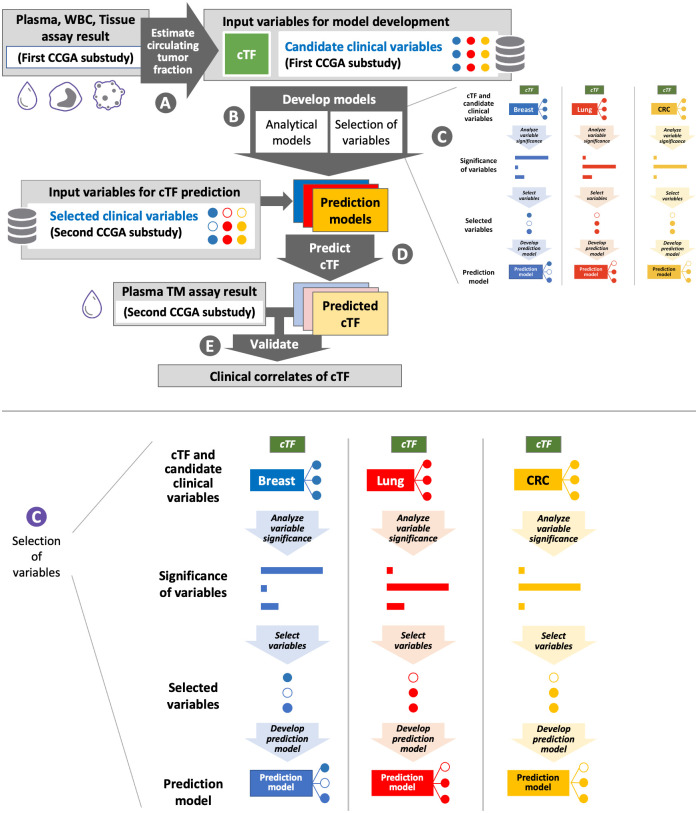
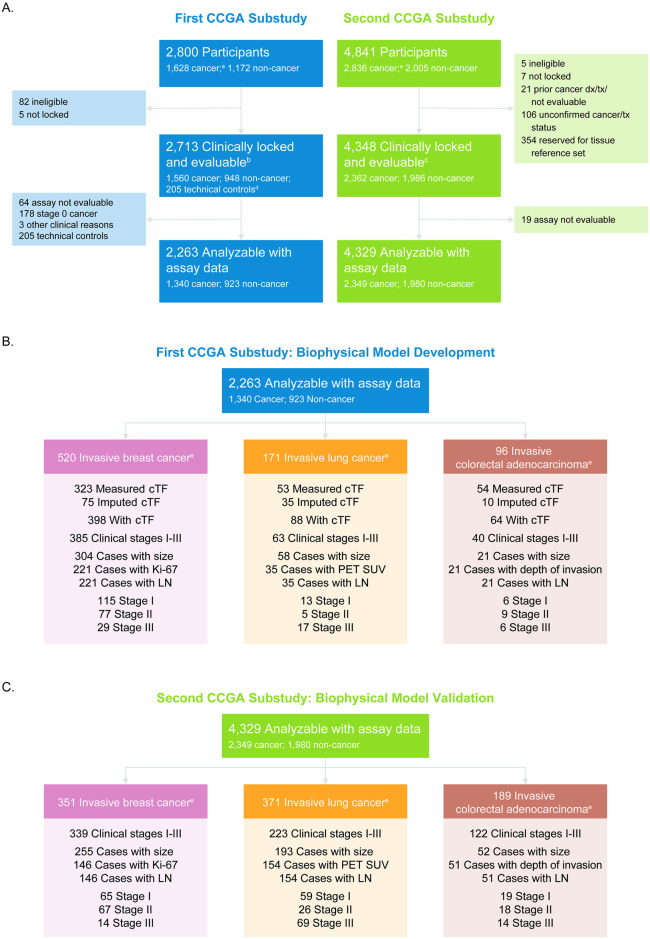
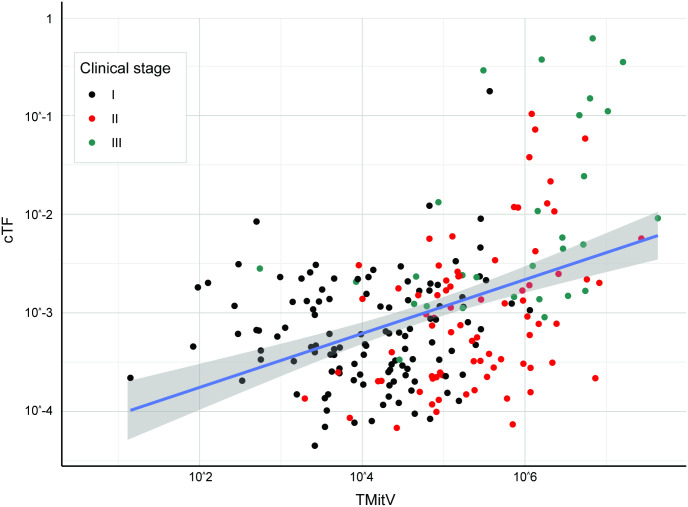
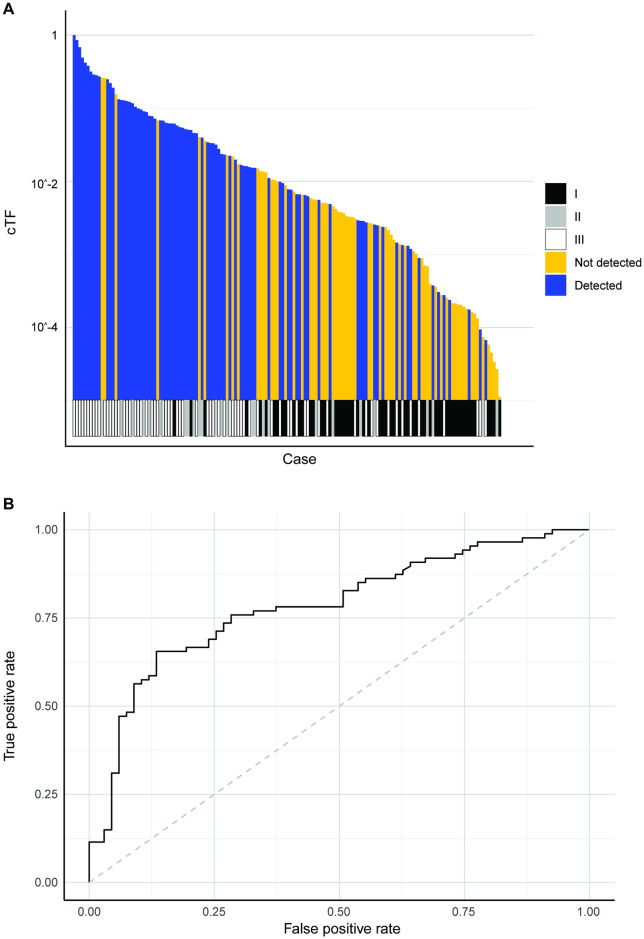
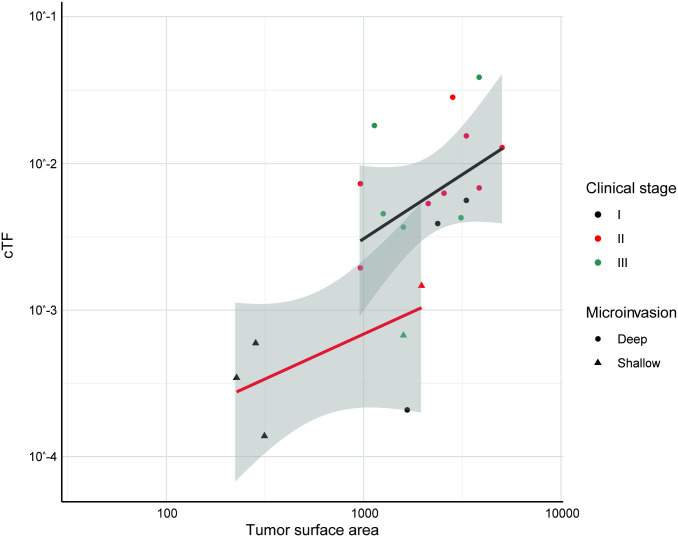
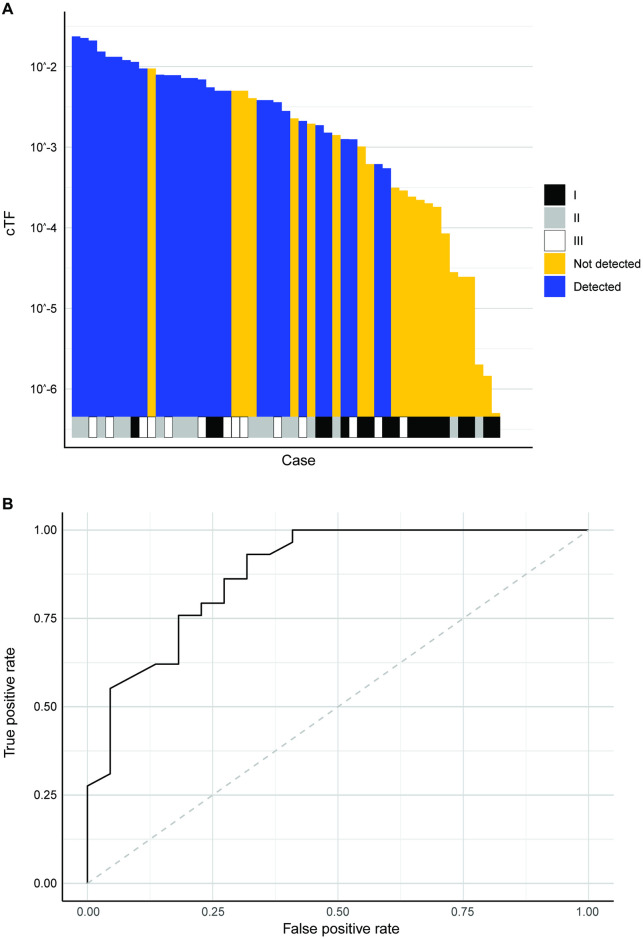
Methods and findings: Circulating tumor fraction was determined for breast, lung, and colorectal cancer participant samples in the first substudy of the Circulating Cell-free Genome Atlas study (CCGA; NCT02889978; multi-cancer early detection test development) and was related to tumor and patient characteristics. Linear models were created to determine the influence of tumor size combined with mitotic or metabolic activity (as tumor mitotic volume or excessive lesion glycolysis, respectively), histologic type, histologic grade, and lymph node status on tumor fraction. For breast and lung cancer, tumor mitotic volume and excessive lesion glycolysis (primary lesion volume scaled by percentage positive for Ki-67 or PET standardized uptake value minus 1.0, respectively) were the only statistically significant covariates. For colorectal cancer, the surface area of tumors invading beyond the subserosa was the only significant covariate. The models were validated with cases from the second CCGA substudy and show that these clinical correlates of circulating tumor fraction can predict and explain the performance of a multi-cancer early detection test.

Conclusions: Prognostic clinical variables, including mitotic or metabolic activity and depth of invasion, were identified as correlates of circulating tumor DNA by linear models that relate clinical covariates to tumor fraction. The identified correlates indicate that faster growing tumors have higher tumor fractions. Early cancer detection from assays that analyze cell-free DNA is determined by circulating tumor fraction. Results support that early detection is particularly sensitive for faster growing, aggressive tumors with high mortality, many of which have no available screening today.


Conflict of interest statement

I have read the journal’s policy and the authors of this manuscript have the following competing interests: Author J.B. is an employee of GRAIL, Inc. with equity in the company, and holds equity in Roche. Author J.L. was an employee of GRAIL, Inc. at the time of the study, and is currently an employee of Genentech, Inc. (South San Francisco, CA). Authors O.V. and A.J. are employees of GRAIL, Inc. with equity in the company, and hold equity in Illumina. Author A.M.A. was an employee of GRAIL, Inc. at the time of the study, is currently an employee of Illumina, Inc. (San Diego, CA), and is an advisor to and an equity holder in Foresite Labs and Myst Therapeutics. Since submission of this article for peer review at PLOS ONE, GRAIL, Inc. has launched a commercially available multi-cancer early detection test product (GalleriTM). We confirmed that this does not alter our adherence to PLOS ONE policies on sharing data and materials.

Figures

Fig 1
Fig 1. Depiction of origin and fates of circulating tumor DNA relative to cell-free DNA.
Origin and fates of cfDNA influence the amount of ctDNA in a blood sample. Both normal cells (light green) and tumor cells (light purple) can shed DNA during cell death (e.g., by apoptosis or necrosis) [–16]. In cancer, tumor cell mitoses and tumor growth increase the amount of DNA that can be shed into the tumor microenvironment (TME) [17]. In the TME, cfDNA has several fates: it may be digested [18, 19]; phagocytosed [17, 21]; lost into the lumen of the gastrointestinal, pulmonary, or genitourinary tract [22]; or trafficked into circulation where it is pooled with cfDNA from other cells in the body [21, 23]. After entering circulation, cfDNA is subject to further digestion or clearance in the liver, kidney, or spleen [23]. As a result, cfDNA in a blood sample is composed of tumor and normal cell DNA that is shed by dying cells and has not been removed by various clearance mechanisms. cfDNA: cell-free DNA, ctDNA: circulating tumor DNA, TME: tumor microenvironment.
Fig 2
Fig 2. Flow diagram of data analysis.
cTF was obtained from plasma, WBC, and tissue assay results (step A) and candidate clinical variables were input for model development (step B). During model development, candidate variables that contributed significantly to cTF were selected as correlates of tumor fraction (step C, insert shown enlarged). Filled and hollow dots depict variables selected or not selected, respectively. cTF was predicted using only selected clinical variables (step D) and was validated by comparison to plasma TM assay results (step E). CCGA: Circulating Cell-free Genome Atlas, cfDNA: cell-free DNA, CRC, colorectal cancer, cTF: Circulating tumor fraction, WBC: White blood cells, TM: Targeted Methylation.
Fig 3
Fig 3. CONSORT diagram.
(A) CONSORT diagram depicting the number of clinically evaluable cases with evaluable assay results for model generation from the first CCGA substudy (left) and model validation from the second CCGA substudy (right). (B) Cases available for model development from the first CCGA substudy and (C) cases available for model validation from the second CCGA substudy for breast (left), lung (center), and colorectal cancers (right). Cases were filtered by availability of clinical data (size of primary tumor, Ki-67 for breast cancer, PET SUV for lung cancer, depth of microinvasion for colorectal cancer, respectively, and presence of tumor-involved lymph nodes) for modeling and available ground truth or imputed tumor fraction. cTF: Circulating Tumor fraction, LN: information on number of tumor-involved lymph nodes, PET SUV, positron emission tomography standardized uptake value. aAt enrollment, prior to confirmation of cancer status. bBy First CCGA substudy definition. cBy Second CCGA substudy definition. dNon-smoking participants under the age of 35. eConfirmed cancer status.
Fig 4
Fig 4. Breast cancer cTF by clinical stage and relation to WGBS classifier score.
(A) cTF by clinical stage for breast cancer. (B) WGBS classifier score [26] by cTF for breast cancer. Samples are colored by clinical stage and samples with imputed cTF are shown as triangles. cTF: Circulating Tumor fraction, WGBS: Whole-genome bisulfite sequencing. Non-informative: Confirmed invasive cancer with insufficient clinical information to determine stage.
Fig 5
Fig 5. cTF increases with breast cancer tumor mitotic volume.
cTF increased with TMitV (in mm3) for breast cancer. Black, red, and green dots depict samples from stages I, II, and II, respectively (Model development and validation was limited to clinical stages I-III). Linear fit and 95% confidence intervals are shown in blue and gray, respectively. cTF: Circulating cfDNA tumor fraction, TMitV: Tumor mitotic volume.
Fig 6
Fig 6. Breast cancer model validation.
(A) Detection by TM assay for breast cancer cases sorted by TMitV. Clinical stage is shown at the bottom. (B) ROC to predict breast cancer detection by TM assay using TMitV. cTF: Circulating tumor fraction, ROC: Receiver operating characteristic curve, TM: Targeted methylation, TMitV: Tumor mitotic volume.
Fig 7
Fig 7. Lung cancer cTF by clinical stage and relation to WGBS classifier score.
(A) cTF by clinical stage for lung cancer. (B) WGBS classifier score by cTF for lung cancer. Samples are colored by clinical stage and samples with imputed cTF are shown as triangles. cTF: Circulating Tumor fraction, WGBS: Whole-genome bisulfite sequencing. Non-informative: Confirmed invasive cancer with insufficient clinical information to determine stage.
Fig 8
Fig 8. cTF increases with lung cancer excessive lesion glycolysis.
cTF increases with ELG (in mm3) for lung cancer. Black, red, and green dots depict samples from stages I, II, and II, respectively (Model development and validation was limited to clinical stages I-III). Linear fit and 95% confidence intervals are shown in blue and gray, respectively. cTF: Circulating tumor fraction, ELG: Excessive lesion glycolysis.
Fig 9
Fig 9. Lung cancer model validation.
(A) Detection by TM assay for lung cancer samples sorted by ELG. (B) ROC to predict lung cancer detection by TM assay using ELG. cTF: Circulating tumor fraction, ELG: Excessive lesion glycolysis, ROC: Receiver operating characteristic curve, TM: Targeted methylation.
Fig 10
Fig 10. Colorectal cancer cTF distribution by clinical stage, depth of microinvasion, and relation to WGBS classifier score.
(A) cTF by clinical stage for colorectal cancer. (B) cTF by depth of microinvasion for colorectal cancer. (C) WGBS classifier score by cTF for colorectal cancer. Samples are colored by clinical stage and samples with imputed cTF are shown as triangles. cTF: Circulating Tumor fraction, WGBS: Whole-genome bisulfite sequencing. Non-informative: Confirmed invasive cancer with insufficient clinical information to determine stage.
Fig 11
Fig 11. cTF increases with TSA and depth of microinvasion for colorectal cancer.
cTF increased with TSA (in mm2) and depth of microinvasion for colorectal adenocarcinomas. Dots show cases that invade beyond the subserosa, triangles show cases that do not invade beyond the subserosa. Black, red, and green dots depict samples from stages I, II, and III, respectively. (Model development and validation was limited to clinical stages I-III). Linear fit and 95% confidence intervals are shown in red (shallow microinvasion), black (deep microinvasion), and gray, respectively. cTF: Circulating tumor fraction, TSA: Tumor surface area.
Fig 12
Fig 12. Colorectal cancer model validation.
(A) Detection by TM assay for colorectal cancer cases sorted by TSA weighted by depth of microinvasion. Clinical stage is shown at the bottom. (B) ROC to predict colorectal cancer detection by TM assay using weighted TSA. cTF: Circulating tumor fraction, ROC: Receiver operating characteristic curve, TM: Targeted methylation, TSA: Tumor surface area.

References

    1. Cescon DW, Bratman SV, Chan SM, Siu LL. Circulating tumor DNA and liquid biopsy in oncology. Nat Cancer. 2020;1: 276–290. doi: 10.1038/s43018-020-0043-5 - DOI - PubMed
    1. Corcoran RB. Circulating Tumor DNA: Clinical Monitoring and Early Detection. Annu Rev Cancer Biol. 2019;3: 187–201. doi: 10.1146/annurev-cancerbio-030518-055719 - DOI
    1. Bettegowda C, Sausen M, Leary RJ, Kinde I, Wang Y, Agrawal N, et al.. Detection of circulating tumor DNA in early- and late-stage human malignancies. Sci Transl Med. 2014;6: 224ra24. doi: 10.1126/scitranslmed.3007094 - DOI - PMC - PubMed
    1. Diehl F, Li M, Dressman D, He Y, Shen D, Szabo S, et al.. Detection and quantification of mutations in the plasma of patients with colorectal tumors. Proc Natl Acad Sci. 2005;102: 16368–16373. doi: 10.1073/pnas.0507904102 - DOI - PMC - PubMed
    1. Venn O, Hubbell E, Sakarya O, Chang C, Halks-Miller M, Steffen K, et al. Tumor shedding into cell-free DNA (cfDNA) is associated with high-mortality cancers [poster]. 31st Annual Meeting on The Biology of Genomes. Cold Spring Harbor, NY: Cold Spring Harbor Laboratory; 2019. https://meetings.cshl.edu/abstracts.aspx?meet=GENOME&year=19

Publication types

Substances

Associated data