. 2021 Aug 25;17(8):e1009875.
doi: 10.1371/journal.ppat.1009875. eCollection 2021 Aug.

Short- and long-range cis interactions between integrated HPV genomes and cellular chromatin dysregulate host gene expression in early cervical carcinogenesis

Affiliations

Short- and long-range cis interactions between integrated HPV genomes and cellular chromatin dysregulate host gene expression in early cervical carcinogenesis

Ian J Groves et al. PLoS Pathog. .

Abstract

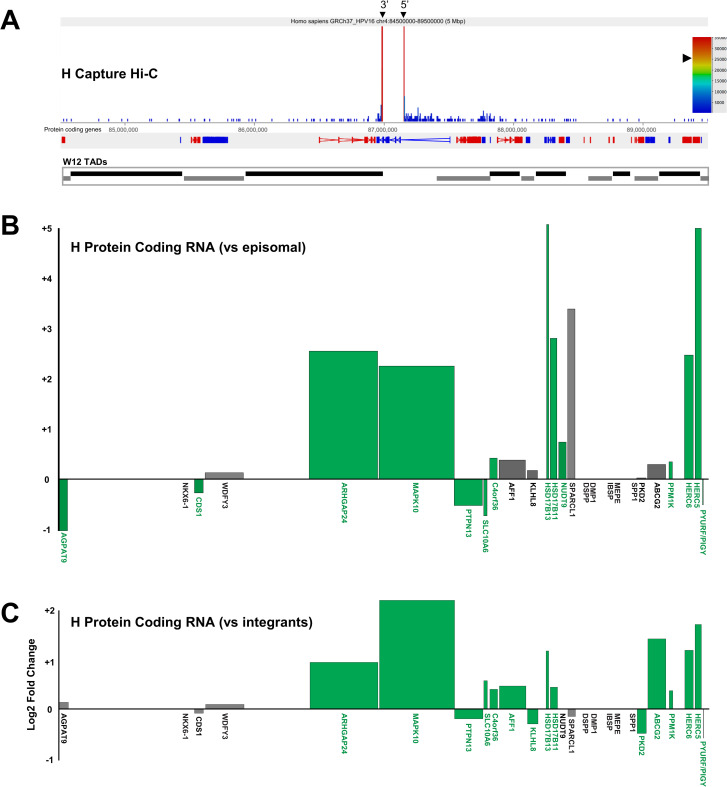
Development of cervical cancer is directly associated with integration of human papillomavirus (HPV) genomes into host chromosomes and subsequent modulation of HPV oncogene expression, which correlates with multi-layered epigenetic changes at the integrated HPV genomes. However, the process of integration itself and dysregulation of host gene expression at sites of integration in our model of HPV16 integrant clone natural selection has remained enigmatic. We now show, using a state-of-the-art 'HPV integrated site capture' (HISC) technique, that integration likely occurs through microhomology-mediated repair (MHMR) mechanisms via either a direct process, resulting in host sequence deletion (in our case, partially homozygously) or via a 'looping' mechanism by which flanking host regions become amplified. Furthermore, using our 'HPV16-specific Region Capture Hi-C' technique, we have determined that chromatin interactions between the integrated virus genome and host chromosomes, both at short- (<500 kbp) and long-range (>500 kbp), appear to drive local host gene dysregulation through the disruption of host:host interactions within (but not exceeding) host structures known as topologically associating domains (TADs). This mechanism of HPV-induced host gene expression modulation indicates that integration of virus genomes near to or within a 'cancer-causing gene' is not essential to influence their expression and that these modifications to genome interactions could have a major role in selection of HPV integrants at the early stage of cervical neoplastic progression.


Conflict of interest statement

The authors have declared that no competing interests exist.

Figures

Fig 1
Fig 1. HPV16-specific Region Capture Hi-C determines definitive HPV16 integration sites.
CIRCOS plots show sequence interactions between HPV16 (orange) and host chromosomes (various) for clones (A) G2, (B) D2, (C) H, (D) F and (E) A5. Each line within the circle represents a significant virus-host read indicating an above background interaction between a region of the HPV16 genome and the host. Reads are coloured to match individual HPV16 genes: E6 = green, E7 = orange, E1 = yellow, E2 = blue, E4 = red, E5 = pink, L1 = dark green, L2 = light blue and non-coding regions = black. Percentage of reads coming from different regions of the virus is indicated by the histogram on the outside of the HPV16 genome, which is split into 500 bp windows (red bars). HPV16 RNA bait fragments used in the Capture Hi-C experiment are indicated on the outside of the CIRCOS plot (blue curved lines); interacting reads are largely absent due to either deletion of the genome region during integration or specifically from the E1 gene due to the necessary length of the bait covering this region (see Materials and Methods section for further information). Grey shaded boxes denote the region of HPV16 genome deleted in individual cell lines. Presented data were generated using the Gothic program and plots are not to scale. Insets show zoomed sites of integration, with interaction divergence in clones G2 and H.
Fig 2
Fig 2. Identification of short- and long-range interactions between integrated HPV16 genomes and the host chromosome in W12 clone G2.
(A) Capture Hi-C data is presented 122.5 kbp across the HPV16 integration locus. The 5’ and 3’ breakpoints of the virus genome (which is not aligned here) are indicated by the tallest red bars and are labelled with black arrowheads, being inverted in comparison to the direction of host sequence due to the ‘looping’ integration mechanism. (B) Capture Hi-C data is presented 700 kbp across the HPV16 integration locus. The black line above the read peaks indicates the genomic window seen in panel A. Peaks of reads indicate regions of the host genome interacting in cis with the integrated virus genome. Short-range interactions between the HPV16 genome and host regions were resolved by consensus using Gothic and are shown beneath the panel, originating from the HPV16 integration site (inverted black arrowhead). (C) Capture Hi-C data is presented 5 Mbp across the HPV16 integration locus. The black line above the read peaks indicates the genomic window seen in panel B. Peaks of reads indicate regions of the host interacting in cis with the integrated virus. Long-range interactions between the HPV16 genome and host regions were resolved by consensus using Gothic and are shown beneath the panel, originating from the HPV16 integration site (inverted black arrowhead). Statistically significant interactions were determined by a cumulative binomial test where adjusted p-value (the q-value), was set a threshold of q<0.05. In each panel, the scale bar represents the normalised read count. Additionally, protein-coding genes are shown in the first track with the direction of each gene indicated by colour (red, forward; blue, reverse), followed by the alignment of ChIP-seq data from the NHEK cell line (ENCODE). Post-translational histone modifications of host enhancers (H3K27ac, H3K4me1; green), active promoters (H3K4me2, H3K4me3; green), repressed chromatin H3K27me3 (red), DNaseI hypersensitivity sites (blue) and CTCF sites (purple) are shown. Coordinates presented for each window are indicated at the top of each figure.
Fig 3
Fig 3. Identification of short- and long-range interactions between integrated HPV16 genomes and the host chromosome in W12 clone D2.
(A) Capture Hi-C data is presented 122.5 kbp across the HPV16 integration locus. The 5’ and 3’ breakpoints of the virus genome (which is not aligned here) are indicated by the tallest red bars and are labelled with black arrowheads. (B) Capture Hi-C data is presented 1.4 Mbp across the HPV16 integration locus. The black line above the read peaks indicates the genomic window seen in panel A. Peaks of reads indicate regions of the host interacting in cis with the integrated virus genome. Short-range interactions between the HPV16 genome and host regions were resolved by consensus with Gothic and are shown beneath the panel, originating from the HPV16 integration site (inverted black arrowhead). Statistically significant interactions were determined by a cumulative binomial test where adjusted p-value (the q-value), was set a threshold of q<0.05. In each panel, the scale bar represents the normalised read count. Additionally, protein-coding genes are shown in the first track with the direction of each gene indicated by colour (red, forward; blue, reverse), followed by the alignment of ChIP-seq data from the NHEK cell line (ENCODE). Post-translational histone modifications of host enhancers (H3K27ac, H3K4me1; green), active promoters (H3K4me2, H3K4me3; green), repressed chromatin H3K27me3 (red), DNaseI hypersensitivity sites (blue) and CTCF sites (purple) are shown. Coordinates presented for each window are indicated at the top of each figure.
Fig 4
Fig 4. Validation of HPV16-host genome cis interactions in W12 clone G2 by fluorescence in situ hybridisation (FISH).
(A) Schematic detailing the complementarity of the DNA probes used on the integrated and unintegrated alleles of a portion of chromosome 5 (51–54 Mbp) in W12 clone G2 to confirm interaction between the HPV16 genome (black arrow) and ARL15 gene (red arrow): Control probe (51,676,020–51,873,551; purple), HPV16 probe (green), and ARL15 probe (53,473,886–53,584,235; red). Possible interactions between probe regions are also highlighted. (B) Representative images of the probes hybridised to W12 clone G2 genome of one cell in a 3D FISH experiment (nucleus boundary, blue), a composite image with DAPI (NUC, blue) stain, and interpretation of the associated chromosome spatial conformations. A zoom of the interaction signals is inset. (C) Box-whiskers plot and (D) frequency distribution chart of the distance between both sets of FISH probes in the integrated allele of chromosome 5: HPV16:ARL15 (red box) and HPV16:control (purple box). (E) Box-whiskers plot and (F) frequency distribution chart of the distance between the Control and ARL15 probes in both the integrated (green) and unintegrated (grey) alleles. Lower and upper whiskers denote the 10th and 90th percentiles, respectively, of the distribution. The lower and upper limits of the boxes indicate the 25th and 75th percentiles, respectively. Solid line in the box denotes the median. Numbers below the box plots denote mean ± SEM (n = 585) from which an unpaired, two-tailed Students T-test was conducted; *p<0.05, ****p<0.0001.
Fig 5
Fig 5. HPV16 genome integration does not disrupt host topologically associating domain (TAD) boundaries at the integration site in W12 clones G2 and D2.
(A, D) Hi-C data for W12 clone G2 is compared to (B, E) Hi-C data for W12 clone D2 using (C, F) an insulation score interpreting the boundaries of topologically associating domains (TADs) for HPV16 integration sites within W12 clone G2 (Chr5: 50–55 Mbp; left column) and W12 clone D2 (Chr5: 164.6–169.6 Mbp, right column) showing no significant change to either window. Black arrowhead = integration site.
Fig 6
Fig 6. HPV16 genome integration and virus:host genome interactions lead to significant modulation of host gene expression in W12 clone G2.
(A) Capture Hi-C data is presented across Chr5:50–55 Mbp for clone G2. HPV16 integration site is indicated with a black arrowhead and CTCF sites (purple) aligned across the top of the panel. Aligned protein coding genes are shown in the top track (rightward, red; leftward, blue) with the extent of W12 topologically associating domains (TADs) shown below. Charts indicating the transcript level of host protein coding genes within the 5 Mb region of clone G2 relative to (B) W12 episomal level and (C) mean control level across all other integrant clones. All data is shown as a Log2 fold-change with statistically significant changes indicated by green bars (p<0.05, negative binomial Wald test). Gene length is indicated by width of the corresponding bar.
Fig 7
Fig 7. HPV16 genome integration and virus:host genome interactions lead to significant modulation of host gene expression in W12 clone D2.
(A) Capture Hi-C data is presented across Chr5:164.4–169.6 Mbp for clone D2. HPV16 integration site is indicated with a black arrowhead and CTCF sites (purple) aligned across the top of the panel. Aligned protein coding genes are shown in the top track (rightward, red; leftward, blue) with the extent of W12 topologically associating domains (TADs) shown below. Charts indicating the transcript level of host protein coding genes within the 5 Mb region of clone D2 relative to (B) W12 episomal level and (C) mean control level across all other integrant clones. All data is shown as a Log2 fold-change with statistically significant changes indicated by green bars (p<0.05, negative binomial Wald test). Gene length is indicated by width of the corresponding bar.
Fig 8
Fig 8. HPV16 genome integration leads to significant, but differential, modulation of host gene expression in W12 clones F and A5.
(A) Representative Capture Hi-C data is presented across Chr4:72–77 Mbp for clone F and A5. HPV16 integration site is indicated with black arrowheads (breakpoints) and CTCF sites (purple) are aligned across the top of the panel. Aligned protein coding genes are shown in the top track (rightward, red; leftward, blue) with the extent of W12 topologically associating domains (TADs) shown below. Charts indicating the transcript level of host protein coding genes within the 5 Mb region of clone (B-C) F and (D-E) A5 relative to (B, D) W12 episomal level and (C, E) mean control level across all other integrant clones. All data is shown as a Log2 fold change with statistically significant changes indicated by green bars (p<0.05, negative binomial Wald test). Gene length is indicated by width of the corresponding bar.
Fig 9
Fig 9. HPV16 genome integration leads to significant modulation of host gene expression in W12 clone H.
(A) Capture Hi-C data is presented across Chr4:84.5–89.5 Mbp for clone H. HPV16 integration site is indicated with a black arrowheads (breakpoints) and CTCF sites (purple) aligned across the top of the panel. Aligned protein coding genes are shown in the top track (rightward, red; leftward, blue) with the extent of W12 topologically associating domains (TADs) shown below. Charts indicating the transcript level of host protein coding genes within the 5 Mb region of clone H relative to (B) W12 episomal level and (C) mean control level across all other integrant clones. All data is shown as a Log2 fold-change with statistically significant changes indicated by green bars (p<0.05, negative binomial Wald test). Gene length is indicated by width of the corresponding bar.
Fig 10
Fig 10. Variance in host gene expression across the host genomic regions containing the HPV16 integration site in W12 clones.
Each left panel indicates the range and variance of host gene expression in W12 integrant clones (A) G2, (B) D2, (C) H, (D) F and (E) A5, focussing on 100 genes either side of the HPV16 integration site. For each clone, host transcript expression levels were compared with the mean of all other integrant clones. In each panel, the HPV16 integration site is centred on ‘bin 0’. Each bin contains five genes, with no overlap between bins. The box and whisker plots illustrate the range of gene expression levels within each bin, with the black bar indicating median values, the box the interquartile range (IQR) and the whiskers the range. The mean gene expression across the whole chromosome is indicated by the solid blue line, while the mean level of gene expression across individual bins is shown by the dotted blue line. The mean variance of gene expression across the whole chromosome is indicated by the solid red line, while the mean variance within individual bins is shown by a dotted red line. All transcript data is Log2 transformed. Each right hand panel shows the significance of the variance (F-test) in gene expression within each bin for clones (F) G2, (G) D2, (H) H, (I) F and (J) A5. Each point represents a five-gene bin, corresponding to those in the left-hand panels. The horizontal lines indicate the significance of the variance in each bin, compared with the variance in gene expression across the whole chromosome (above the dashed red line, p<0.05; above the dashed pink line, p<0.01).

References

    1. de Martel C, Georges D, Bray F, Ferlay J, Clifford GM. Global burden of cancer attributable to infections in 2018: a worldwide incidence analysis. Lancet Glob Health. 2020;8(2):e180–e90. doi: 10.1016/S2214-109X(19)30488-7 - DOI - PubMed
    1. Forman D, de Martel C, Lacey CJ, Soerjomataram I, Lortet-Tieulent J, Bruni L, et al.. Global burden of human papillomavirus and related diseases. Vaccine. 2012;30Suppl 5:F12–23. doi: 10.1016/j.vaccine.2012.07.055 - DOI - PubMed
    1. Arbyn M, Weiderpass E, Bruni L, de Sanjose S, Saraiya M, Ferlay J, et al.. Estimates of incidence and mortality of cervical cancer in 2018: a worldwide analysis. Lancet Glob Health. 2020;8(2):e191–e203. doi: 10.1016/S2214-109X(19)30482-6 - DOI - PMC - PubMed
    1. Jeon S, Allen-Hoffmann BL, Lambert PF. Integration of human papillomavirus type 16 into the human genome correlates with a selective growth advantage of cells. J Virol. 1995;69(5):2989–97. doi: 10.1128/JVI.69.5.2989-2997.1995 - DOI - PMC - PubMed
    1. Groves IJ, Coleman N. Pathogenesis of human papillomavirus-associated mucosal disease. J Pathol. 2015;235(4):527–38. doi: 10.1002/path.4496 - DOI - PubMed

Publication types

MeSH terms