Clinical Trial
. 2021 Aug 24;36(8):109554.
doi: 10.1016/j.celrep.2021.109554.

Functional harmonics reveal multi-dimensional basis functions underlying cortical organization

Affiliations
Clinical Trial

Functional harmonics reveal multi-dimensional basis functions underlying cortical organization

Katharina Glomb et al. Cell Rep. .

Abstract

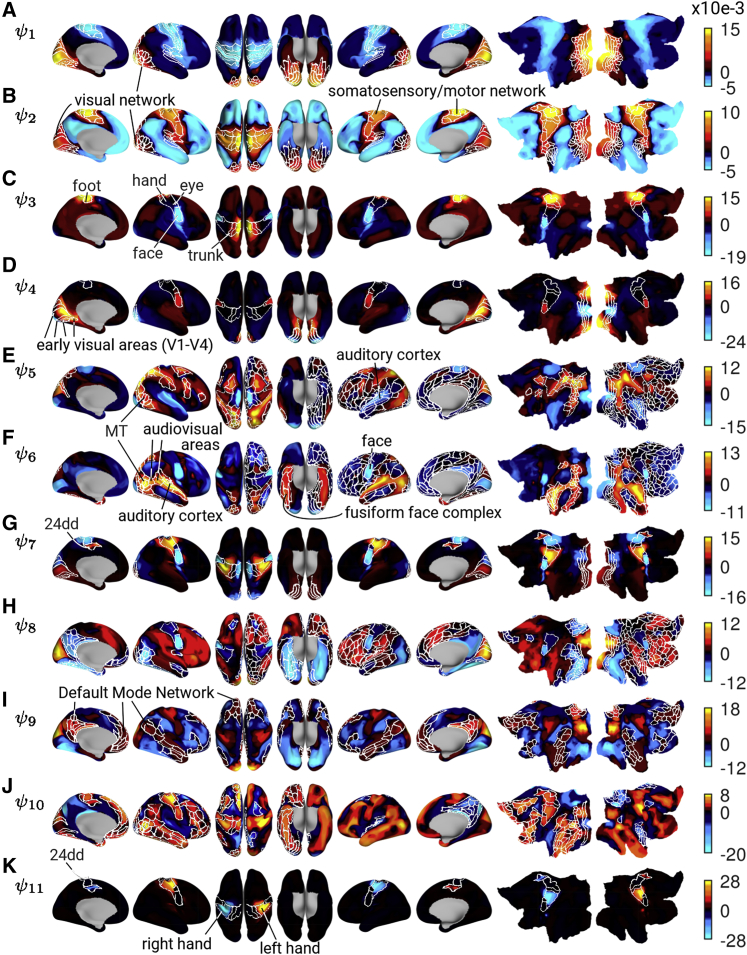
The human brain consists of specialized areas that flexibly interact to form a multitude of functional networks. Complementary to this notion of modular organization, brain function has been shown to vary along a smooth continuum across the whole cortex. We demonstrate a mathematical framework that accounts for both of these perspectives: harmonic modes. We calculate the harmonic modes of the brain's functional connectivity graph, called "functional harmonics," revealing a multi-dimensional, frequency-ordered set of basis functions. Functional harmonics link characteristics of cortical organization across several spatial scales, capturing aspects of intra-areal organizational features (retinotopy, somatotopy), delineating brain areas, and explaining macroscopic functional networks as well as global cortical gradients. Furthermore, we show how the activity patterns elicited by seven different tasks are reconstructed from a very small subset of functional harmonics. Our results suggest that the principle of harmonicity, ubiquitous in nature, also underlies functional cortical organization in the human brain.

Keywords: brain networks; fMRI; functional connectivity; harmonic modes; human cortex.


Conflict of interest statement

Declaration of interests The authors declare no competing interests.

Figures

None
Graphical abstract
Figure 1
Figure 1
Workflow for the estimation of functional harmonics (A) Brain activity measured with functional magnetic resonance imaging (fMRI) in resting state for 812 subjects provided by the Human Connectome Project (HCP; 900 subjects data release). (B) Illustration of brain activity time series of three representative vertices on the cortex (x1, x2,…, xn). (C) The dense functional connectivity (FC) matrix computed from the temporal correlations between the time courses of each pair of vertices as shown in (B) averaged across 812 subjects. (D) Representation of the dense FC as a graph, where the edges indicate strong correlations between the corresponding vertices. The anatomical locations of the vertices are color-coded (Glasser et al., 2016). (E) Functional harmonics are estimated by the eigenvectors of the graph Laplacian computed on the graph representation of the FC. The first five functional harmonics ordered from the lowest to higher spatial frequencies are illustrated on the FC graph representation (top), in the eigenvector format as 59,412 × one-dimensional vectors (middle), and on the cortical surface (bottom). Note that here we show the patterns on the left hemisphere for illustrative purposes, yet the entire cortex was used in the analysis. Likewise, the graph representations in (D) and (E) are shown for a parcellated version of the FC matrix using the HCP parcellation (Glasser et al., 2016), i.e., each node represents an HCP parcel, but the computation of the functional harmonics were performed on the dense FC using 59,412 × 59,412 without any parcellation.
Figure 2
Figure 2
Functional harmonics capture existing characterizations of functional anatomy The first 11 non-constant functional harmonics plotted on the cortical surface. It is clearly visible that the first two functional harmonics (A and B) constitute global gradients over the entire cortex, whereas subsequent maps (C–K) include increasingly more local details. In each functional harmonic, known functional regions (e.g., C), processing streams (e.g., E) or networks (e.g., B) are discernible, and we have annotated the most conspicuous ones. In order to illustrate that similarly colored patches of cortex correspond to known functional regions, borders of HCP parcels have been added (white lines). V1–V4, visual areas 1 to 4; MT, middle temporal visual area; 24 dd, an area that contains a higher order representation of the hand; fusiform face complex, an area that responds specifically to images of human faces. The functional harmonics were derived from the HCP’s dense functional connectivity matrix, which is an average of over 812 subjects.
Figure 3
Figure 3
Functional harmonics capture somatotopy and retinotopy (A) Functional harmonics 3 (ψ3) and 11 (ψ11) in their own space. Vertices are color-coded according to their anatomical locations (see Figure 1D), and the location of 4 somatotopic areas in this space is annotated. (B and C) Retinotopies of functional harmonics 4 (B, ψ4) and 8 (C, ψ8). Each panel shows, on the right, the colors of the respective functional harmonic in early visual areas V1–V4 on a polar plot of eccentricity (distance in degree from the fovea) and angle on the visual field (see legend at the bottom of the figure). On the left, the respective functional harmonic is shown on a flat map of early visual cortex (left hemisphere). V1, V2, V3, and V4: visual areas 1, 2, 3, and 4. The shown figures are derived from the functional harmonics obtained from the HCP’s dense functional connectivity matrix, which is an average over 812 subjects.
Figure 4
Figure 4
Functional harmonics capture specialized brain areas The modified silhouette values (y-axes in all panels) quantifies the degree to which gradients described by the functional harmonics as well as control basis sets are flat within the parcels defined by the HCP parcellation. A modified silhouette value close to 1 indicates homogeneous values within HCP parcels. (A) A comparison between the basis sets indicates that functional harmonics and adjacency eigenvectors have significantly higher modified silhouette values than the other three (Wilcoxon rank-sum test, black bars indicate significant differences at pcorr < 0.05 after Bonferroni correction). Each data point is computed from a matrix that is an average over 812 subjects. (B–F) Modified silhouette values of the first 11 non-constant components of each basis set (colored circles; each data point is computed from a matrix which is an average over 812 subjects) compared to their rotations (gray crosses). The stars above each column indicate significant silhouette values (pcorr < 0.05 after Bonferroni correction, Monte Carlo test with 220 spherical rotations per component). Functional harmonics had the highest number of significant modified silhouette values (10 out of 11).
Figure 5
Figure 5
A small set of functional harmonics suffices to reconstruct diverse task activity maps (A–G) Mean reconstruction errors for each of the 7 task groups and all 6 basis function sets when only the first 11 non-constant components are used (see Figure S4 for results when using more components). (H) One example for a reconstruction using a working memory task. The bottom panel is the original task activation map (working memory—body; see also Data S1, page 6, panel l), and top panels use the number of harmonics indicated on the left to reconstruct it. (I) Results of significance tests comparing normalized reconstruction errors of functional harmonics to other function bases (significant differences at pcorr < 0.05 after Bonferroni correction, Monte Carlo tests with 1,000 permutations). Top: When using only the first 11 components, functional harmonics outperformed each of the other function bases. Bottom: When using the first 100 components (Figure S4), eigenvectors of the dense FC outperformed functional harmonics in 3 task groups. All basis sets were derived from matrices which are averages over the same 812 subjects. The task activity maps (Cohen’s D activation contrast maps) are based on 997 subjects.
Figure 6
Figure 6
Functional harmonics provide a characterization of task activity maps (A) Original task map of the contrast between working memory (face) and average working memory from the HCP task dataset (Barch et al., 2013). (B) Spectral representation of the task map shown in (A) (i.e., the normalized coefficients of the graph Fourier transform quantify the contribution of the first 11 non-constant functional harmonics to the task map). The color indicates the task group (see legend in L). (C) Reconstruction of the task map in (A) when using the functional harmonic with the strongest contribution (highest coefficient) only, the four functional harmonics with the strongest contributions, and the forty functional harmonics with the strongest contributions. (D–F) The same as (A)–(C) using the map of the contrast between motor (right hand) and average motor. (G–I) The same as (A)–(C) using the map of the contrast between motor (trunk) and average motor. (J–L) Confusion matrices. Black entries mark the task map-reconstruction-pair that has the lowest reconstruction error; colored squares indicate the task group. (M) Proportion of reconstructions, for each number of harmonics, which have the minimum reconstruction error with their exact original task map (thick line) and a task map belonging to the same group of tasks as the original map (thin line). Functional harmonics were derived from the HCP’s dense functional connectivity matrix, which is an average of over 812 subjects. The task activity maps (Cohen’s D activation contrast maps) are based on 997 subjects.

References

    1. Adams R.A., Shipp S., Friston K.J. Predictions not commands: active inference in the motor system. Brain Struct. Funct. 2013;218:611–643. - PMC - PubMed
    1. Akam T., Kullmann D.M. Oscillatory multiplexing of population codes for selective communication in the mammalian brain. Nat. Rev. Neurosci. 2014;15:111–122. - PMC - PubMed
    1. Alexander-Bloch A.F., Shou H., Liu S., Satterthwaite T.D., Glahn D.C., Shinohara R.T., Vandekar S.N., Raznahan A. On testing for spatial correspondence between maps of human brain structure and function. Neuroimage. 2018;178:540–551. - PMC - PubMed
    1. Atasoy S., Donnelly I., Pearson J. Human brain networks function in connectome-specific harmonic waves. Nat. Commun. 2016;7:10340. - PMC - PubMed
    1. Atasoy S., Deco G., Kringelbach M.L., Pearson J. Harmonic brain modes: a unifying framework for linking space and time in brain dynamics. Neuroscientist. 2018;24:277–293. - PubMed

Publication types

LinkOut - more resources