Clinical Trial
. 2021 Aug 26;10(1):31.
doi: 10.1186/s40035-021-00257-y.

Neurofilament light and heterogeneity of disease progression in amyotrophic lateral sclerosis: development and validation of a prediction model to improve interventional trials

Affiliations
Clinical Trial

Neurofilament light and heterogeneity of disease progression in amyotrophic lateral sclerosis: development and validation of a prediction model to improve interventional trials

Simon Witzel et al. Transl Neurodegener. .

Abstract

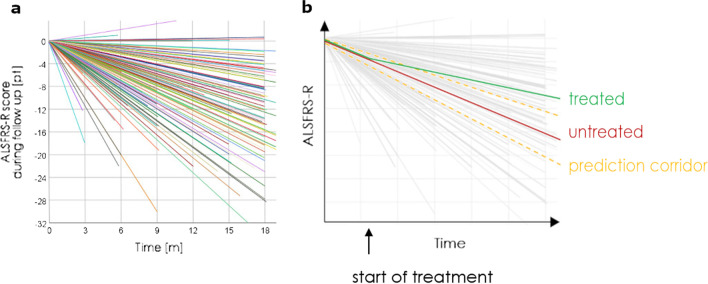
Background: Interventional trials in amyotrophic lateral sclerosis (ALS) suffer from the heterogeneity of the disease as it considerably reduces statistical power. We asked if blood neurofilament light chains (NfL) could be used to anticipate disease progression and increase trial power.

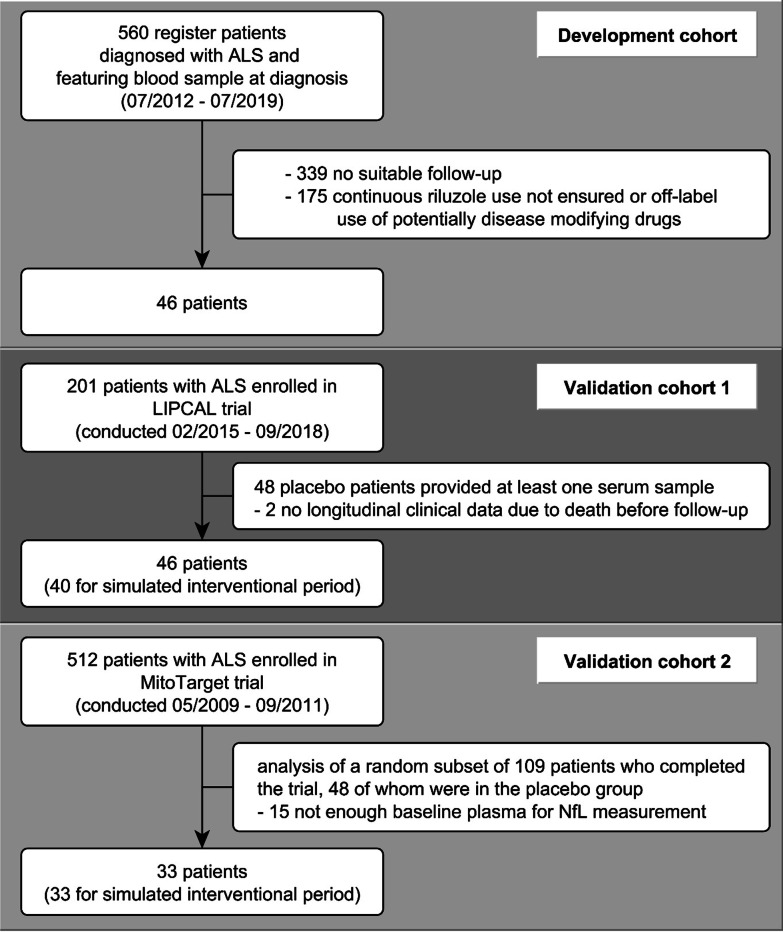
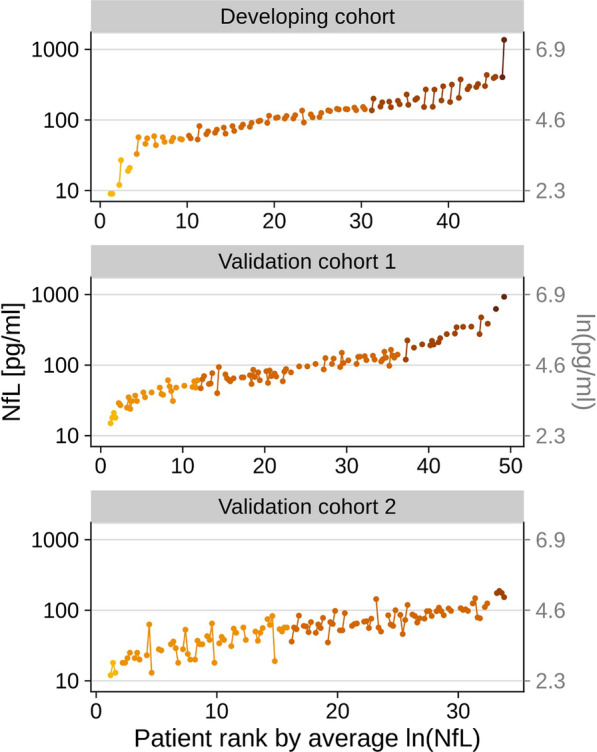
Methods: In 125 patients with ALS from three independent prospective studies-one observational study and two interventional trials-we developed and externally validated a multivariate linear model for predicting disease progression, measured by the monthly decrease of the ALS Functional Rating Scale Revised (ALSFRS-R) score. We trained the prediction model in the observational study and tested the predictive value of the following parameters assessed at diagnosis: NfL levels, sex, age, site of onset, body mass index, disease duration, ALSFRS-R score, and monthly ALSFRS-R score decrease since disease onset. We then applied the resulting model in the other two study cohorts to assess the actual utility for interventional trials. We analyzed the impact on trial power in mixed-effects models and compared the performance of the NfL model with two currently used predictive approaches, which anticipate disease progression using the ALSFRS-R decrease during a three-month observational period (lead-in) or since disease onset (ΔFRS).

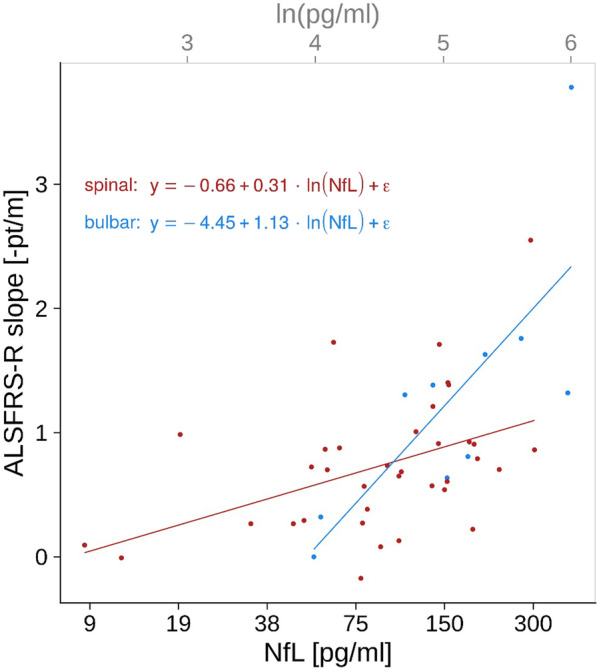
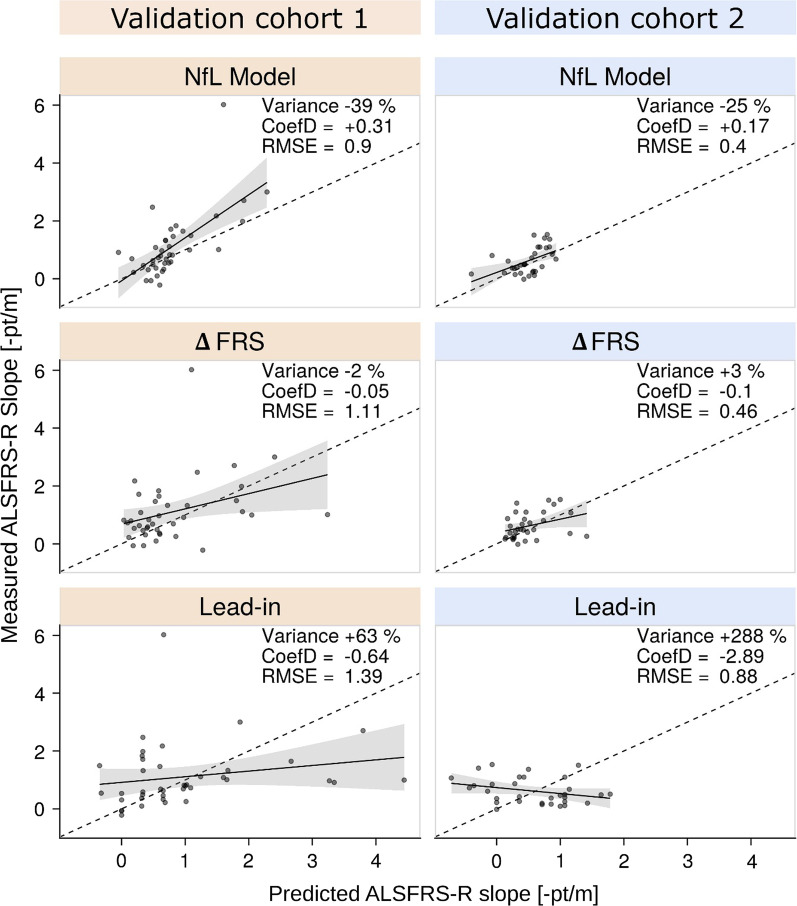
Results: Among the parameters provided, the NfL levels (P < 0.001) and the interaction with site of onset (P < 0.01) contributed significantly to the prediction, forming a robust NfL prediction model (R = 0.67). Model application in the trial cohorts confirmed its applicability and revealed superiority over lead-in and ΔFRS-based approaches. The NfL model improved statistical power by 61% and 22% (95% confidence intervals: 54%-66%, 7%-29%).

Conclusion: The use of the NfL-based prediction model to compensate for clinical heterogeneity in ALS could significantly increase the trial power. NCT00868166, registered March 23, 2009; NCT02306590, registered December 2, 2014.

Keywords: Amyotrophic lateral sclerosis; Disease progression; Interventional trials; Neurofilament light; Prediction model; Statistical power.


Conflict of interest statement

The authors declare that they have no competing interests.

Figures

Fig. 1
Fig. 1
Heterogeneity of disease progression rates and possible application of a prediction model. a The heterogeneity of disease progression rates in ALS, as shown by ALSFRS-R slopes of each study participant in the three cohorts of this study during the follow-up time. b The application of a prediction model in one patient receiving an efficient treatment. Note that without the use of a prediction model, the treatment effect (difference between the red and green lines) can hardly be differentiated from natural heterogeneity. Eventually, the use of the prediction model (yellow lines) reveals a significant slowdown of disease progression
Fig. 2
Fig. 2
Flowchart of participant inclusion from three cohorts
Fig. 3
Fig. 3
Scatter plot of disease progression rates (defined as ALSFRS-R slopes) and NfL blood levels at diagnosis. The NfL model formulas and corresponding regression lines derived from the multivariate regression in the development cohort are shown separately for patients with spinal (red) and bulbar onset (blue), to visualize the correlation between ALSFRS-R slopes and ln(NfL) levels and the interaction between ln(NfL) levels and site of onset
Fig. 4
Fig. 4
Temporal fluctuations of NfL blood levels in each patient. ln(NfL) measurements from each individual patient are connected by lines, and patients are colored based on the order of magnitude of their average ln(NfL) values. The time points of a given patient are ordered by time from left to right and equally spaced
Fig. 5
Fig. 5
NfL Model Transferability. The absolute deviations of the predicted ALSFRS-R slope using the NfL model from the observed ALSFRS-R slope are plotted against the predicted value (a) and the time between disease onset and NfL measurement (b). The NfL model predictions use coefficients from the developing cohort, as shown in Fig. 3. Triangular arrowheads indicate points outside the coordinate system, and points inside the green box represent predictions within 0.5 pt/m from the measured value. Colored lines in panel b show local regression
Fig. 6
Fig. 6
Predictive performance of the NfL model in comparison to the ΔFRS and the lead-in approaches. The scatter plots show predicted versus measured ALSFRS-R slopes for the interventional period of a simulated clinical trial in the validation cohorts V1 (n = 40) and V2 (n = 33). Trend lines with grey areas (standard error) visualize systematic deviation from the perfect prediction (dashed lines). For each method and cohort, the change of variance, and RMSE and CoefD values are provided in the upper right corner. Note that the RMSE represents absolute values and can only be compared with one another within the same data set; the smaller the RMSE, the more precise the prediction. CoefD can range from − ∞ to 1, with the value of 1 meaning perfect prediction, positive values indicating the model adds predictive information, while negative values indicating the opposite. A decrease in variance indicates an increase in statistical power in a clinical trial

References

    1. Paganoni S, Cudkowicz M, Berry JD. Outcome measures in amyotrophic lateral sclerosis clinical trials. Clin Investig (Lond) 2014;4(7):605–618. doi: 10.4155/cli.14.52. - DOI - PMC - PubMed
    1. Wobst HJ, Mack KL, Brown DG, Brandon NJ, Shorter J. The clinical trial landscape in amyotrophic lateral sclerosis—past, present, and future. Med Res Rev. 2020;40(4):1352–1384. doi: 10.1002/med.21661. - DOI - PMC - PubMed
    1. Cedarbaum JM, Stambler N, Malta E, Fuller C, Hilt D, Thurmond B, et al. The ALSFRS-R: a revised ALS functional rating scale that incorporates assessments of respiratory function. J Neurol Sci. 1999;169(1):13–21. doi: 10.1016/S0022-510X(99)00210-5. - DOI - PubMed
    1. Kimura F, Fujimura C, Ishida S, Nakajima H, Furutama D, Uehara H, et al. Progression rate of ALSFRS-R at time of diagnosis predicts survival time in ALS. Neurology. 2006;66(2):265–267. doi: 10.1212/01.wnl.0000194316.91908.8a. - DOI - PubMed
    1. Watanabe H, Atsuta N, Nakamura R, Hirakawa A, Watanabe H, Ito M, et al. Factors affecting longitudinal functional decline and survival in amyotrophic lateral sclerosis patients. Amyotroph Lateral Scler Frontotemporal Degener. 2015;16(3–4):230–236. doi: 10.3109/21678421.2014.990036. - DOI - PubMed

Associated data