. 2021 Aug 25;7(35):eabg1601.
doi: 10.1126/sciadv.abg1601. Print 2021 Aug.

Microglial dyshomeostasis drives perineuronal net and synaptic loss in a CSF1R+/- mouse model of ALSP, which can be rescued via CSF1R inhibitors

Affiliations

Microglial dyshomeostasis drives perineuronal net and synaptic loss in a CSF1R+/- mouse model of ALSP, which can be rescued via CSF1R inhibitors

Miguel A Arreola et al. Sci Adv. .

Abstract

Adult-onset leukoencephalopathy with axonal spheroids and pigmented glia is an autosomal dominant neurodegenerative disease caused by mutations in colony-stimulating factor 1 receptor (CSF1R). We sought to identify the role of microglial CSF1R haploinsufficiency in mediating pathogenesis. Using an inducible Cx3cr1 CreERT2/+-Csf1r +/fl system, we found that postdevelopmental, microglia-specific Csf1r haploinsufficiency resulted in reduced expression of homeostatic microglial markers. This was associated with loss of presynaptic surrogates and the extracellular matrix (ECM) structure perineuronal nets. Similar phenotypes were observed in constitutive global Csf1r haploinsufficient mice and could be reversed/prevented by microglia elimination in adulthood. As microglial elimination is unlikely to be clinically feasible for extended durations, we treated adult CSF1R+/- mice at different disease stages with a microglia-modulating dose of the CSF1R inhibitor PLX5622, which prevented microglial dyshomeostasis along with synaptic- and ECM-related deficits. These data highlight microglial dyshomeostasis as a driver of pathogenesis and show that CSF1R inhibition can mitigate these phenotypes.


Figures

Fig. 1
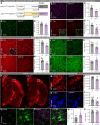
Fig. 1. Myeloid-specific CSF1R+/− (iCSF1R) in adult mice confirms loss in homeostasis, reductions in synaptic surrogates, and alterations in ECM structures.
(A) Experimental paradigm whereby tamoxifen was introduced via oral gavage to cx3cr1cre-CSF1R+/fl and cx3cr1cre-CSF1R+/+ mice at 2 months, well after microglial development. Mice were sacrificed at 8 months. (B and C) Representative image of 20× in situ hybridization of CSF1R RNA reveals a 40 to 50% reduction in CSF1R expression throughout. (D and E) Representative 20× image of IBA1+ immunofluorescence in the SS Cortex revealed no significant changes to IBA1+ cell number. (F and G) Representative 20× image of SS Cortex revealed significant decrease in P2RY12 expression by microglia. Insets display Iba1 P2ry12 immunostaining. Myeloid-specific CSF1R knockout mice presented with losses of presynaptic puncta (H and I) Synaptophysin, (J and K) SV2A, and (L and M) Bassoon. (H′) Example Imaris quantification of Synaptophysin+ spots digitally zoomed in 5× from 63× image. (N and O) No differences found in PSD95 puncta number, however. (P) Whole-brain stitches of half brains of myeloid-specific CSF1R haploinsufficient mice immunostained for WFA. (Q and R) Representative 20× images of WFA and aggrecan immunostaining in SS Cortex, respectively. (S and T) Quantification confirmed significant decrease in WFA and aggrecan (Acan) area coverage found in global CSF1R+/− haploinsufficient mice. (U and V) Representative 20× confocal images of SS Cortex immunostained for CSPG and S100β+ (W) display a significant increase in CSPG accumulation as measured by integrated density (X) and no changes in S100β+ cells. Statistical analysis for inducible CSF1R+/− comparisons used a two-tailed t test. Significance is indicated as *P < 0.05; **P < 0.01; #0.05 < P < 0.1. FOV, field of view; WFA, W. floribunda agglutinin.
Fig. 2
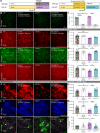
Fig. 2. Elimination of microglia with 1200 ppm of PLX5622 restored synaptic and ECM alterations induced by CSF1R haploinsufficiency.
(A) WT and CSF1R+/− mice were placed on a high-dose PLX5622 diet (1200 ppm) for 2 months beginning at 6 months to completely eliminate microglia from the brain parenchyma. (B) Immunofluorescent image of IBA1+ cells in the SS Cortex, (C) quantification of which showed significant decrease (~90 to 95% elimination) of microglia in WT and CSF1R+/−-treated mice. (D, F, and H) Representative 63× immunofluorescent images of presynaptic elements Synaptophysin, SV2A, and Bassoon, respectively. (E, G, and I) Quantification of these showed significant decreases in the number of puncta in CSF1R+/− SS Cortex and recovery of puncta number in CSF1R+/− mice in which microglia were completely eliminated, with the exception of Synaptophysin. (J to M) Immunostaining of WFA and aggrecan displayed decreased PNN area coverage in SS Cortex of CSF1R+/− mice. Elimination of microglia restored ECM composition in CSF1R+/− mice. (N and O) Immunostaining and quantification of CSPG revealed increased immunostaining of CS-56 in CSF1R+/− parenchyma that was restored by elimination of microglia. Statistical analysis used a two-way ANOVA with Sidak multiple comparisons correction. Significance is indicated as *P < 0.05; **P < 0.01; ***P < 0.001; #0.05 < P < 0.1.
Fig. 3
Fig. 3. CSF1R+/− mice display behavioral and morphological deviations from WT counterparts that are restored by CSF1Ri.
(A) WT and CSF1R+/− mice were treated with 150 ppm of PLX5622 for 2 months beginning at 6 months. Mice were sacrificed at 8 months (n = 8 to 10 per group). (B) Relative expression levels of CSF1R normalized to glyceraldehyde-3-phosphate dehydrogenase via quantitative PCR. Expression levels of CSF1R in CSF1R+/− were reduced ~50% compared to WT (P < 0.0001) using two-tailed t test. (C) CSF1R+/− mice spent significantly less time exploring the novel object compared to WT mice. CSF1Ri rescued performance comparable to WT counterparts. (D) CSF1R+/− mice spent significantly less time exploring objects moved to a novel place compared to WT mice. (E) Representative half-brain stitches; each white dot represents a microglial cell. Representative 63× image of SS Cortex IBA1 immunofluorescence. (F) Quantification of IBA1+ cells in cortex, hippocampus, and thalamus shows 25 to 30% increase in IBA1+ cells. CSF1Ri treatment reduced IBA1+ cells by 25% in both WT and CSF1R+/− mice. (G) Average soma size of IBA1+ cells reveals significantly increased soma size in CSF1Ri microglia. WT IBA1+ cells had comparable soma size to CSF1R+/− and CSF1Ri-CSF1R+/−. (H) No changes to average process diameter or (I) average total process length were found between groups; a trending increase in CSF1Ri microglia was found between WT and CSF1Ri. (J) Analysis of branch patterns revealed decreased number of primary and secondary branches in CSF1Ri microglia compared to WT. CSF1R+/− microglia had increased numbers of primary, secondary, and tertiary branching that were reduced to WT levels by CSF1Ri. (K and L) Representative 20× image of the SS Cortex reveals decreased P2RY12 immunopositivity in CSF1Ri and CSF1R+/− mice. CSF1Ri-CSF1R+/− mice revealed increased expression in P2RY12 expression. Insets display Iba1+ P2RY12+ immunostaining. Statistical analysis used a two-way ANOVA with Sidak multiple comparisons correction. Significance: *P < 0.05; **P < 0.01; ***P < 0.001; #0.05 < P < 0.1.
Fig. 4
Fig. 4. Increased microglial population is established during development; microglial-specific excision of one CSF1R reveals decreases in microglial molecular markers and dysfunction of a presynaptic marker.
(A) Representative 20× image of the SS Cortex immunostaining for Ki67 and IBA1+ cells revealed (B) no changes to proliferation in any group when compared to WT mice, suggesting that proliferation in the adult cannot account for increased number of IBA1+ cells found in 8-month-old CSF1R+/− mice. (C) Representative 20× image of SS Cortex immunostaining for TUNEL and IBA1 revealed that (D) CSF1Ri induced an increase in TUNEL IBA1 double-positive cells. (C1 to C4) Arrowheads indicate the presence of TUNEL+/IBA1+ cells. (E) Representative 20× images of the SS Cortex of WT and CSF1R+/− mice at P7, P14, and P26 arrows indicate the location of Ki67 IBA1 double positive cells. Immunostaining for IBA1 and Ki67 showed (F) no changes in microglial number between WT and CSF1R+/− mice at P7 or P14 but a significant increase in CSF1R+/− at P26 and P60. (G) No changes in Ki67 IBA1 double-positive cells were found throughout the time course. Statistical analysis used a two-way ANOVA with Sidak multiple comparisons correction or two-tailed t test for developmental study. Significance is indicated as *P < 0.05; **P < 0.01; #0.05 < P < 0.1.
Fig. 5
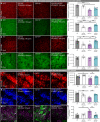
Fig. 5. Microglial dyshomeostasis results in deficits in presynaptic elements, PNN loss, and CSPG accumulation in CSF1R+/− SS Cortex that are restored by CSF1Ri.
(A and B) Representative 63× images of SS Cortex reveal decreases in Synaptophysin puncta in CSF1R+/− and CSF1Ri-CSF1R+/− mice (C and D), decreases in SV2A in CSF1Ri and CSF1R+/− mice and recovery in CSF1Ri-CSF1R+/− mice (E and F), decreases in Bassoon in CSF1Ri and CSF1R+/− mice and recovery in CSF1Ri-CSF1R+/− mice (G and H), and no changes to PSD95 puncta. (I) Representative 20× images of SS Cortex from WT, CSF1Ri, CSF1R+/−, and CSF1Ri-CSF1R+/− mice immunostained for WFA. (J) Quantification of WFA area coverage revealed a significant decrease in WFA coverage in CSF1R+/− SS Cortex and a trending recovery in the CSF1Ri-CSF1R+/− group. (K) Representative 20× confocal images of aggrecan immunostaining, another component ECM PNN quantification of which (L) revealed similar significant decreases in area coverage in the CSF1R+/− group and significant recovery in CSF1Ri-CSF1R+/− group. (M) Immunofluorescence of CSPG in the SS Cortex and quantification by integrated density (N) revealed accumulation of CSPG deposits in CSF1R+/− groups that was restored upon CSF1Ri. Statistical analysis used a two-way ANOVA with Sidak multiple comparisons correction. Significance is indicated as *P < 0.05; **P < 0.01; ***P < 0.001; ****P < 0.0001; #0.05 < P < 0.1.
Fig. 6
Fig. 6. Advanced-stage CSF1R+/− displays losses in homeostatic P2RY12 expression, MBP, and ECM immunostaining.
(A) Experimental paradigm: WT and CSF1R+/− mice were treated with 150 ppm of PLX5622 for 2 months beginning at 14 months. Mice were sacrificed at 16 months (n = 9 to 10 per group). (B) CSF1R+/− mice trended toward exploring the novel object with less time compared to WT mice. (C) CSF1R+/− mice spent significantly less time exploring an object moved to a novel place compared to WT mice. (D and E) Representative 20× images of the SS Cortex show no differences in number of Iba1+ cells between aged WT and CSF1R+/− mice. CSF1Ri reduced Iba1+ cells. (F and G) Representative 20× image of the SS Cortex reveals a marked decrease in microglial P2RY12 immunopositivity in CSF1Ri and CSF1R+/− mice. CSF1Ri of CSF1R+/− mice revealed a trending increased expression in P2RY12 expression. (H and I) Representative 20× images of the cc reveal marked microgliosis in CSF1R+/− mice that is corrected with CSF1Ri treatment. (J and K) Representative 20× images of the cc and SS Cortex (insets) reveal marked decrease in MBP immunostaining in CSF1R+/− mice. (L and M) Representative 20× images of the cc reveal increased immunostaining of Nf-L in CSF1R+/− mice and resolution in CSF1R-CSF1R+/− mice. (N to P) Representative 20× images of WFA and aggrecan immunostaining reveal marked decrease in staining for both in CSF1Ri and CSF1R+/− mice. CSF1Ri-CSF1R+/− mice had trending increases for both. Statistical analysis used a two-way ANOVA with Sidak multiple comparisons correction. Significance: *P < 0.05; **P < 0.01; ***P < 0.001; ****P < 0.0001; #0.05 < P < 0.1.
Fig. 7
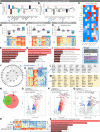
Fig. 7. CSF1R signaling disruptions induce loss of microglial homeostasis but primarily affect neuronal gene expression.
(A) Correlation of coexpression modules to genotype (z score cutoff, ±0.5). (B) Correlation of modules to treatment (z score cutoff, ±0.5). (C) Cell type enrichment heatmap of coexpression modules. Values provided indicate the number of genes within network associated with that specific cell type. ***6+ genes; **3+ genes. (D and E) CSF1R+/− signature: Module eigengene trajectory and heatmap of gene expression value (D) and gene ontology (GO) term enrichment for brown module (E). (F and G) CSF1Ri signature: Module eigengene trajectory and heatmap of gene expression value (F) and GO term enrichment for the darkgrey module (G). (H and I) CSF1Ri and CSF1R+/− signature: Module eigengene trajectory and heatmap of gene expression value (H), as well as GO term enrichment for midnightblue module (I). Curated GO grids ranked on the basis of pathway P value where cutoff was 0.05. Colors are associated with an adjusted P value cutoff of 0.1 wherein pathways with lighter color have lower adjusted P value. (J) Interaction plot showing hub genes from the darkgrey module shows distinct CSF1Ri signature. (K) Heatmap of genes in the darkgrey module normalized to average microglial numbers found within a group. (L) List of up-regulated genes in CSF1Ri-CSF1R+/− compared to CSF1R+/− mice. (M) List of down-regulated genes between WT and CSF1R+/− mice normalized for number of microglia. (N) Venn diagram displaying the number of DEGs generated in transcriptional comparisons between CSF1Ri mice and CSF1R+/− mice in comparison with WT mice. (O to Q) Volcano plots displaying fold change of genes (log2 scale) and P values (−log10 scale) between WT and CSF1Ri mice (O), WT and CSF1R+/− mice (P), and CSF1R+/− and CSF1Ri-CSF1R+/− (Q). (R) Heatmap of DEGs between CSF1R+/− and CSF1Ri-CSF1R+/− mice. (S) Top biological GO term enrichment for up-regulated genes from heatmap (R). FDR, false discovery rate.

References

    1. Kondo Y., Matsushima A., Nagasaki S., Nakamura K., Sekijima Y., Yoshida K., Factors predictive of the presence of a CSF1R mutation in patients with leukoencephalopathy. Eur. J. Neurol. 27, 369–375 (2020). - PMC - PubMed
    1. Konno T., Miura T., Harriott A. M., Mezaki N., Edwards E. S., Rademakers R., Ross O. A., Meschia J. F., Ikeuchi T., Wszolek Z. K., Partial loss of function of colony-stimulating factor 1 receptor in a patient with white matter abnormalities. Eur. J. Neurol. 25, 875–881 (2018). - PMC - PubMed
    1. Oyanagi K., Kinoshita M., Suzuki-Kouyama E., Inoue T., Nakahara A., Tokiwai M., Arai N., Satoh J. I., Aoki N., Jinnai K., Yazawa I., Arai K., Ishihara K., Kawamura M., Ishizawa K., Hasegawa K., Yagisita S., Amano N., Yoshida K., Terada S., Yoshida M., Akiyama H., Mitsuyama Y., Ikeda S. I., Adult onset leukoencephalopathy with axonal spheroids and pigmented glia (ALSP) and Nasu-Hakola disease: Lesion staging and dynamic changes of axons and microglial subsets. Brain Pathol. 27, 748–769 (2017). - PMC - PubMed
    1. C. Sundal, Z. K. Wszolek, CSF1R-related adult-onset leukoencephalopathy with axonal spheroids and pigmented glia, in GeneReviews®, M. P. Adam, H. H. Ardinger, R. A. Pagon, S. E. Wallace, L. J. H. Bean, G. Mirzaa, A. Amemiya, Eds. (University of Washington, 1993). - PubMed
    1. Hiyoshi M., Hashimoto M., Yukihara M., Bhuyan F., Suzu S., M-CSF receptor mutations in hereditary diffuse leukoencephalopathy with spheroids impair not only kinase activity but also surface expression. Biochem. Biophys. Res. Commun. 440, 589–593 (2013). - PubMed