. 2021 Aug 31;118(35):e2026583118.
doi: 10.1073/pnas.2026583118.

Lipid-based and protein-based interactions synergize transmembrane signaling stimulated by antigen clustering of IgE receptors

Affiliations

Lipid-based and protein-based interactions synergize transmembrane signaling stimulated by antigen clustering of IgE receptors

Nirmalya Bag et al. Proc Natl Acad Sci U S A. .

Abstract

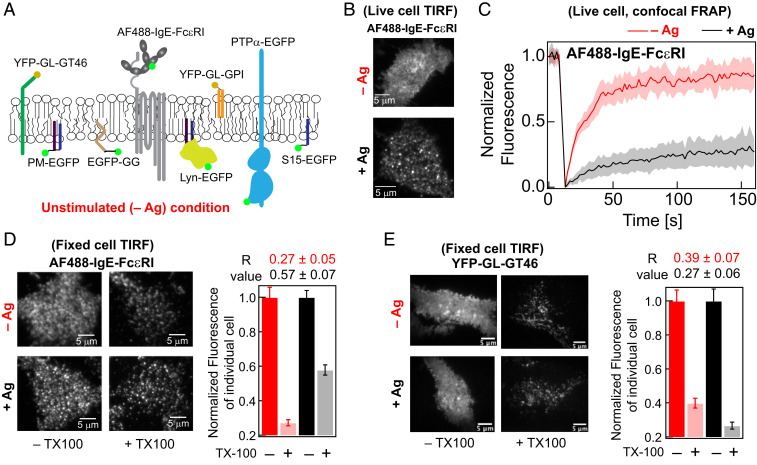
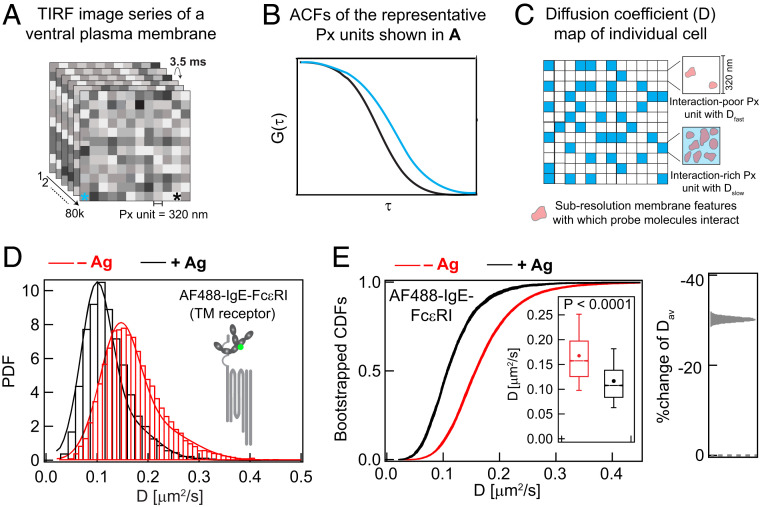
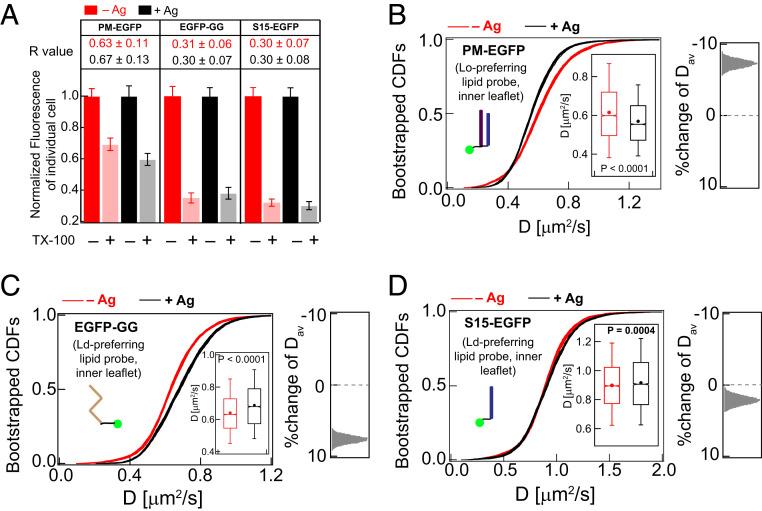
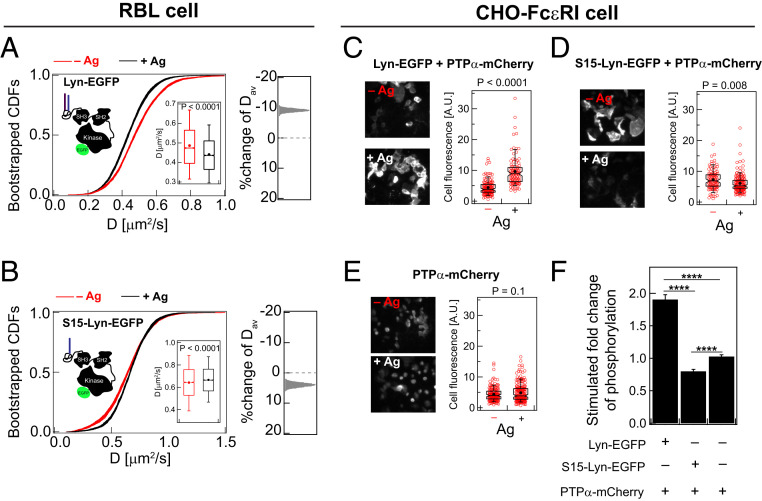
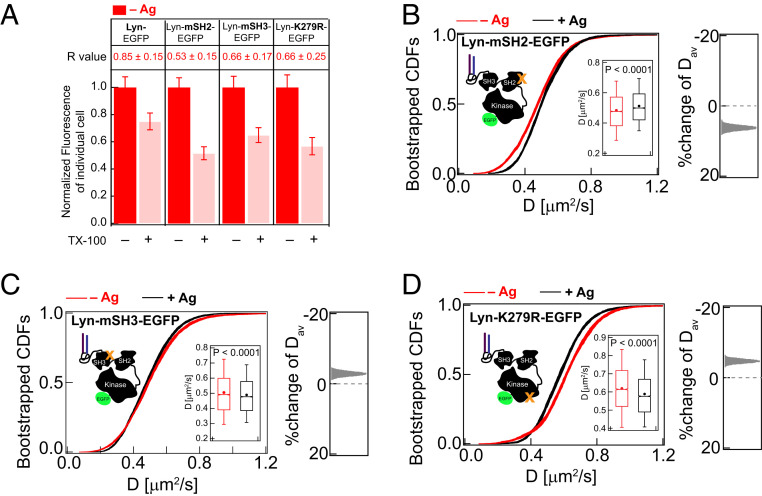
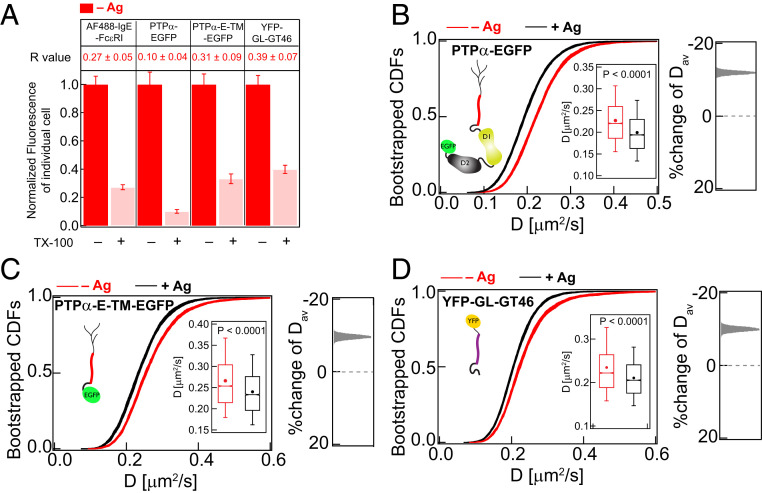
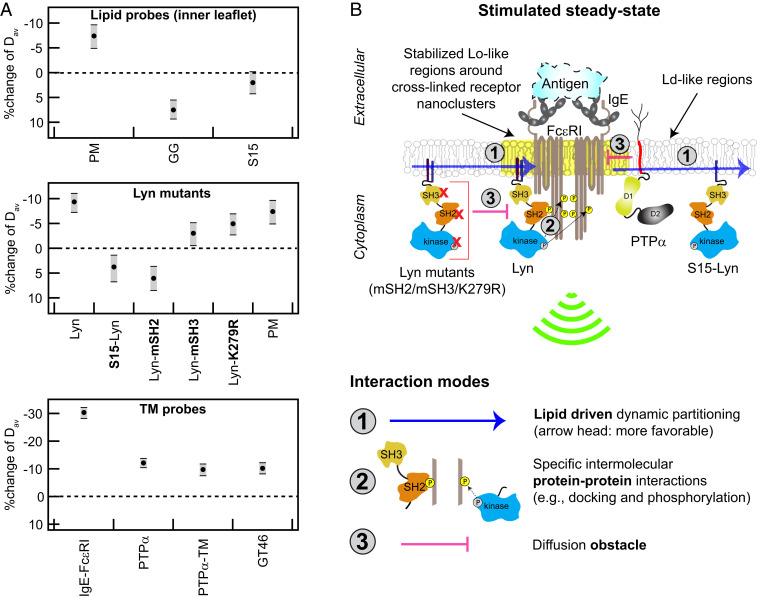
Antigen (Ag) crosslinking of immunoglobulin E-receptor (IgE-FcεRI) complexes in mast cells stimulates transmembrane (TM) signaling, requiring phosphorylation of the clustered FcεRI by lipid-anchored Lyn tyrosine kinase. Previous studies showed that this stimulated coupling between Lyn and FcεRI occurs in liquid ordered (Lo)-like nanodomains of the plasma membrane and that Lyn binds directly to cytosolic segments of FcεRI that it initially phosphorylates for amplified activity. Net phosphorylation above a nonfunctional threshold is achieved in the stimulated state but not in the resting state, and current evidence supports the hypothesis that this relies on Ag crosslinking to disrupt a balance between Lyn and tyrosine phosphatase activities. However, the structural interactions that underlie the stimulation process remain poorly defined. This study evaluates the relative contributions and functional importance of different types of interactions leading to suprathreshold phosphorylation of Ag-crosslinked IgE-FcεRI in live rat basophilic leukemia mast cells. Our high-precision diffusion measurements by imaging fluorescence correlation spectroscopy on multiple structural variants of Lyn and other lipid-anchored probes confirm subtle, stimulated stabilization of the Lo-like nanodomains in the membrane inner leaflet and concomitant sharpening of segregation from liquid disordered (Ld)-like regions. With other structural variants, we determine that lipid-based interactions are essential for access by Lyn, leading to phosphorylation of and protein-based binding to clustered FcεRI. By contrast, TM tyrosine phosphatase, PTPα, is excluded from these regions due to its Ld-preference and steric exclusion of TM segments. Overall, we establish a synergy of lipid-based, protein-based, and steric interactions underlying functional TM signaling in mast cells.

Keywords: FcεRI; Imaging FCS; plasma membrane domains; rafts; transmembrane signaling.


Conflict of interest statement

The authors declare no competing interest.

Figures

Fig. 1.
Fig. 1.
AF488-IgE-FcεRI is clustered, partially immobilized, and exhibits elevated detergent resistance after crosslinking by soluble Ag (DNP-BSA) in RBL cells. (A) Plasma membrane localization in resting cells (−Ag) of AF488-IgE-FcεRI and other probes evaluated in this study. (B) Representative TIRF images of AF488-IgE-FcεRI on the ventral plasma membrane in live cells before (−Ag) and after (+Ag) stimulation by Ag. (C) Normalized FRAP curves of AF488-IgE-FcεRI obtained from individual cells are overlaid in −Ag (pink) and +Ag (gray) conditions. The solid red and black curves are average of the pink and gray curves, respectively. SI Appendix, Fig. S1A shows representative fitted FRAP data and box plots of recovery time and mobile fraction of all cells evaluated. (D) Representative fixed-cell TIRF images of AF488-IgE-FcεRI without (−TX100) and with (+0.04% TX100) treatment of both −Ag and +Ag conditions. Fluorescence retained after +TX100 treatment is normalized against corresponding −TX100 sample. The R values, corresponding to level of detergent resistance, are calculated from the ratio of median fluorescence of multiple cells in +TX100 to −TX100 samples (SI Appendix, Eq. S2). The error of R values was determined by bootstrapping as described in SI Appendix. (E) Representative fixed cell TIRF images under −/+Ag and −/+TX100 conditions and R values for YFP-GL-GT46. For each condition, 60 to 90 cells were imaged from at least two independent sample preparations for both AF488-IgE-FcεRI and YFP-GL-GT46. Box plots of fluorescence values for individual cells under −/+Ag and −/+TX100 conditions for both probes in representative experiments are provided in SI Appendix, Fig. S2.
Fig. 2.
Fig. 2.
Large datasets of ImFCS precisely characterize spatially heterogeneous diffusion of plasma membrane probes in both unstimulated (−Ag) and stimulated (+Ag) cells. (A and B) In a typical ImFCS recording, 80,000 TIRF microscopy images of fluorescently labeled ventral plasma membrane are collected at 3.5 ms/frame. The autocorrelation function (ACF) from a given Px unit (320 nm × 320 nm) decays faster if probes diffuse faster within that Px unit. The ACFs, corresponding to the Px units designated with asterisks of same color, illustrate probes diffusing slower (cyan) and faster (black). (C) Schematic diffusion coefficient (D) map, obtained after ACF analyses of all Px units contains some Px units with relatively slower (Dslow, cyan) or faster (Dfast, white) diffusion coefficient, interpreted as interaction-rich and interaction-poor units, respectively. (D) Histograms of experimental D values (>10,000; SI Appendix, Table S1) and PDF for AF488-IgE-FcεRI at −Ag (red) and +Ag (black) steady states. PDFs are fitted using parameters derived from bin-independent CDFs (SI Appendix, Eq. A2). (E) CDFs of the same D values as in part (D). Pooled D values are resampled 30 times by bootstrapping with 50% of all data each time, and individual bootstrapped CDFs are fitted for Dslow, Dfast, and Fslow (SI Appendix, Table S1). Individual raw bootstrapped CDFs of D values of AF488-IgE-FcεRI at each condition are overlaid and shown (red: −Ag and black: +Ag). (Inset) Box plots of all D values. Box height corresponds to 25th to 75th percentile; error bars represent 9th to 91st percentile of entire dataset; mean and median values are represented as solid circle and bar, respectively; notches signify 95% CI of the median. Right shows the stimulated %change of Dav: Effect change distribution is calculated from the bootstrapped mean values at each condition.
Fig. 3.
Fig. 3.
ImFCS but not DRM detects subtle stabilization of Lo-like regions in Ag-stimulated RBL cells. (A) Degree of detergent resistance for PM-EGFP, EGFP-GG, and S15-EGFP and R values for −Ag (red) and +Ag (black) conditions. Box plots of fluorescence values of individual cells for −/+TX100 and −/+Ag conditions for these probes are provided in SI Appendix, Fig. S3. (B–D) A total of 30 bootstrapped CDFs of D values from ImFCS measurements are overlaid for specified probes and conditions (−/+Ag). Box plots of all D values and distribution of stimulated %change of Dav as described for Fig. 2E. SI Appendix, Table S1 shows number of autocorrelation function and cells measured for ImFCS analyses.
Fig. 4.
Fig. 4.
Lipid-driven Lo-preference of Lyn is necessary for its functional coupling with Ag-crosslinked IgE-FcεRI. A total of 30 bootstrapped CDFs of D values from ImFCS measurements in RBL cells are overlaid for WT Lyn-EGFP (A) and the Ld-preferring Lyn chimera S15-Lyn-EGFP (B) in −/+Ag conditions. Box plots of all D values and stimulated %change of Dav are shown as described for Fig. 2E. SI Appendix, Table S1 shows number of autocorrelation function and cells measured for ImFCS analyses. (C–E) Representative images of immunostained phosphorylation for CHO cells stably transfected with FcεRI and transiently transfected with specified Lyn variant and PTPα. Red circles are fluorescence of individual cells for a representative biological replica, and the box plots are defined as described in Fig. 2E. (F) Quantification of stimulated changes of phosphorylation for each condition. ****: P < 10−4 (unpaired Student’s t test).
Fig. 5.
Fig. 5.
Cytosolic protein modules of Lyn-EGFP contribute to detergent-resistance and reduction of diffusion caused by Ag-crosslinking of IgE-FcεRI. (A) Detergent resistance of Lyn-EGFP compared to variants Lyn-mSH2-EGFP, Lyn-mSH3-EGFP, and Lyn-K279R-EGFP as represented by relative loss of fluorescence after TX100 treatment and corresponding R values in unstimulated (−Ag) RBL cells. Box plots of fluorescence values of individual cells for −/+TX100 and −/+Ag conditions for these probes are provided in SI Appendix, Figs. S6B (Lyn-EGFP) and S7A (Lyn-EGFP variants). (B–D) 30 bootstrapped CDFs of D values from ImFCS measurements are overlaid for specified probes and conditions (−/+Ag). Box plots of all D values and stimulated %change of Dav are shown as described for Fig. 2E. SI Appendix, Table S1 shows number of autocorrelation function and cells measured for ImFCS analyses.
Fig. 6.
Fig. 6.
TM probes are strongly detergent soluble but show relatively slower diffusion in stimulated cells. (A) Detergent resistance of AF488-IgE-FcεRI, PTPα-EGFP, PTPα-E-TM-EGFP, and YFP-GL-GT46 as represented by relative loss of fluorescence after TX100 treatment and corresponding R values in unstimulated (−Ag) RBL cells. Box plots of fluorescence values of individual cells for −/+TX100 and −/+Ag conditions for these probes are provided in SI Appendix, Figs. S2 (AF488-IgE-FcεRI and YFP-GL-GT46) and S8A (PTPα-EGFP and PTPα-E-TM-EGFP). (B–D) A total of 30 bootstrapped CDFs of D values from ImFCS measurements are overlaid for specified probes and conditions (−/+Ag). Box plots of all D values and stimulated %change of Dav are shown as described for Fig. 2E. SI Appendix, Table S1 shows number of autocorrelation function and cells measured for ImFCS analyses.
Fig. 7.
Fig. 7.
Ag-crosslinking of IgE-FcεRI stabilizes surrounding Lo-like nanodomains, causing dynamic lipid- and protein-based interactions that shift diffusion properties of signaling components and lead to suprathreshold phosphorylation by Lyn. (A) Stimulated changes in Dav for inner leaflet lipid probes, Lyn variants, and TM probes, including IgE-FcεRI and PTPα. Values and error bars represent effect change distributions shown in Figs. 2–6. (B) Proposed interaction modes leading to functional coupling of Lyn with clustered FcεRI: Stabilized Lo-like environment preferentially includes Lo-preferring Lyn and excludes Ld-preferring S15-Lyn and PTPα (interaction mode 1). Preferentially proximal Lyn (interaction mode 1) phosphorylates clustered FcεRI via its kinase module and then binds to pTyr via its SH2 module as facilitated by its SH3 module (interaction mode 2); these cumulative interactions stabilize the coupling. Lyn variants with impaired kinase, SH2, or SH3 modules are sterically hindered by cytoplasmic segments of clustered FcεRI (interaction mode 3). PTPα, which is preferentially excluded from Lo-like environments (interaction mode 1), is further limited in access to FcεRI-pTyr due to steric hindrance by clustered FcεRITMDs (interaction mode 3).

References

    1. Sigalov A., Multi-chain immune recognition receptors: Spatial organization and signal transduction. Semin. Immunol. 17, 51–64 (2005). - PubMed
    1. Su X., et al. ., Phase separation of signaling molecules promotes T cell receptor signal transduction. Science 352, 595–599 (2016). - PMC - PubMed
    1. Douglass A. D., Vale R. D., Single-molecule microscopy reveals plasma membrane microdomains created by protein-protein networks that exclude or trap signaling molecules in T cells. Cell 121, 937–950 (2005). - PMC - PubMed
    1. Andrews N. L., et al. ., Actin restricts FcepsilonRI diffusion and facilitates antigen-induced receptor immobilization. Nat. Cell Biol. 10, 955–963 (2008). - PMC - PubMed
    1. Holowka D., Baird B., Roles for lipid heterogeneity in immunoreceptor signaling. Biochim. Biophys. Acta 1861 (8 Pt B), 830–836 (2016). - PMC - PubMed

Publication types