. 2021 Sep 14;118(37):e2111315118.
doi: 10.1073/pnas.2111315118.

Profound Treg perturbations correlate with COVID-19 severity

Collaborators, Affiliations

Profound Treg perturbations correlate with COVID-19 severity

Silvia Galván-Peña et al. Proc Natl Acad Sci U S A. .

Abstract

The hallmark of severe COVID-19 is an uncontrolled inflammatory response, resulting from poorly understood immunological dysfunction. We hypothesized that perturbations in FoxP3+ T regulatory cells (Treg), key enforcers of immune homeostasis, contribute to COVID-19 pathology. Cytometric and transcriptomic profiling revealed a distinct Treg phenotype in severe COVID-19 patients, with an increase in Treg proportions and intracellular levels of the lineage-defining transcription factor FoxP3, correlating with poor outcomes. These Tregs showed a distinct transcriptional signature, with overexpression of several suppressive effectors, but also proinflammatory molecules like interleukin (IL)-32, and a striking similarity to tumor-infiltrating Tregs that suppress antitumor responses. Most marked during acute severe disease, these traits persisted somewhat in convalescent patients. A screen for candidate agents revealed that IL-6 and IL-18 may individually contribute different facets of these COVID-19-linked perturbations. These results suggest that Tregs may play nefarious roles in COVID-19, by suppressing antiviral T cell responses during the severe phase of the disease, and by a direct proinflammatory role.

Keywords: COVID-19; FoxP3; Tregs; tumor Tregs.


Conflict of interest statement

The authors declare no competing interest.

Figures

Fig. 1.
Fig. 1.
Treg overrepresentation and FoxP3 induction in COVID-19 patients. (A) Experimental approach. Tregs from PBMCs across mild, severe, and recovered COVID-19 patients, compared to HD, were assessed by flow cytometry, as well as by RNA-seq. (B) Representative flow cytometry plots of CD25+FoxP3+ Tregs from COVID-19 patients’ PBMCs. (C) Proportions (Left) and proportions vs. absolute numbers (Right) of Tregs as measured by flow cytometry across donors; H, HD; M, mild; R, recovered; S, severe. P values from random permutation test quantitating number of outlier values relative to distribution in HDs. (D) FoxP3 expression, measured as MFI in CD127loCD25+ Tregs. Representative flow cytometry profiles (Left) and quantification (Right); Mann–Whitney P values. (E) Correlation between FoxP3 expression and days post disease symptoms onset across COVID-19 patients; Pearson correlation test (F) Proportion of KLRG1+ (Upper) and PD1+ (Lower) Tregs as determined by flow cytometry across COVID-19 patients; significance computed as for C. (G) Proportion of Tbet+ Tregs as determined by flow cytometry across COVID-19 patients; significance computed as for C. (H) Correlation between percentage of CD25+FoxP3+ Tregs (x axis), percentage of Tbet+ Tregs (y axis), and FoxP3 expression as MFI (color gradient) within severe COVID-19 patients. Healthy controls depicted in black dots and patients with fatal outcome by an “x”; those with an unavailable normalized FoxP3 MFI measurement are depicted as gray dots.
Fig. 2.
Fig. 2.
A “super-Treg” identity in Tregs from severe COVID-19 patients. Tregs from COVID-19 patients and HD were magnetically purified for population RNA-seq. (A) Fold-change vs. P value (volcano) plot of gene expression in Tregs from severe COVID-19 patients compared to HD. Genes from Treg-Up signature (red) and Treg-Down signature (blue) are highlighted (54); P values from Fisher’s exact. (B) Treg-Up index was computed by averaged normalized expression of all signature genes in Tregs from COVID-19 patients and HD. Patients with fatal outcomes depicted as an “x”; P values from Mann–Whitney test. (C) Ranked expression of Treg-Up signature genes in Tregs from severe COVID-19 patients (red) and HD. The y axis corresponds to the expression in each donor Treg relative to the mean of HD Tregs. Genes are ranked by their average ratio in severe COVID-19 patients. Each dot is one gene in one donor Treg sample. (D) Fold-change vs. average expression plot from severe COVID-19 patient Tregs compared to HD. Up-regulated (red) and down-regulated (blue) Treg effector molecule transcripts highlighted. (E) Heatmap of the expression of transcripts typical of T follicular regulators (Tfr) and Tbet+ Treg in Tregs from each donor (as fold-change vs. mean expression in HD). One column per donor, with severity groups color-coded and percentage of FoxP3+CD25+ Tregs from the flow cytometry indicated.
Fig. 3.
Fig. 3.
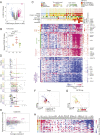
Broad perturbations of Treg transcriptomes in severe COVID-19. (A) Fold-change (FC) vs. P value plot of gene expression in Tregs from severe COVID-19 patients compared to HD. Differentially expressed genes are highlighted (at an arbitrary threshold of P < 0.05, FC > 2, or < 0.5). (B) Severe COVID-19 index (computed from relative expression of selected genes from A) in Tregs from COVID-19 patients and HD; P values from Mann–Whitney test. (C) Clustered heatmap of differentially expressed genes (selected as P < 0.05, FC > 2 or < 0.5) across all donors (as ratio to mean of HD values). Each column represents one donor. Top ribbons indicate for each individual: severity group, days from symptom onset to sample collection, age, CRP level at sampling, tumor infiltrating Treg index, ICU admission, and final outcome (deceased in red). Left ribbon indicates the coregulated modules and their dominant composition; right ribbons denote transcripts related to cell cycle, interferon responsive genes, Treg signature genes, and Pearson correlation of each gene’s expression to FOXP3 MFI across all samples. (D) Representation of the average expression of each module across each group (from C, mean and SEM). Score computed independently for each module, where 0 corresponds to the average expression of the module in HD Tregs and 1 the average expression in severe COVID-19 Tregs (red line). (E) Changes in expression of cytokine-encoding transcripts (on a fold-change vs. average expression plot, severe COVID-19 vs. HD Tregs). (F) Treg cells extracted from single-cell RNA-seq dataset (GSE150728) displayed as a two-dimensional UMAP. The samples are color-coded by group. (G) Same plot as F, where each cell is color-coded according to expression of the SCTS-Up signature genes. (H) Expression of selected transcription factors in Tregs from each donor (as ratio to mean of HD values). Each column corresponds to one individual, with severity group color-coded and a ribbon indicating CRP levels.
Fig. 4.
Fig. 4.
The severe COVID-19 Treg transcriptome overlaps with that of TITR. (A–C) Volcano plots comparing Tregs from severe COVID-19 patients relative to HD, highlighted with signature genes from: (A) colorectal cancer (CRC) vs. colon Tregs (GSE116347); (B) breast tumors vs. normal breast Tregs (GSE89225); (C) nonsmall-cell lung cancer (NSLC) vs. blood Tregs (PRJEB11844); P values from Fisher’s exact. (D) TITR index in Tregs from COVID-19 patients and HD; P values from Mann–Whitney test. (E) Highlight of the severe SCTS Up signature (red) on a plot comparing transcriptome shifts in TITRs vs. tissue-resident Tregs (see ref. 13).
Fig. 5.
Fig. 5.
IL-6 and IL-18 partially recapitulate the severe COVID-19 Treg phenotype in vitro. (A) PBMCs from HDs were left untreated (ctrl) or treated for 24 h with a series of candidate cytokines or metabolites, or cultured in a hypoxic chamber. FoxP3 expression was assessed in gated Tregs by flow cytometry (MFI shown). Different donors depicted by different symbols. (B) Whole PBMCs or purified CD127lo CD25+ Tregs were cultured with IL-6 as and analyzed as in A. Representative profiles from FoxP3+ CD25+CD4+ cells from control or IL-6–supplemented cultures. (C) RNA-seq was performed on Tregs cultured for 24 h with several cytokines or in hypoxic conditions. The effects were parsed by PCA of normalized transcript counts, and the scores used for plotting, color-coded to indicate the SCTS index of each sample. (D) Average score of each SCTS module among the IL-18–treated Tregs (each dot is one of two replicates). (E) Volcano plot comparing IL-18–treated to control, highlighted with genes from SCTS modules 2 and 5.

Update of

References

    1. Mathew D.et al. .; UPenn COVID Processing Unit , Deep immune profiling of COVID-19 patients reveals distinct immunotypes with therapeutic implications. Science 369, eabc8511 (2020). - PMC - PubMed
    1. Laing A. G., et al. ., A dynamic COVID-19 immune signature includes associations with poor prognosis. Nat. Med. 26, 1623–1635 (2020). - PubMed
    1. Su Y.et al. .; ISB-Swedish COVID19 Biobanking Unit , Multi-omics resolves a sharp disease-state shift between mild and moderate COVID-19. Cell 183, 1479–1495.e20 (2020). - PMC - PubMed
    1. Huang C., et al. ., Clinical features of patients infected with 2019 novel coronavirus in Wuhan, China. Lancet 395, 497–506 (2020). - PMC - PubMed
    1. Schulte-Schrepping J.et al. .; Deutsche COVID-19 OMICS Initiative (DeCOI) , Severe COVID-19 is marked by a dysregulated myeloid cell compartment. Cell 182, 1419–1440.e23 (2020). - PMC - PubMed

Publication types

MeSH terms