. 2021 Aug 25;12(1):5109.
doi: 10.1038/s41467-021-25319-7.

Global spread of Salmonella Enteritidis via centralized sourcing and international trade of poultry breeding stocks

Affiliations

Global spread of Salmonella Enteritidis via centralized sourcing and international trade of poultry breeding stocks

Shaoting Li et al. Nat Commun. .

Abstract

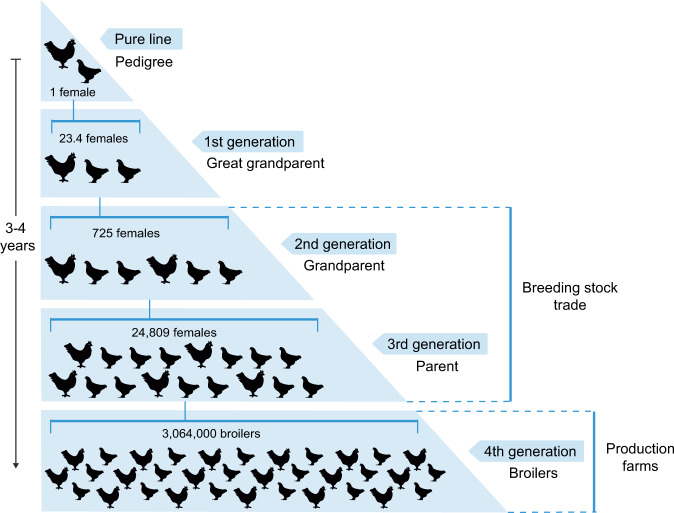
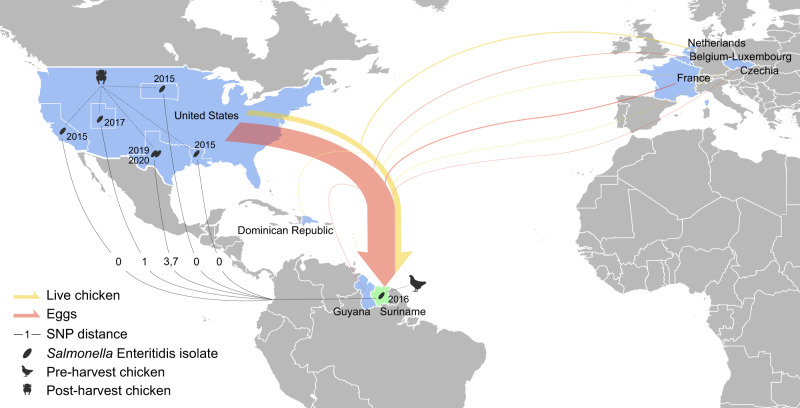
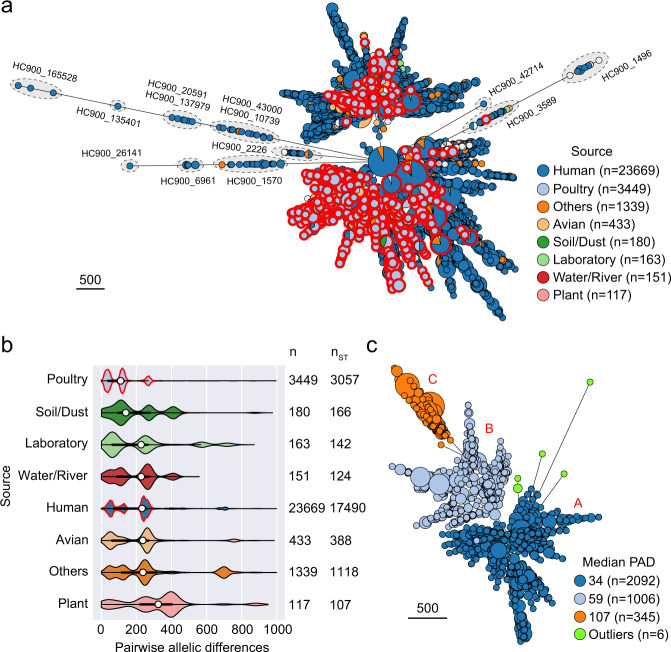
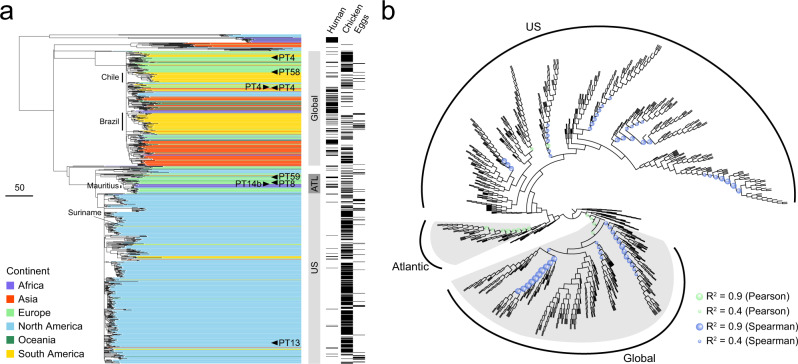
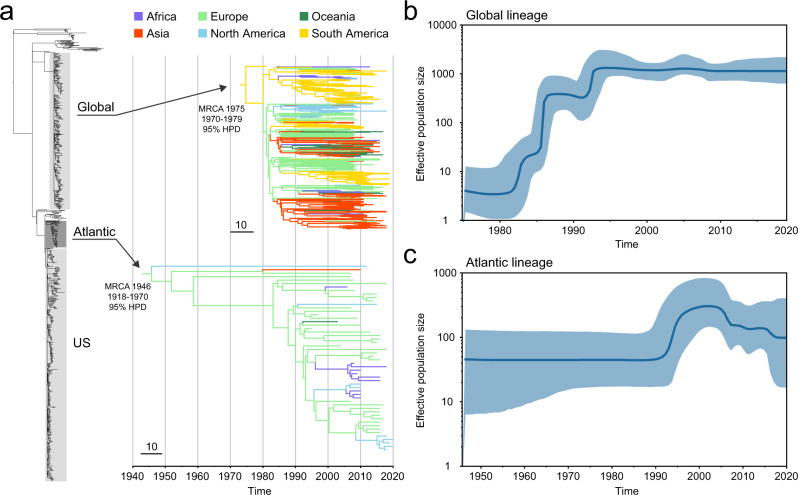
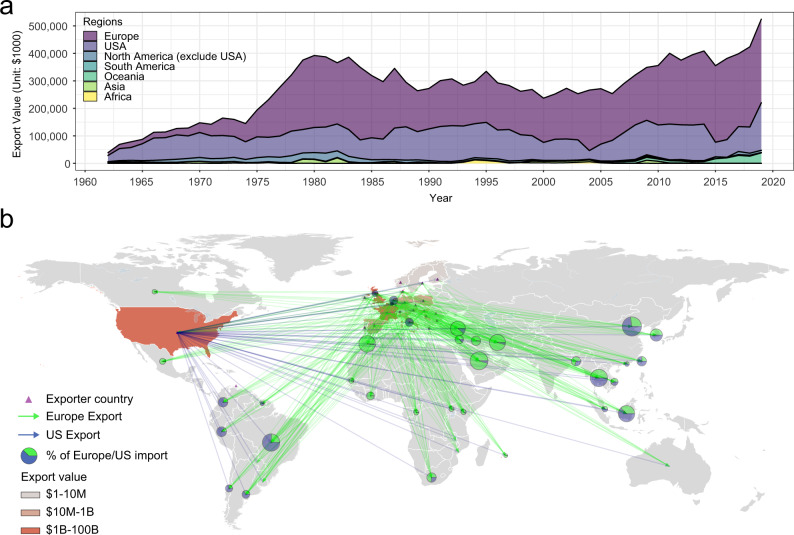
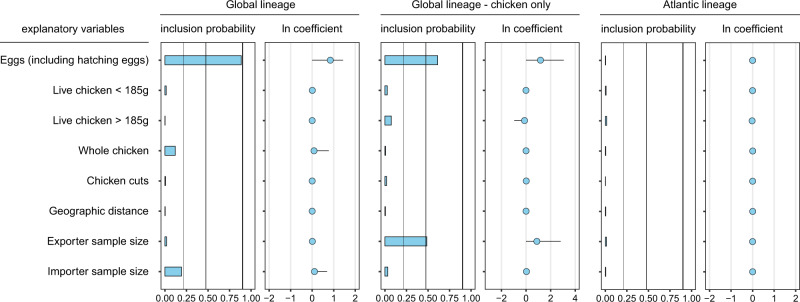
A pandemic of Salmonella enterica serotype Enteritidis emerged in the 1980s due to contaminated poultry products. How Salmonella Enteritidis rapidly swept through continents remains a historical puzzle as the pathogen continues to cause outbreaks and poultry supply becomes globalized. We hypothesize that international trade of infected breeding stocks causes global spread of the pathogen. By integrating over 30,000 Salmonella Enteritidis genomes from 98 countries during 1949-2020 and international trade of live poultry from the 1980s to the late 2010s, we present multifaceted evidence that converges on a high likelihood, global scale, and extended protraction of Salmonella Enteritidis dissemination via centralized sourcing and international trade of breeding stocks. We discovered recent, genetically near-identical isolates from domestically raised poultry in North and South America. We obtained phylodynamic characteristics of global Salmonella Enteritidis populations that lend spatiotemporal support for its dispersal from centralized origins during the pandemic. We identified concordant patterns of international trade of breeding stocks and quantitatively established a driving role of the trade in the geographic dispersal of Salmonella Enteritidis, suggesting that the centralized origins were infected breeding stocks. Here we demonstrate the value of integrative and hypothesis-driven data mining in unravelling otherwise difficult-to-probe pathogen dissemination from hidden origins.


Conflict of interest statement

The authors declare no competing interests.

Figures

Fig. 1
Fig. 1. Breeding pyramid of industrialized poultry production.
Poultry flock sizes derived from a single pedigree female chicken was according to the estimate by Van Eenennaam et al..
Fig. 2
Fig. 2. Closely related poultry Salmonella Enteritidis isolates from Suriname and US and breeding stocks export to Suriname.
Arrows indicate the export of live chickens (yellow) and eggs (red) to Suriname. Export data between 2010 and 2016 from the US and other countries were obtained from the US Foreign Agricultural Service (FAS) and the Observatory of Economic Complexity (OEC), respectively. The sizes of arrows are proportional to the monetary values of export. Export of live chicken from the US includes meat-type and egg-type breeding stocks specifically, while that from the other countries includes day-old chicks <185 g. Export of eggs from the US includes only fertilized eggs, while that from the other countries includes shelled, fresh, preserved or cooked eggs. Salmonella Enteritidis isolates are indicated by ovals at the locations of their isolation along with the isolation years. The Suriname isolate was detected in a pre-harvest broiler bird. The US isolates were detected from post-harvest chickens. The numbers on the solid lines indicate pairwise core genome SNP distance between the Suriname isolate and each US isolate.
Fig. 3
Fig. 3. Global population structure and genomic diversity of Salmonella Enteritidis.
a Minimum spanning tree of 30,015 Salmonella Enteritidis isolates of 22,775 cgMLST sequence types (cgSTs) in EnteroBase. Each node represents a distinct cgST or cgSTs differed by only missing data. The size of each node indicates the number of isolates within that node. Isolates are color coded by EnteroBase-defined sources. Only sources with at least 100 cgSTs are shown. Nodes containing poultry isolates are highlighted by red border. The majority of isolates belong to the HC900_12 cluster defined by EnteroBase. Clusters not belonging to HC900_12 are highlighted by dashed ovals. The scale bar indicates 500 cgMLST alleles. An interactive version of the tree is available at https://enterobase.warwick.ac.uk/ms_tree/51520. b Comparison of intra-source pairwise allelic differences (PADs) based on individual STs. Violin plots show probability densities of PADs. Each boxplot within a violin plot summarizes the distribution of PADs of all isolates in a source. White circles indicate the median PAD values. Thick black bars represent the interquartile ranges. Thin black lines indicate the ranges between maximum and minimum values. Only sources with numbers of isolates (n) and cgSTs (nST) ≥ 100 are shown. “Others” includes isolates without source information or not belonging to any specific source defined in EnteroBase. PADs larger than 1,000 are considered outliers and not included. The peaks of kernel density estimate of the PAD distributions of poultry and human isolates are outlined in red. c Minimum spanning tree of 3,449 Salmonella Enteritidis poultry isolates of 3,057 cgSTs in EnteroBase. Three sub-populations of poultry isolates (A, B, and C) and their individual median PADs are shown. Six outlier isolates (green) belong to four different HC200 clusters including HC200_13575 (n = 3), HC200_12160 (n = 1), HC200_1522 (n = 1). The rest of isolates in A, B, and C belong to the same HC200 cluster, HC200_12. The scale bar indicates 500 cgMLST alleles. An interactive version is available at https://enterobase.warwick.ac.uk/ms_tree/50727.
Fig. 4
Fig. 4. Global phylogeny Salmonella Enteritidis from poultry.
a Maximum-likelihood phylogeny of 914 selected poultry, human, and other isolates from 46 countries. The tree is rooted at midpoint. Three major lineages (Global, Atlantic, and US) are delineated. Each isolate is color coded by the continent of origin. The isolates from humans and poultry (including chickens and eggs) are indicated. Poultry Salmonella Enteritidis clades specific to Chile, Brazil, and Mauritius are delineated. Arrowheads indicate isolates whose phage types are publicly available. ATL, Atlantic. The scale bar indicates 50 SNPs. b Circular cladogram of the same maximum-likelihood phylogeny of the 914 isolates. Colored circles indicate internal nodes that have a squared coefficient (R2) of the Spearman or Pearson correlation between isolation years and branch lengths >0.4. The sizes of the circle are proportional to the values of R2 (0.4–0.9). The Global and the Atlantic lineages that exhibit strong temporal signals of SNP accumulation are shaded in gray.
Fig. 5
Fig. 5. Phylodynamic analyses of the Global and the Atlantic lineages.
a Maximum clade credibility trees and phylogeographical inference. The inferred median MRCA age of each lineage is shown with 95% HPD. MRCA, most recent common ancestor; HPD, highest posterior density. Terminal branches are color coded by the isolates’ continent of origin. Internal branches are colored to indicate the predicted geographical origin with the highest posterior probability value inferred using maximum-likelihood ancestral trait reconstruction. The scale bars indicate 10 SNPs. b, c Bayesian skyline plots showing the historical changes of the effective population size of poultry Salmonella Enteritidis populations in the Global and the Atlantic lineages. Blue lines represent the medians of estimated effective population sizes. Blue shadings indicate the upper and lower bounds of the 95% HPD intervals.
Fig. 6
Fig. 6. Intercontinental trade of live poultry.
a Share of intercontinental trade of live poultry by exporting continents or country from 1962 to 2019. Export between 1962 and 1985 is based on the trade data of live fowls at in Observatory of Economic Complexity database. Export between 1986 and 2019 is based on the trade of live chickens (Gallus domesticus) and guinea fowls (Numida meleagris) according to the Food and Agriculture Organization of the United Nations. b Cumulative intercontinental export of live poultry originated from Europe and the US between 1962 and 2019. Forty-six importers represented by isolates in the phylogenetic analysis (Fig. 4) are shown. Cumulative trade volumes between $24 million (Belgium) and $754 million (China mainland) are designated with pie charts showing the comparisons between total import values from Europe and from the US. The sizes of the pie charts are proportional to the volumes of trade.
Fig. 7
Fig. 7. Contributions of explanatory variables to the international spread of Salmonella Enteritidis in the Global and the Atlantic lineages.
Inclusion probabilities corresponding to Bayes factor support values of 3, 10, and 100 are represented by vertical lines in the bar plots, respectively. The conditional effect size (ln coefficient), which is the effect size when the variable is included in the model, is represented by the mean and credible intervals (95% HPD intervals) of the GLM coefficients on a log scale. HPD, highest posterior density. Bars show the posterior probability of inclusion of each variable in the GLM model. Circles show the estimated conditional effect sizes for the GLM coefficients (>0 = positive association, <0 = negative association).

References

    1. Shahbandeh, M. Production of meat worldwide from 2016 to 2020, by type (in million metric tons). Statistahttps://www.statista.com/statistics/237632/production-of-meat-worldwide-... (2020). Accessed June 09, 2021.
    1. Food and Agriculture Organization of the United Nations. Food and agriculture data http://www.fao.org/faostat/en/#home (Food and Agriculture Organization of the United Nations, 2020). Accessed June 09, 2021.
    1. Mottet A, Tempio G. Global poultry production: current state and future outlook and challenges. World’s Poult. Sci. J. 2017;73:245–256. doi: 10.1017/S0043933917000071. - DOI
    1. Van Eenennaam AL, Weigel KA, Young AE, Cleveland MA, Dekkers JC. Applied animal genomics: results from the field. Annu. Rev. Anim. Biosci. 2014;2:105–139. doi: 10.1146/annurev-animal-022513-114119. - DOI - PubMed
    1. Shrader HL. The Chicken-of-Tomorrom Program: its influence on “meat-type” poultry production. Poult. Sci. 1952;31:3–10. doi: 10.3382/ps.0310003. - DOI

Publication types