. 2021 Aug 25;8(1):226.
doi: 10.1038/s41597-021-01008-4.

Proteomic profiling dataset of chemical perturbations in multiple biological backgrounds

Affiliations

Proteomic profiling dataset of chemical perturbations in multiple biological backgrounds

Deborah O Dele-Oni et al. Sci Data. .

Abstract

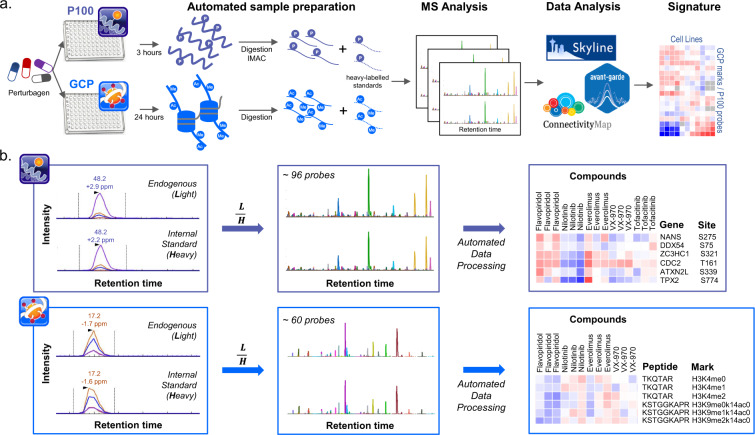
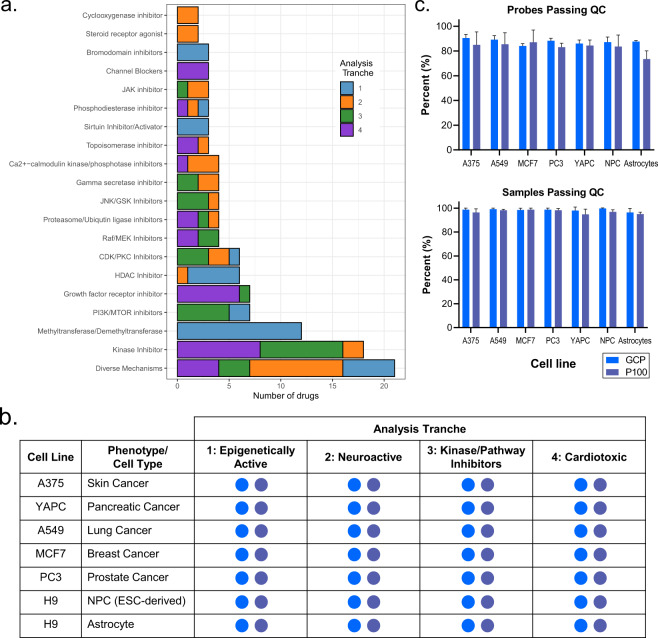
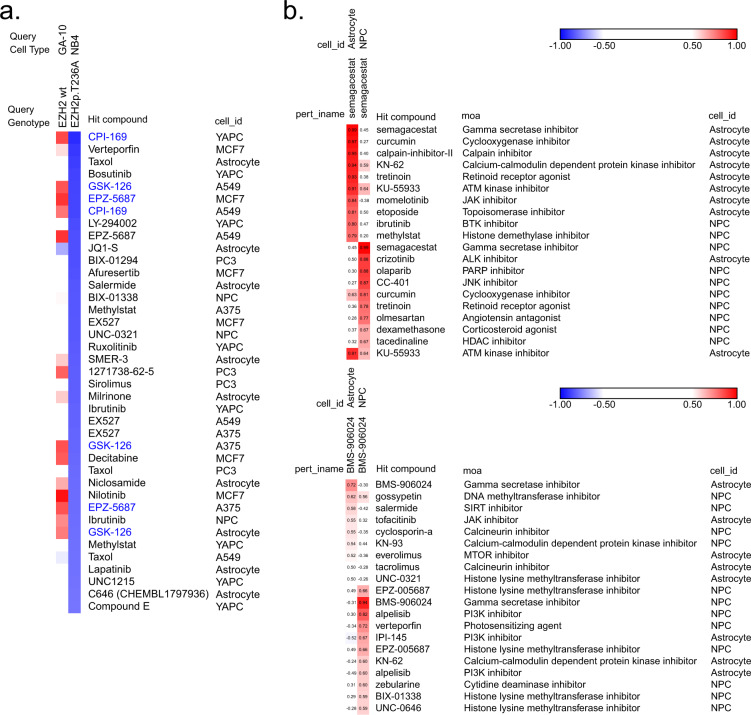
While gene expression profiling has traditionally been the method of choice for large-scale perturbational profiling studies, proteomics has emerged as an effective tool in this context for directly monitoring cellular responses to perturbations. We previously reported a pilot library containing 3400 profiles of multiple perturbations across diverse cellular backgrounds in the reduced-representation phosphoproteome (P100) and chromatin space (Global Chromatin Profiling, GCP). Here, we expand our original dataset to include profiles from a new set of cardiotoxic compounds and from astrocytes, an additional neural cell model, totaling 5300 proteomic signatures. We describe filtering criteria and quality control metrics used to assess and validate the technical quality and reproducibility of our data. To demonstrate the power of the library, we present two case studies where data is queried using the concept of "connectivity" to obtain biological insight. All data presented in this study have been deposited to the ProteomeXchange Consortium with identifiers PXD017458 (P100) and PXD017459 (GCP) and can be queried at https://clue.io/proteomics .


Conflict of interest statement

The authors declare no competing interests.

Figures

Fig. 1
Fig. 1
P100 and GCP experimental workflows. (a) Processing workflow for P100 and GCP. (b) Light (L) and Heavy (H) peptide signal intensities are extracted in Skyline for individual probes within each sample. Light:Heavy ratios (L/H) calculated in Skyline are filtered using the Proteomics Signature Pipeline (https://github.com/cmap/psp). Processed data are represented in the form of a heat map with each column representing an individual sample and each row an individual probe.
Fig. 2
Fig. 2
Content and quality control filtering of the phosphosignaling and epigenetics proteomics data library. (a) Overview of all mechanisms of action (MOAs) of the compounds employed to build the library. These span four broad categories (epigenetically active, neuroactive, kinase/pathway inhibitors and cardiotoxic), each representing an ‘analysis tranche’ of drugs. The “Diverse Mechanisms” category encompasses MOAs that appear only once in the dataset. (b) Overview of the cell lines and drug treatments employed to build the library. Each cell line was treated with all four analysis tranches (29 compounds in each and controls) in 96-well plate batches. Blue circles indicate successful sample processing, acquisition and data analysis for GCP, and purple circles for P100. (c) Mean number of probes (assay analytes) and samples (perturbation conditions) passing QC thresholds for each cell type. Error bars represent the standard deviation calculated within each cell type.
Fig. 3
Fig. 3
Quality assessment of the LINCS signaling and epigenetics proteomics data library. (a) Correlation of replicates for experimental controls employed in the library. Boxplots show the distribution of Spearman correlation coefficients for replicates within the same plate, within the same cell line, and across all cell lines. Boxes indicate the extents of the 1st and 3rd quartile, while whiskers indicate 1.5x the interquartile range. (b) Distributions of all Spearman correlations among replicates (red) and among non-replicates (gray) across the whole dataset, with dashed lines representing the median of the distribution. (c) Bar chart showing the number of compounds considered reproducible in each cell line for each assay. The permutation test was run 10 times with 10,000 bootstrapped iterations; bars represent the average and error bars represent the standard deviation of the 10 runs.
Fig. 4
Fig. 4
Use case illustrations for GCP and P100 data query. (a) Connectivity query of chromatin signatures of EZH2 wild-type (GA-10) and EZH2 mutant (NB4) cell lines from the Cancer Cell Line Encyclopedia (CCLE). This query illustrates how the library can be used to validate a presumptive gain-of-function mutation. Results are sorted from bottom to top ranks for the NB4 line (bottom 5% shown here) and identify EZH2 inhibitors (CPI-169, EPZ-005687, and GSK-126, highlighted in blue) as the most anti-connected hits. (b) Query results and connectivity matrix of two gamma secretase inhibitors, BMS-906024 and Semagacestat, in NPCs and astrocytes. For both drugs, the first ten rows correspond to the top ten most connected drugs to astrocytes, and the bottom ten rows to the top ten most connected drugs to NPCs. This query illustrates how the library can provide insight to a compound’s mechanism of action in differentiated cell types.

Dataset use reported in

  • doi: 10.1038/s41597-021-01114-3

References

    1. Kannaiyan R, Mahadevan D. A comprehensive review of protein kinase inhibitors for cancer therapy. Expert Rev. Anticancer Ther. 2018;18:1249–1270. - PMC - PubMed
    1. Kelly TK, De Carvalho DD, Jones PA. Epigenetic modifications as therapeutic targets. Nat. Biotechnol. 2010;28:1069–1078. - PMC - PubMed
    1. Urdinguio RG, Sanchez-Mut JV, Esteller M. Epigenetic mechanisms in neurological diseases: genes, syndromes, and therapies. Lancet Neurol. 2009;8:1056–1072. - PubMed
    1. Crino PB. The mTOR signalling cascade: paving new roads to cure neurological disease. Nat. Rev. Neurol. 2016;12:379–392. - PubMed
    1. Nativio R, et al. Dysregulation of the epigenetic landscape of normal aging in Alzheimer’s disease. Nat. Neurosci. 2018;21:497–505. - PMC - PubMed

Publication types