. 2021 Aug 25;11(1):17148.
doi: 10.1038/s41598-021-96556-5.

Benchmarking laboratory processes to characterise low-biomass respiratory microbiota

Affiliations

Benchmarking laboratory processes to characterise low-biomass respiratory microbiota

Raiza Hasrat et al. Sci Rep. .

Abstract

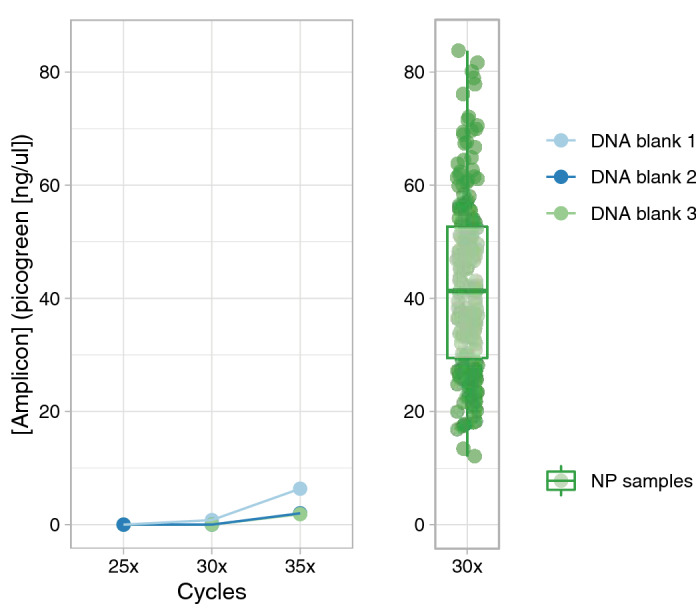
The low biomass of respiratory samples makes it difficult to accurately characterise the microbial community composition. PCR conditions and contaminating microbial DNA can alter the biological profile. The objective of this study was to benchmark the currently available laboratory protocols to accurately analyse the microbial community of low biomass samples. To study the effect of PCR conditions on the microbial community profile, we amplified the 16S rRNA gene of respiratory samples using various bacterial loads and different number of PCR cycles. Libraries were purified by gel electrophoresis or AMPure XP and sequenced by V2 or V3 MiSeq reagent kits by Illumina sequencing. The positive control was diluted in different solvents. PCR conditions had no significant influence on the microbial community profile of low biomass samples. Purification methods and MiSeq reagent kits provided nearly similar microbiota profiles (paired Bray-Curtis dissimilarity median: 0.03 and 0.05, respectively). While profiles of positive controls were significantly influenced by the type of dilution solvent, the theoretical profile of the Zymo mock was most accurately analysed when the Zymo mock was diluted in elution buffer (difference compared to the theoretical Zymo mock: 21.6% for elution buffer, 29.2% for Milli-Q, and 79.6% for DNA/RNA shield). Microbiota profiles of DNA blanks formed a distinct cluster compared to low biomass samples, demonstrating that low biomass samples can accurately be distinguished from DNA blanks. In summary, to accurately characterise the microbial community composition we recommend 1. amplification of the obtained microbial DNA with 30 PCR cycles, 2. purifying amplicon pools by two consecutive AMPure XP steps and 3. sequence the pooled amplicons by V3 MiSeq reagent kit. The benchmarked standardized laboratory workflow presented here ensures comparability of results within and between low biomass microbiome studies.


Conflict of interest statement

The authors declare no competing interests.

Figures

Figure 1
Figure 1
Bacterial composition of Zymo mock diluted in DNA/RNA shield (n = 6; undiluted and 101–103 × diluted), elution buffer (n = 5; 101–103 × diluted) and Milli-Q (n = 5; 101–103 × diluted). (a) Stacked bar charts show the relative abundance of the top 8 operational taxonomic units (OTUs) in (un)diluted Zymo mock stratified by dilution solvent and the theoretical undiluted Zymo mock composition. The diluted Zymo mocks are annotated in the bioinformatic pipeline and have different annotations than the OTUs of the theoretical Zymo mock. Based on inspection of community profiles we found that the OTU annotated as Salmonella enterica refers to Enterobacter, Listeria monocytogenes to Listeria, Staphylococcus aureus to Staphylococcus epidermidis and Enterococcus faecalis to Enterococcus faecium. (b) Boxplots show the relative abundance of each OTU in the dilution solvents. Boxplot depicts the 25th and 75th percentiles by lower and upper hinges, respectively, the median is depicted by a horizontal line in the box. The measurements that fall within 1.5 times the interquartile range are shown by whiskers. Statistical significance in relative abundance between dilution solvents were assessed by ANOVA test. A Tukey's post hoc test was used to determine statistical significance between elution buffer and DNA/RNA shield or Milli-Q. (c) Lollipop plot shows the differences in relative abundance of each OTU between the 103 × diluted Zymo mocks and the theoretical Zymo mock. A strong positive value indicates a higher relative abundance of this OTU found than expected based on the theoretical mock and a strong negative value means that there is less of this OTU observed in the diluted Zymo mock. Coloured points indicate the lowest difference compared to the theoretical Zymo mock for that specific OTU across the dilution solvents. The percentage demonstrates the total cumulative absolute difference in relative abundance across the 8 OTUs compared to the theoretical mock.
Figure 2
Figure 2
Microbiota composition profiles of 2 oropharynx (S003 and S004) and 2 saliva samples (S001 and S002). Stacked bar charts of the relative abundance of the top 15 OTUs and the residuals are shown. (a) Microbiota profile of OP and saliva samples amplified by 25, 30 or 35 PCR cycles. (b) Microbiota composition of OP and saliva samples with a bacterial load of 16, 125 or 1000 pg.
Figure 3
Figure 3
DNA concentration of 3 DNA blanks and 214 NP samples after PCR amplification. DNA concentration was estimated by picogreen quantification. The concentration of DNA blanks is visualized in the left graph shown for 25, 30 and 35 amplification cycles. The DNA concentration of the NP samples amplified by 30 PCR cycles are shown in the boxplot. NP samples had a median concentration of 41.3 ng/µl (range: 12.1–83.7). Boxplot depicts the 25th and 75th percentiles by lower and upper hinges, respectively, the median is depicted by a horizontal line in the box. The measurements that fall within 1.5 times the interquartile range are shown by whiskers. Each green dot is an individual NP sample.
Figure 4
Figure 4
Similarity of a library (n = 214) purified by gel or AMPure XP. (a) To quantify differences in the overall microbial community composition between (pairs of) samples, Bray–Curtis dissimilarity was used, where zero indicates an identical composition between pairs. Unpaired dissimilarity was determined by calculating the dissimilarity of a given sample to all other (unpaired) samples in the other group, whereas paired dissimilarity refers to the dissimilarity between pairs of samples in both groups. Boxplot depicts the 25th and 75th percentiles by lower and upper hinges, respectively, the median is depicted by a horizontal line in the box. The measurements that fall within 1.5 times the interquartile range are shown by whiskers. (b) Correlation plots visualizes log10 + 1-transformed relative abundances of the top 8 OTUs of a pool sequenced using the V2 reagent kit, comparing gel-based and AMPure XP purification methods. For each OTU, the Pearson correlation coefficient and regression coefficient (slope) was calculated. Both the correlation coefficient and the slope show a value close to 1.0, indicating a perfect correlation between purification methods for these OTUs.
Figure 5
Figure 5
Similarity of a library (n = 214) sequenced by MiSeq V2 and V3 kits. (a) Number of reads of samples sequenced by V2 and V3 kit stratified by purification method. Statistical significance in number of reads between V2 and V3 kit was calculated by a linear model. (b) Correlation plots visualize log10 + 1-transformed relative abundances of the top 8 OTUs of a pool purified by AMPure XP, comparing the V2 or V3 reagent kit. For each OTU, the Pearson correlation coefficient and regression coefficient was calculated. Both the correlation coefficient and almost all slopes show a value close to 1.0, indicating a near perfect correlation between purification methods for these OTUs.
Figure 6
Figure 6
Microbiota profiles of nasopharyngeal (NP) samples (n = 140) and DNA blanks (n = 8). (a) Two-dimensional nonmetric multidimensional scaling (NMDS) plot, based on the Bray–Curtis dissimilarity matrix, visualizes the microbial community composition (each point) of the NP samples and DNA blanks (cross). Samples are stratified by DNA concentration based on 16S rRNA gene qPCR quantification (concentration pg/µl: < 0.1; 0.1–0.2; 0.2–0.5; 0.5–1.0). The stress value illustrates how well the high-dimensional data are captured in the two-dimensional space; a value of around 0.2 indicates an acceptable representation. (b) Dendrogram visualizes an average linkage hierarchical clustering of NP samples and DNA blanks based on the Bray–Curtis dissimilarity index. The length of the branches represents the similarities between samples and DNA blanks. Stacked bar charts show the relative abundance of the top 20 OTUs and the residuals. Based on the clustering indices, 8 clusters were identified, 7 clusters solely consisted of NP samples (grey) and one separate cluster contained all DNA blanks and 2 NP samples (in green). Bacterial density colours correspond with colours used in the NMDS plot.

References

    1. Bosch A, et al. Maturation of the infant respiratory microbiota, environmental drivers, and health consequences. A prospective cohort study. Am. J. Respir. Crit. Care Med. 2017;196:1582–1590. doi: 10.1164/rccm.201703-0554OC. - DOI - PubMed
    1. Bosch A, et al. Development of upper respiratory tract microbiota in infancy is affected by mode of delivery. EBioMedicine. 2016;9:336–345. doi: 10.1016/j.ebiom.2016.05.031. - DOI - PMC - PubMed
    1. Reyman M, et al. Impact of delivery mode-associated gut microbiota dynamics on health in the first year of life. Nat. Commun. 2019;10:4997. doi: 10.1038/s41467-019-13014-7. - DOI - PMC - PubMed
    1. Cho I, Blaser MJ. The human microbiome: At the interface of health and disease. Nat. Rev. Genet. 2012;13:260–270. doi: 10.1038/nrg3182. - DOI - PMC - PubMed
    1. de Steenhuijsen Piters WA, Sanders EA, Bogaert D. The role of the local microbial ecosystem in respiratory health and disease. Philos. Trans. R. Soc. Lond. B Biol. Sci. 2015;370:294. doi: 10.1098/rstb.2014.0294. - DOI - PMC - PubMed

Publication types

Substances