. 2021 Sep;597(7874):119-125.
doi: 10.1038/s41586-021-03850-3. Epub 2021 Aug 25.

A clinically applicable integrative molecular classification of meningiomas

Affiliations

A clinically applicable integrative molecular classification of meningiomas

Farshad Nassiri et al. Nature. 2021 Sep.

Abstract

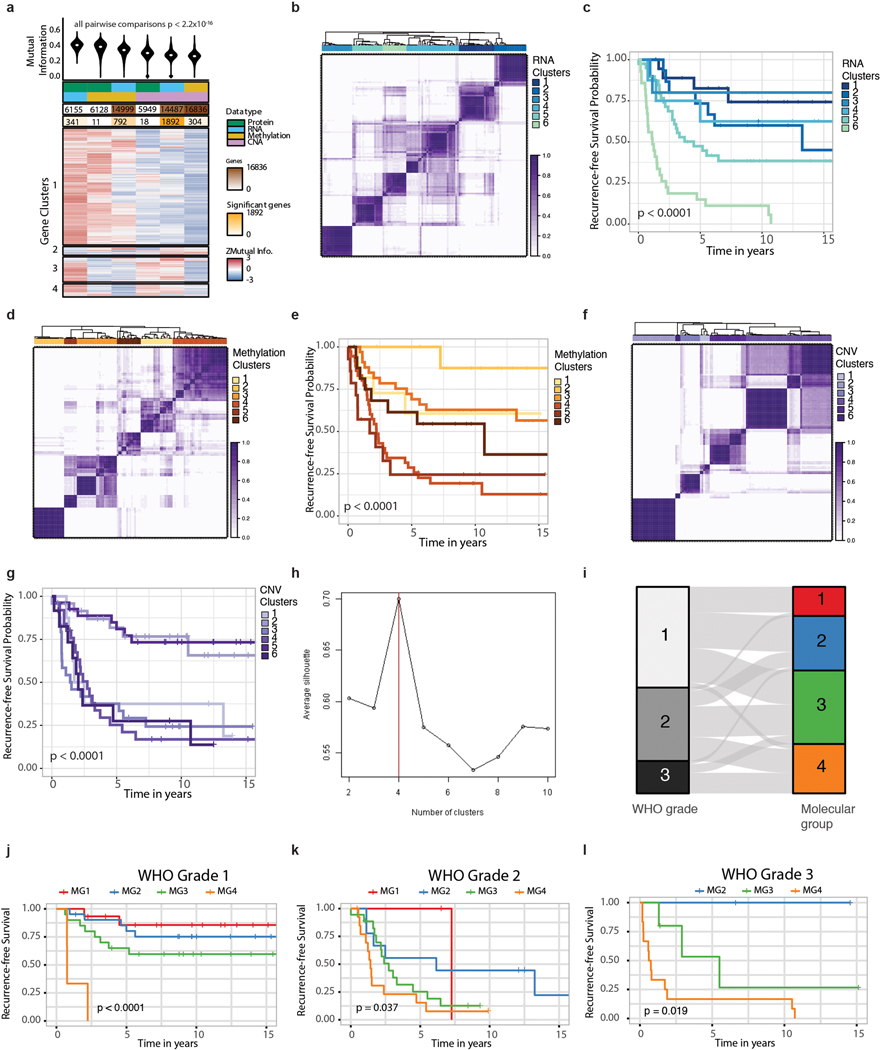
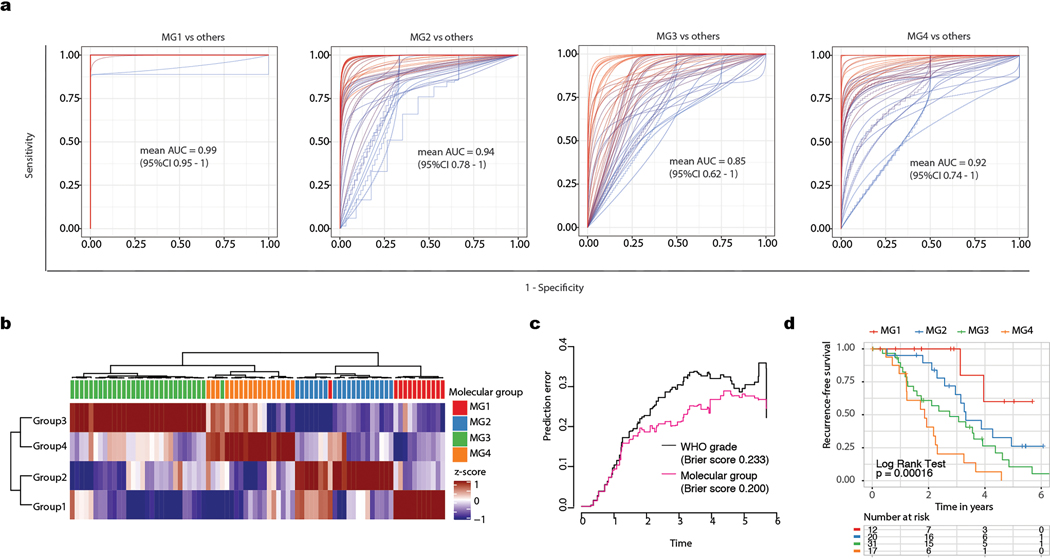
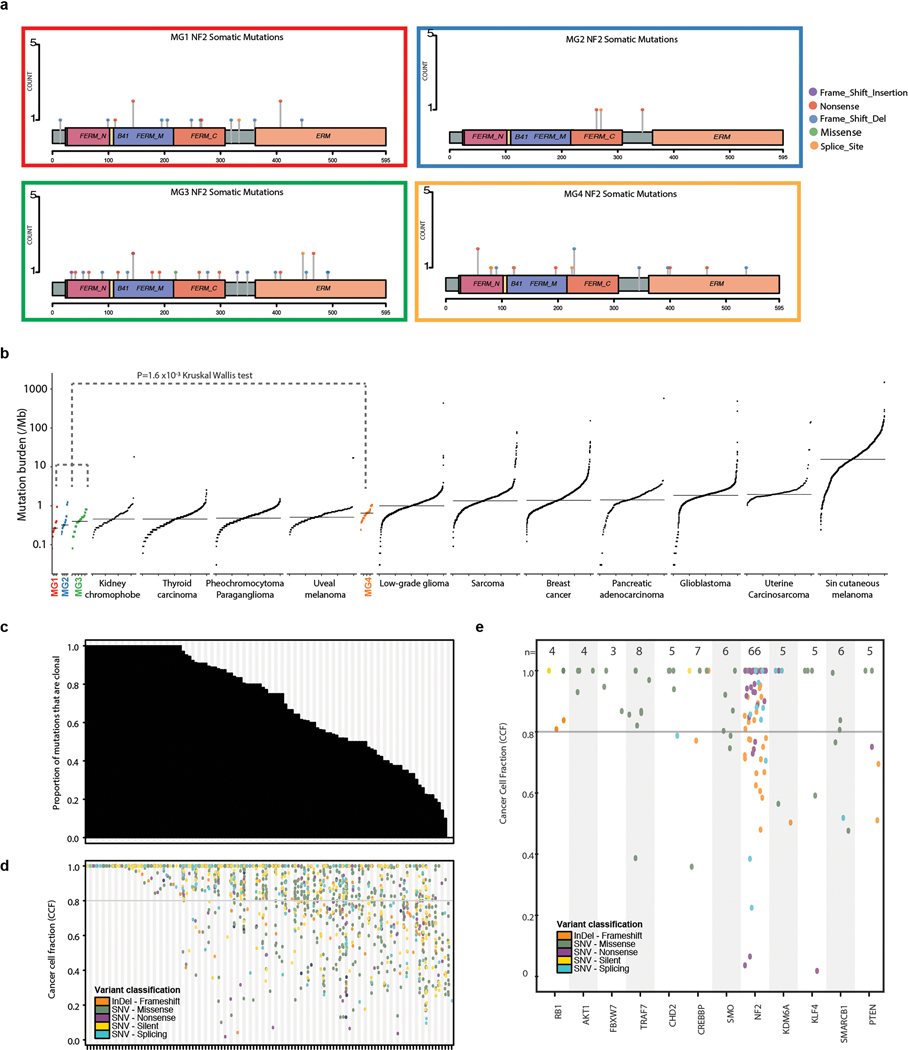
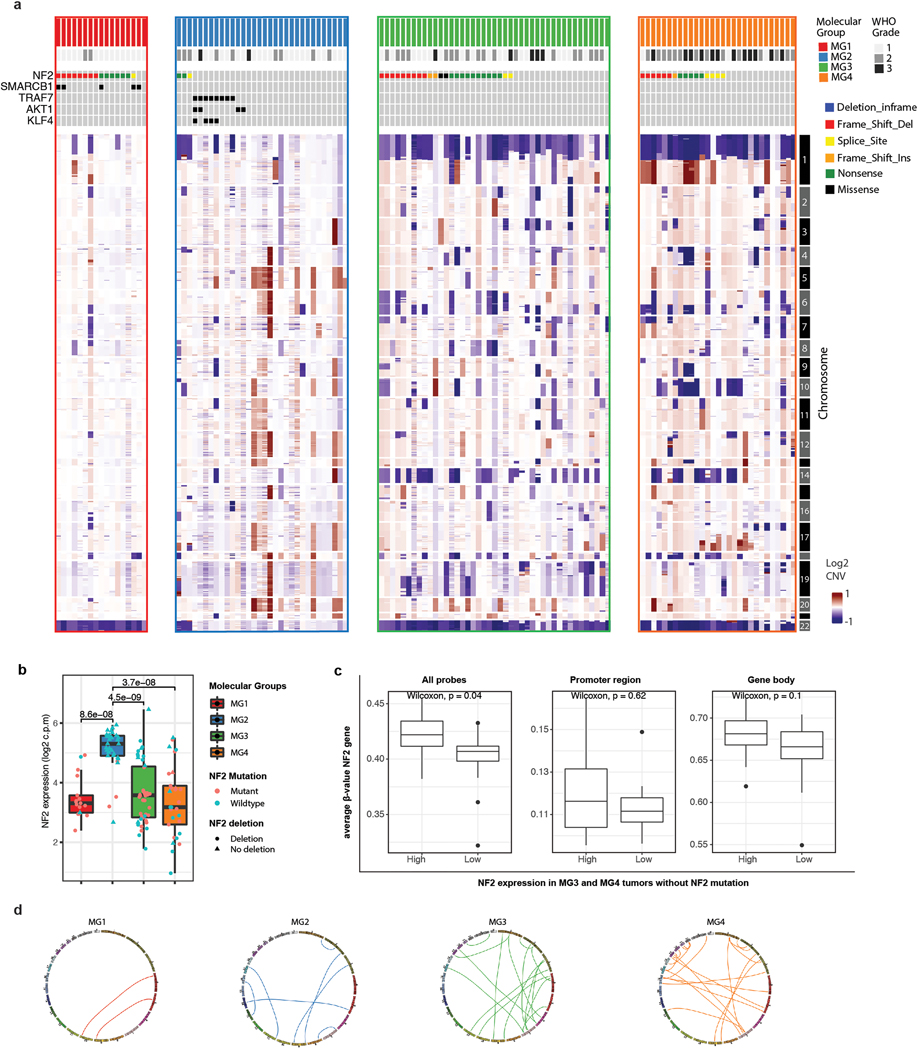
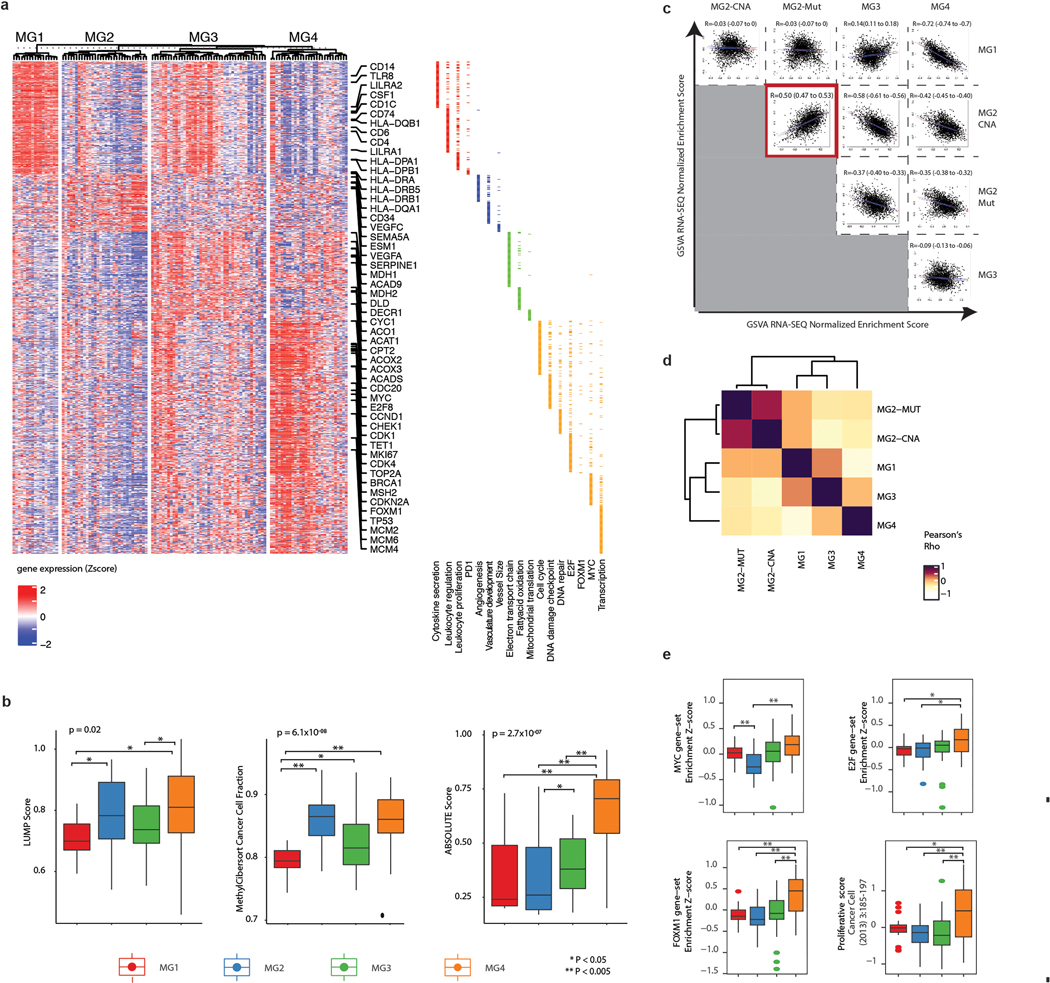
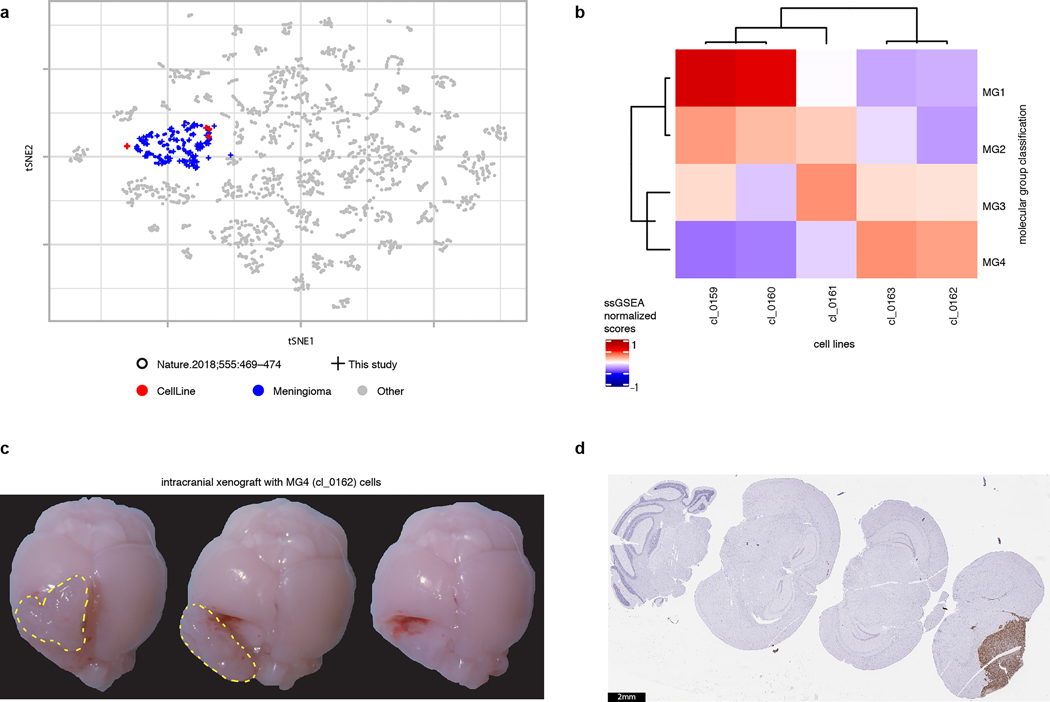
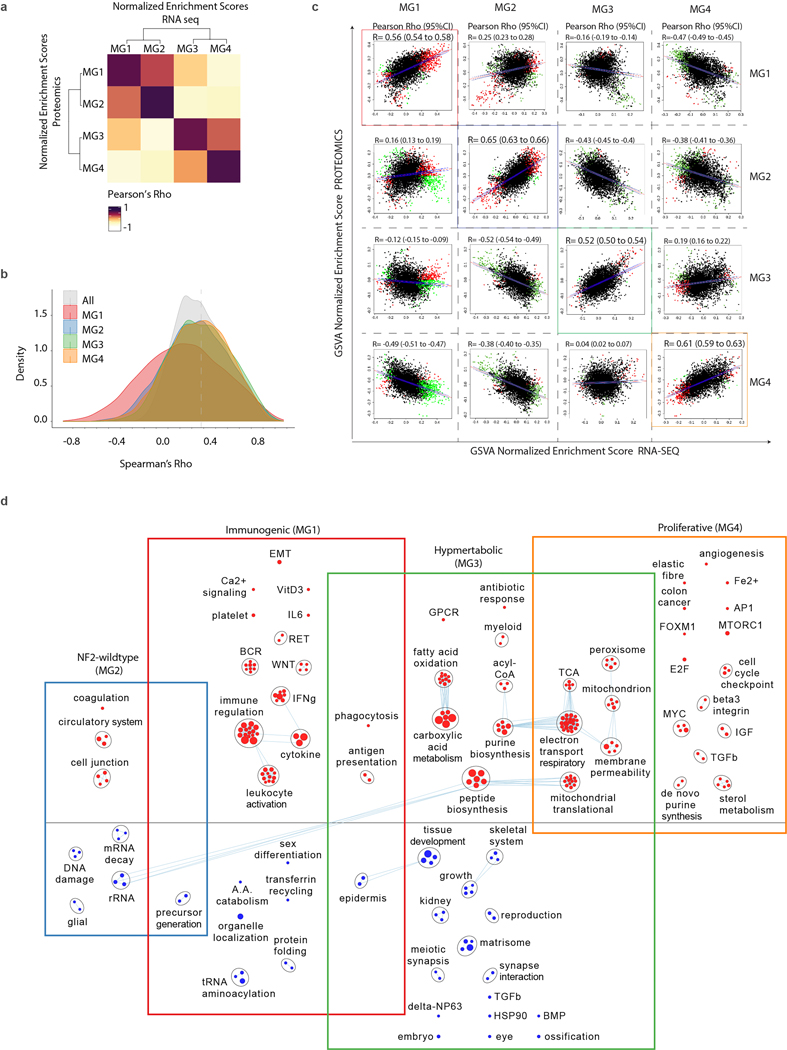
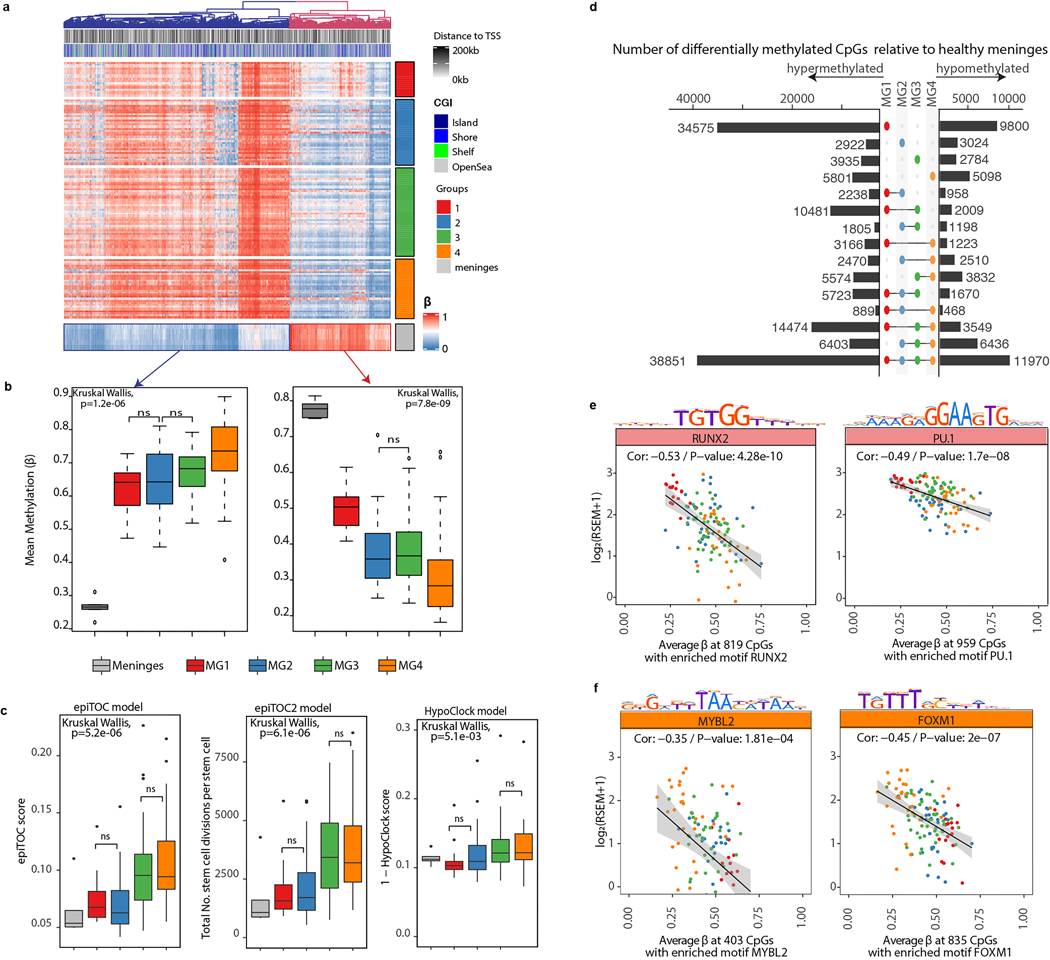
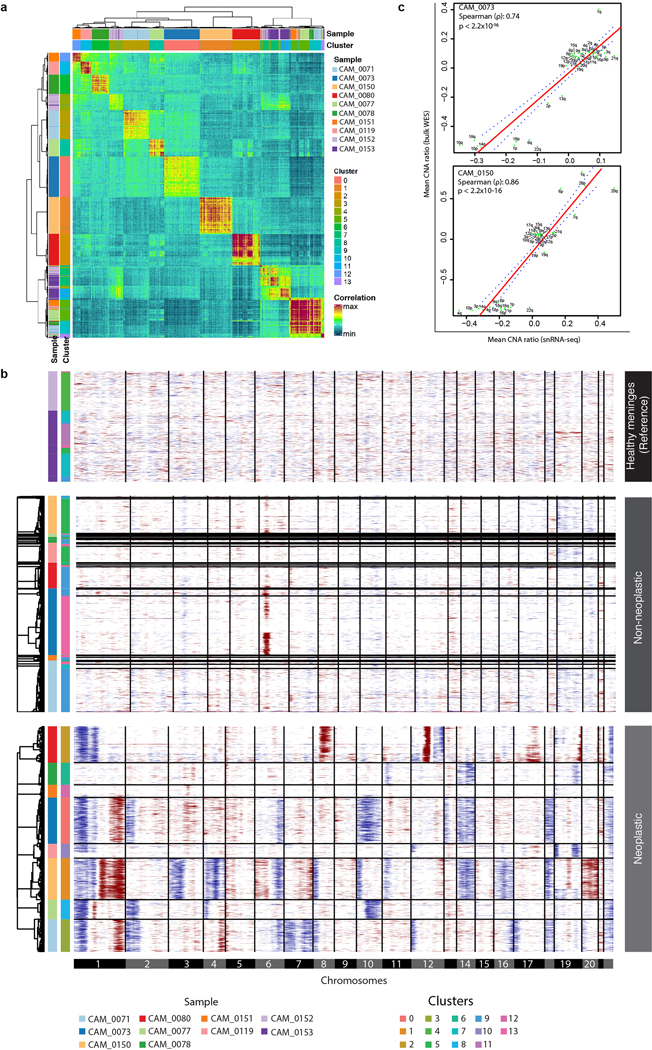
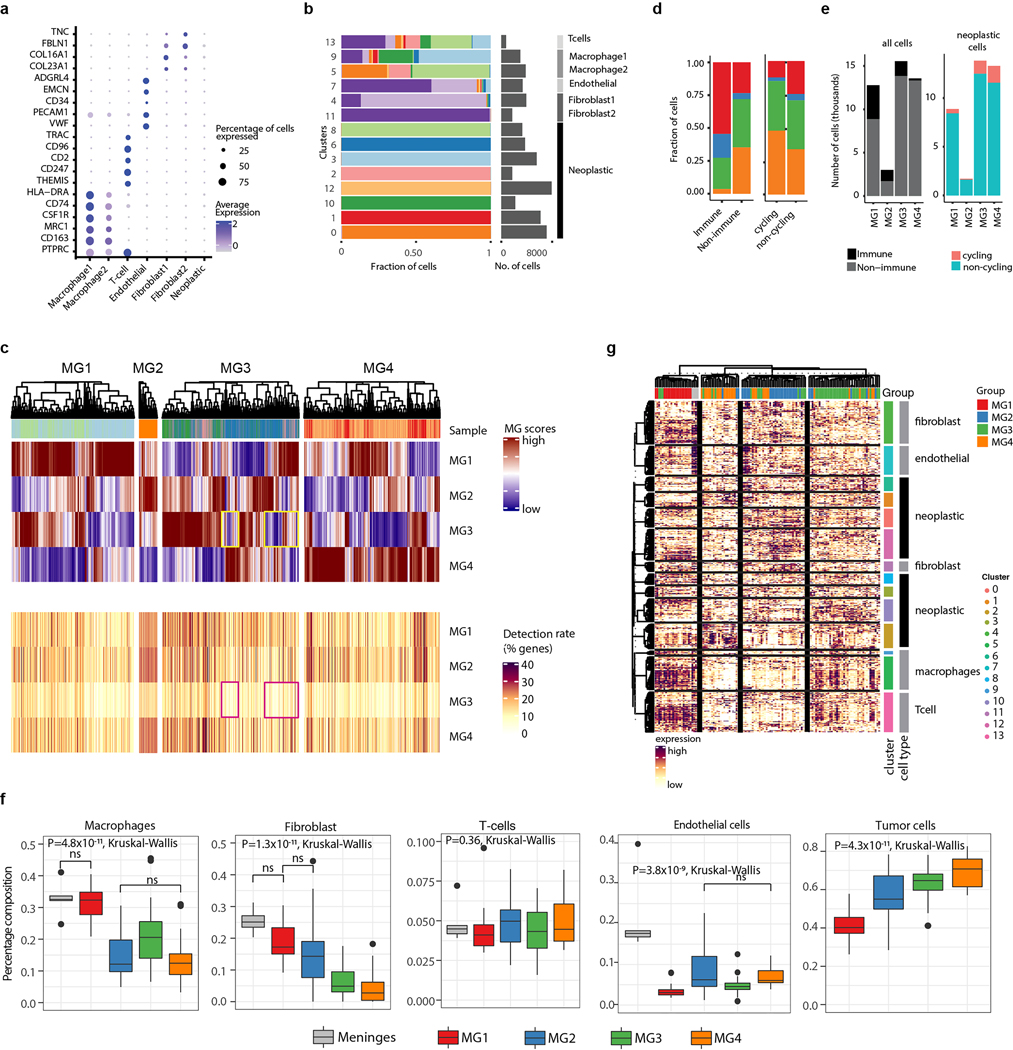
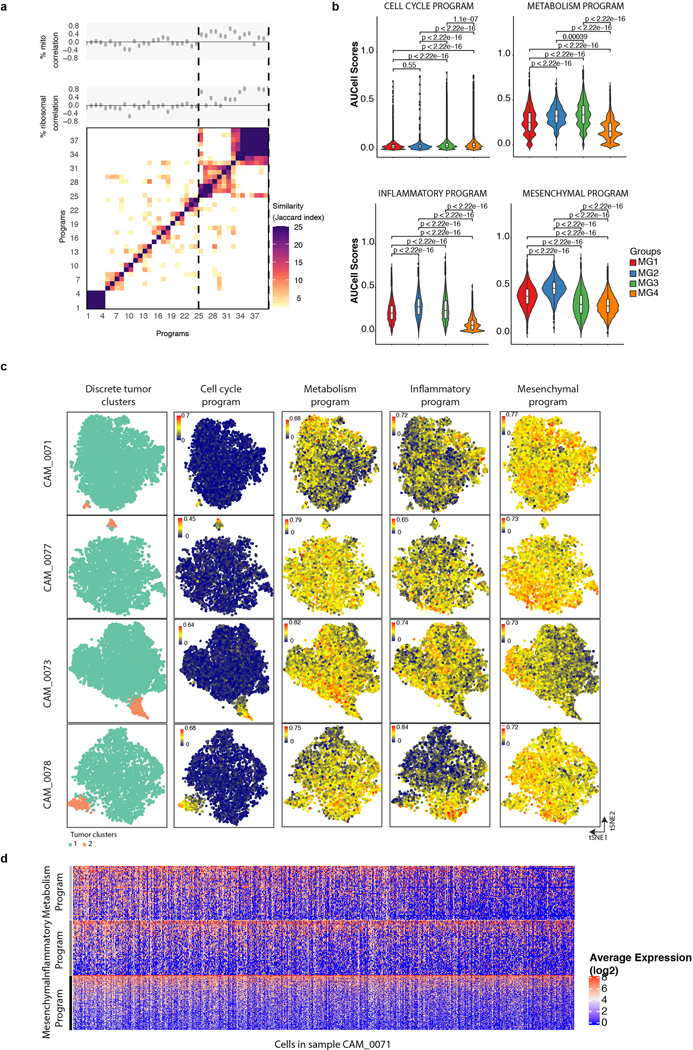
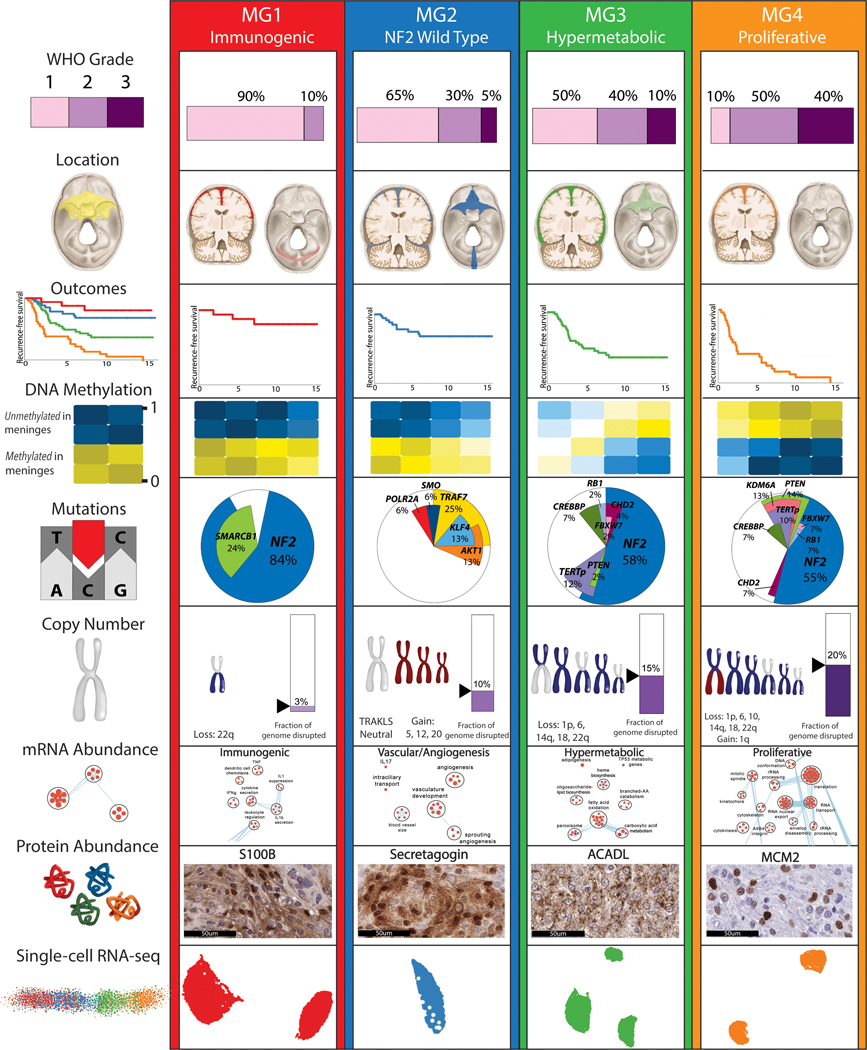
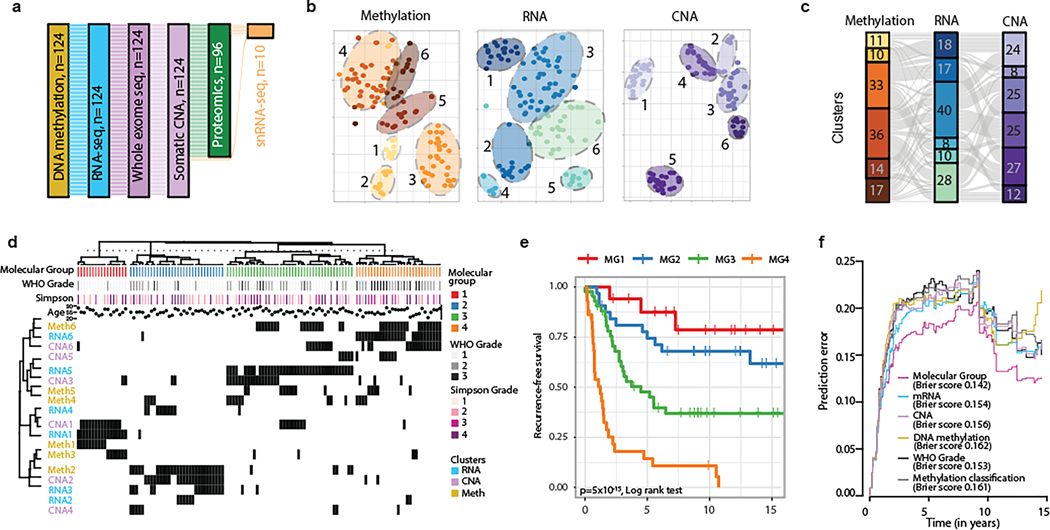
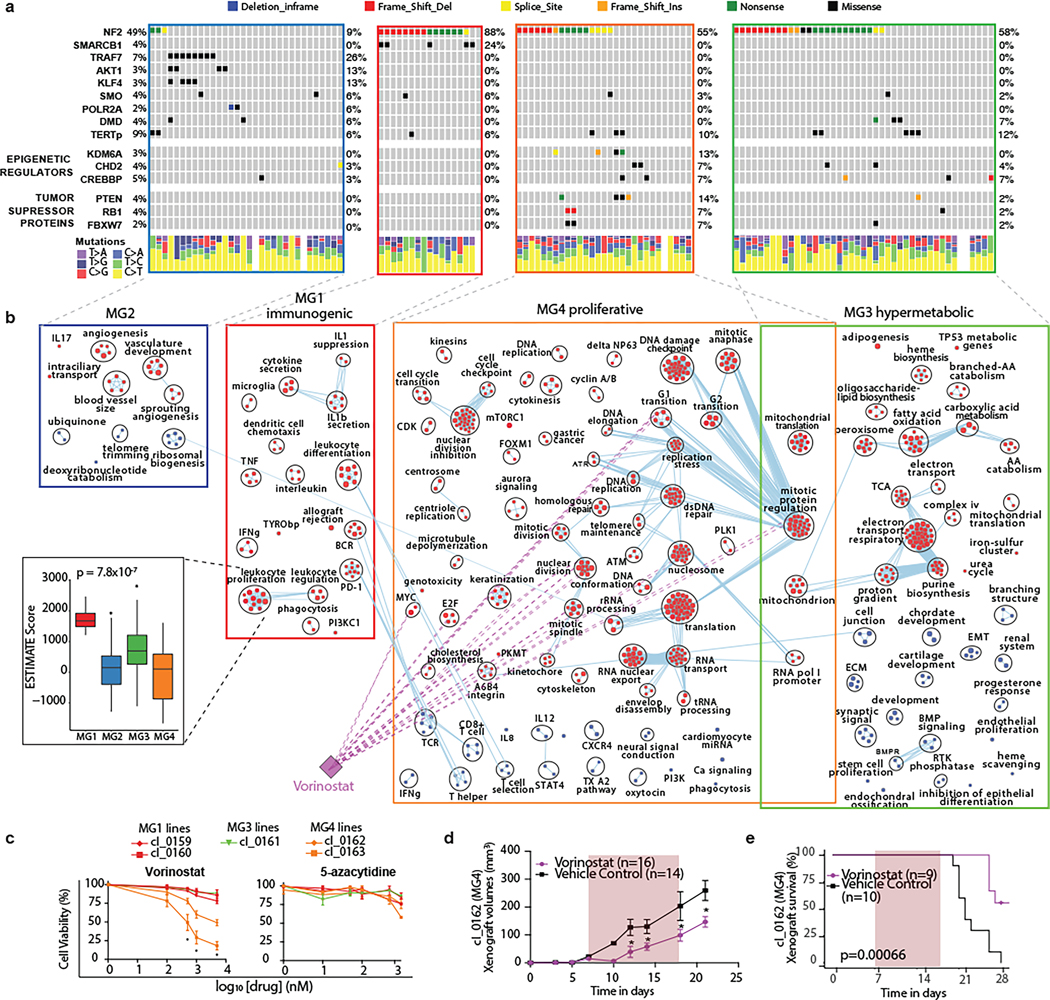
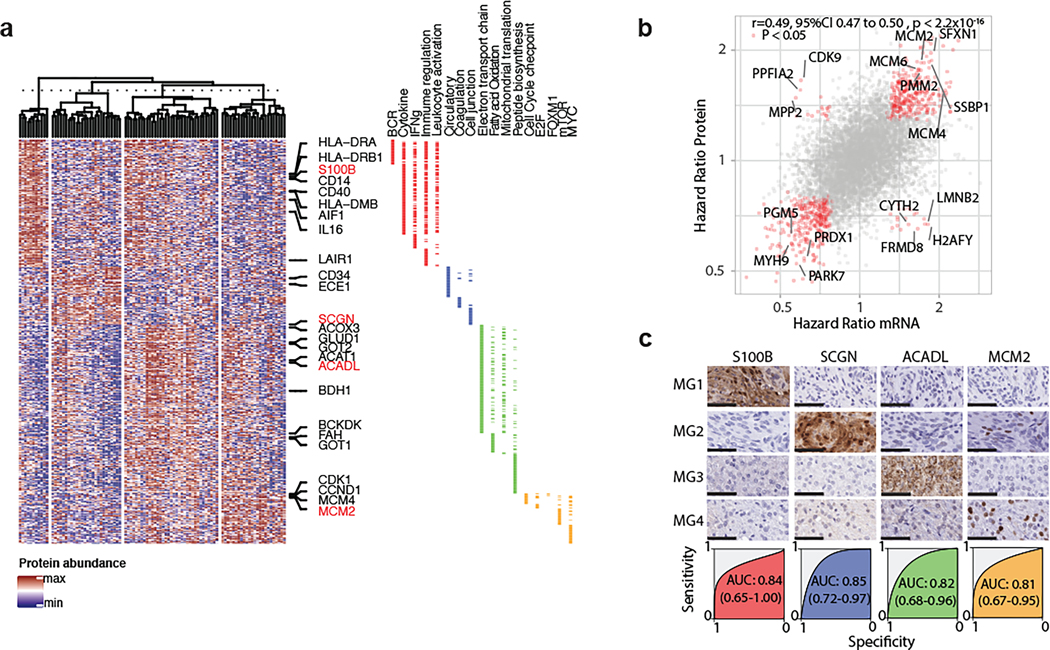
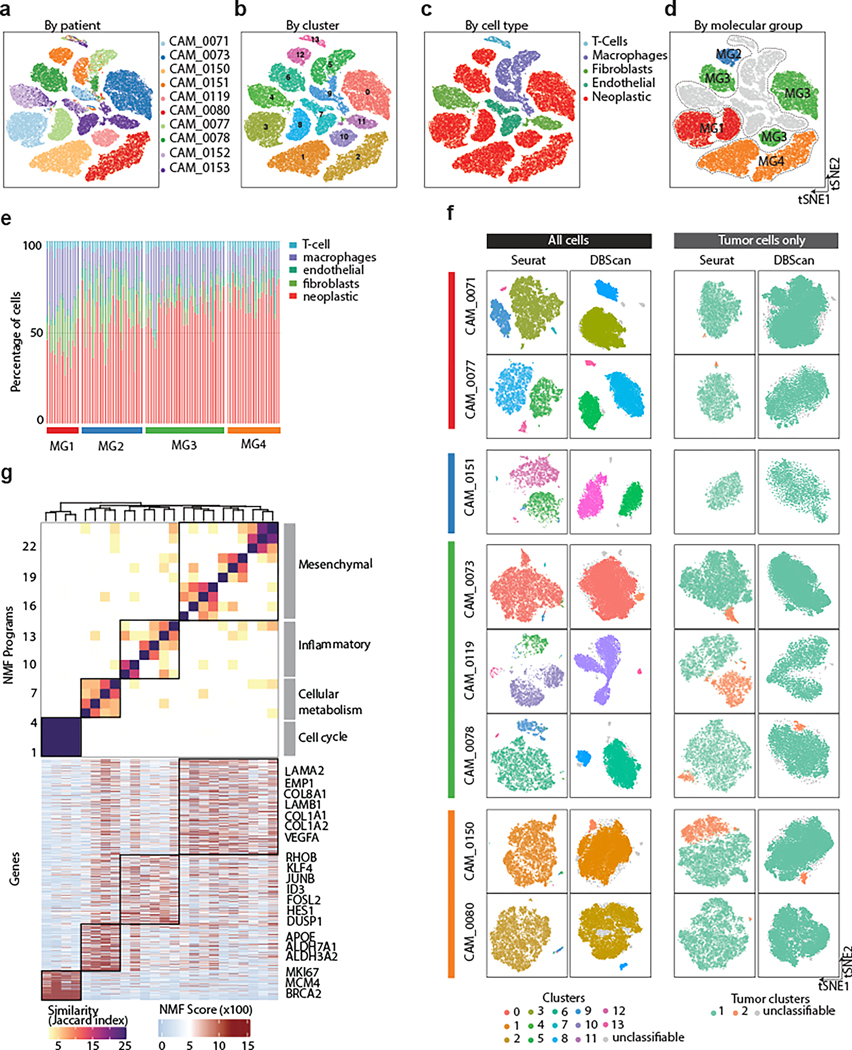
Meningiomas are the most common primary intracranial tumour in adults1. Patients with symptoms are generally treated with surgery as there are no effective medical therapies. The World Health Organization histopathological grade of the tumour and the extent of resection at surgery (Simpson grade) are associated with the recurrence of disease; however, they do not accurately reflect the clinical behaviour of all meningiomas2. Molecular classifications of meningioma that reliably reflect tumour behaviour and inform on therapies are required. Here we introduce four consensus molecular groups of meningioma by combining DNA somatic copy-number aberrations, DNA somatic point mutations, DNA methylation and messenger RNA abundance in a unified analysis. These molecular groups more accurately predicted clinical outcomes compared with existing classification schemes. Each molecular group showed distinctive and prototypical biology (immunogenic, benign NF2 wild-type, hypermetabolic and proliferative) that informed therapeutic options. Proteogenomic characterization reinforced the robustness of the newly defined molecular groups and uncovered highly abundant and group-specific protein targets that we validated using immunohistochemistry. Single-cell RNA sequencing revealed inter-individual variations in meningioma as well as variations in intrinsic expression programs in neoplastic cells that mirrored the biology of the molecular groups identified.


Conflict of interest statement

D.D.D.C., and A.C. are listed as inventors on patents filed that are unrelated to this project. D.D.D.C. received research funding from Pfizer and Nektar therapeutics not related to this project.

Figures

Extended Data Fig. 1
Extended Data Fig. 1. Individual datatype classification of meningiomas.
a, Violin plots showing the distribution of the normalized mutual information (MI) for each pairwise comparison of datatype. Median is shown as white dot. The number of total genes and number of genes with statistically significant (FDR< 5%) MI values are shown. Below this is a heatmap showing the consensus clustering of genes where MI was significant for at least one datatype pair. Rows represent a gene for which data exists from all data types. b,d,f, Unsupervised consensus hierarchical clustering of (b), 5,000 genes that show that highest median absolute deviation across expression values, (d), 10,000 CpG sites that show that highest median absolute deviation across β-values, (f), 1,000 genes that show that highest median absolute deviation across copy number ratios. Heatmap of consensus matrices with K=6 groups (b,d,f) are displayed. Overall, six groups were most stable across all platforms. c,e,g, Kaplan Meier-plot displaying recurrence-free survival (RFS) distributions of unsupervised cluster assignments by (c) mRNA data, (e) DNA methylation data, (g) copy number data. The associations with outcomes are unique for the 6 cluster groups obtained on individual platform analyses. h, Average silhouette widths for unsupervised consensus hierarchical clustering from K=2 to K=10. The silhouette score is a measure of stability of number of groups. Higher scores indicate greater stability and robustness. Average silhouette width is highest at K=4 subgroups. i, Alluvial plot demonstrating associations between WHO grade and integrative molecular groups defined in this study. j-l, Kaplan Meier-plot displaying recurrence-free survival (RFS) distributions of patients stratified and colored by molecular group assignments for WHO grade 1 tumors (j), WHO grade 2 tumors (k), and WHO grade 3 tumors (l).
Extended Data Fig. 2.
Extended Data Fig. 2.. Generalizability of the association of molecular groups with outcome
a, Ensemble of Receiver Operating Characteristic (ROC) curves from 50 iterations of trained MG-versus-other models. Overlaid for each model is the mean Area Under the Curve (AUC) and its associated 95% confidence interval for samples in corresponding test sets. b, Heatmap showing results of single-sample Gene-Set Enrichment Analysis (ssGSEA) using mRNA data in an independent cohort of 80 meningioma samples. Each sample in the validation set was assigned a score for Molecular Groups 1, 2, 3 and 4 using gene-expression based signatures from the discovery cohort. MG designation was determined by highest scores from ssGSEA assignments. Unsupervised hierarchical clustering using scores from MG assignments revealed four distinctive groups of tumors w with 97% of samples having concordant assignment by maximal scores. Samples almost always showed high scores that were distinctive to only a single group, highlighting the robustness of classification in an independent cohort. c, Brier prediction curve for recurrence-free survival comparing molecular group to WHO grade in the generalization cohort. The models tested were those developed on the discovery cohort. Prediction errors are consistently lowest using molecular groups in comparison to the validation cohort (integrated Brier score 0.179 vs 0.211). d, Kaplan Meier-plot displaying recurrence-free survival (RFS) distribution of patients stratified and colored by molecular group assignments for generalization set. P value reported is a Log Rank Test. Distributions are highly similar to those obtained in discovery cohort.
Extended Data Fig. 3:
Extended Data Fig. 3:. Most mutations are clonal in meningioma
a, Lollipop plots showing the distribution of NF2 mutations by genomic regions within each molecular group. b, Mutational burden (nonsynonymous mutations per megabase) of meningiomas stratified by molecular groups in comparison to other TCGA solid cancers. Every dot represents a sample and horizontal lines are median number of mutations in each cancer type. Mutational burden in each cancer is ordered by percentile rank. Cancer types are ordered on the horizontal axis based on their median numbers of somatic mutations. Mutational burden of Group 4 tumors is statistically higher than Groups 1–3 (P=1.6 ×10⁻³, Kruskal Wallis test). c, Distribution of the number of mutations that are considered clonal per each patient sample (column). A total of 26% of tumors exhibited only clonal point mutations. In the median tumor, 75% of single nucleotide variants were clonal. d, Cancer cell fraction of all variants in each patient sample (columns) ordered as in (c). Variants are colored according to the classification in the legend. e, Cancer cell fraction of recurrent oncogenic driver mutations (columns). Variants are colored according to the classification in the legend.
Extended Data Fig. 4:
Extended Data Fig. 4:. Genomic disruptions differ among molecular groups
a, Genome-wide copy-number alterations computed from whole-exome sequencing data. Arrangements of copy number profile are matched to the samples from mutation plot above. Only mutations that are relevant to discussion in text are shown. b, Boxplots showing the mRNA expression of NF2 stratified by molecular group. Each dot is a sample. Samples are colored by NF2 mutation status and shapes are according to NF2 deletion status by CNA. Some MG3 and MG4 meningiomas that are NF2 wildtype show silencing of NF2 expression. c, Boxplots comparing the mean methylation level of NF2 wildtype MG3 and MG4 meningiomas with high versus low NF2 expression using all probes (left), those mapping to the promoter region (middle), and those mapping to the gene body (right). d, Circos plot showing the landscape of interchromosomal gene rearrangements detected using a stringent threshold for conservative estimation of fusion events (unique spanning reads ≥ 25) in each molecular group. Total number of interchromsomal fusion in MG1, MG2, MG3 and MG4 are 2, 7,18, and 23, respectively.
Extended Data Fig. 5:
Extended Data Fig. 5:. Gene expression profiles of molecular groups
a, Hierarchical clustering of the expression of genes from select pathways identified in Fig. 2a. Selected genes have been labeled. Redundancy of genes to pathways is shown in the side bar. b, Boxplots showing the results for estimates of immune and stromal infiltration by DNA methylation (LUMP score on left and methylCIBERSORT in middle) and somatic DNA alterations (right, ABSOLUTE score). c, Scatterplots comparing normalized enrichment scores between molecular groups using Gene Set Variation Analysis (GSVA). Each dot is a pathway. Shown at the top of each panel are Pearson correlations and associated 95%CI. MG2 tumors were divided into tumors that are driven by CNA (MG2-CNA) and tumors that are driven by mutations (MG2-Mut). Correlations were highest when comparing MG2 tumors driven by CNA to MG2 tumors driven but mutations (red box). d, Hierarchical clustering of normalized enrichment scores from (c) identifies MG2-CNA and MG2-Mut tumors as one coherent group. e, Boxplots comparing the activation of molecular proliferative signatures between MGs. Statistical significance is denoted by asterisks.
Extended Data Fig. 6:
Extended Data Fig. 6:. Molecular characterization of patient derived cell lines
a, t-distributed Stochastic Neighbor Embedding (tSNE) plot of genome-wide DNA methylation profiles of patient derived cell lines (red), to meningiomas (blue), and 2798 previously published tumors from 40 other brain tumor types. b, Heatmap showing results of single-sample Gene-Set Enrichment Analysis (ssGSEA) using mRNA data from cell lines. Each cell line was assigned a score for Molecular Groups 1, 2, 3 and 4 using gene-expression based signatures from the discovery cohort. MG designation was determined by highest scores from ssGSEA assignments. c, Gross morphological images of a representative MG4-xenografted mice. Extra axial tumor is outlined in dashed yellow lines. Compression on adjacent neural structures is evident after partial (middle panel) and complete (right panel) separation of meningioma from brain. d, Serial sections and immunostaining for MCM2 in representative MG4-xenograted mice. Scale bar is 2mm. Small areas of tumor that have invaded the brain can be seen staining for MCM2.
Extended Data Fig. 7:
Extended Data Fig. 7:. Proteomic and gene expression data converge to similar biology driving each molecular group
a, Hierarchical clustering of normalized enrichment scores obtained by Gene-Set Variation Analysis (GSVA) using proteomic data (rows) and mRNA data (columns). b, Distribution of correlation of mRNA expression to protein abundance in all samples (grey), MG1 meningiomas (red), MG2 meningiomas (blue), MG3 meningiomas (green) and MG4 meningiomas (orange). Vertical line indicates overall median correlation across all samples (Spearman’s r = 0.279, 95%CI 0.273–0.284). c, Scatterplots comparing normalized enrichment scores by GSVA using gene expression (x-axis) and protein abundance (y-axis) stratified by MG classifications. Each dot represents a pathway. Pathways that are statistically significant and concordant by protein and mRNA data are colored green while those that are discordant are colored green. Pearson correlations and 95% confidence intervals are indicated at the top of each panel. d, Network of activated gene circuits by proteome data in N=96 samples. Protein groups were ranked for each subtype by degree of differential expression. Gene-set enrichment analysis was performed on the ranked gene lists and enriched pathways are visualized using the EnrichmentMap plugin in Cytoscape App. Nodes represent pathways and edges represent shared genes between pathways. Pathways above horizontal line are up-regulated (red nodes) in each molecular group while pathways below horizontal line are down-regulated (blue nodes) in each molecular group.
Extended Data Fig. 8:
Extended Data Fig. 8:. Differences in genome-wide methylation across meningioma groups
a, Hierarchical clustering of highly differentially methylated CpGs (absolute Δβ>0.35, FDR < 0.05) between all meningiomas and healthy meninges. Annotations of MGs are on the right side of heatmap. b, Boxplots showing the distribution of β values for probes in (a) that are hypermethylated in healthy meninges (left) and hypomethylated in healthy meninges (right). Pairwise comparisons in each boxplot are statistically significant (p < 0.05), unless explicitly stated otherwise (ns, not significant). c, Boxplots showing the distribution of using epigenetic mitotic clocks with epiTOC model (left), epiTOC2 model (middle), and HypoClock model (right). Pairwise comparisons in each boxplot are statistically significant (p < 0.05), unless explicitly stated otherwise (ns, not significant). d, Number of unique and overlapping probes that are differentially methylated (absolute Δβ>0.1, FDR < 0.05) when comparing each MG group to healthy meninges. Bar plot on the left indicates the total number of probes that were hypomethylated in each comparison, and barplot on the right indicates total number of probes that were hypermethylated in each comparison. e, Scatterplots comparing master regulator transcription factor expression with average β at sites enriched for the motif of that transcription factor. Samples are colored according to molecular group. Pearson correlation with 95% confidence intervals are reported. Hypomethylation at motifs of immunological-lineage-specific transcription factors such as PU.1, RUNX1/2 and IRF5/8 were enriched in immunogenic (MG1) tumors (P= 1.05×10⁻⁸, hypergeometric test) and associated with enhancer hypomethylation. Similarly, master regulators of cell proliferation such as MYBL2, LHX4, and FOXM1 were hypomethylated in proliferative (MG4) tumors and associated with increased abundance of these transcription factors (P= 1.24×10⁻³, hypergeometric test).
Extended Data Fig. 9:
Extended Data Fig. 9:. Meningiomas show low within patient variation of expression and copy number profile
a, Pairwise correlations of expression profiles of all cells ordered by hierarchical clustering. Each cell is annotated to tumor of origin from Fig. 4a and cluster assignments from Fig. 4b at top and side bars. b, Inferred genome-wide copy number variations of single nuclei of healthy meninges (reference, top panel), immune cells (middle panel), and neoplastic cells (bottom panel). Sample and cluster annotation are shown on the left. The copy number plot of these tumors are homogenous and subclones of cells within tumors with distinct copy number profiles are not readily identifiable. Annotation to patient of origin and cluster on the left of each heatmap. c, Scatterplots showing the relationship between arm-level CNA inferred by snRNA-seq (x-axis) to matched CNA by bulk whole exome sequencing (y-axis). Two representative samples are shown.
Extended Data Fig. 10:
Extended Data Fig. 10:. The transcriptome of MGs is shaped by the expression profiles from both neoplastic and non-neoplastic cells
a, Bubble plot showing the expression of lineage specific markers for distinct cell types. b, Stacked barplot showing the relationship of samples to clusters. Samples are colored by patient of origin as in Fig. 4a. Barplot to the right shows the number of cells within each cluster. c, The top heatmap shows hierarchical clustering results of single cells by MG scores. Each cell was scored for the bulk signature of each MGs and scores were compared to a permuted random gene set. Shown are cells with at least one score with FDR < 0.2. Scores were scaled such that the sum of all scores for each cell is equal to one. Below is a matched heatmap showing the number of genes detected for each MG signature in each cell. In a subset of cells, low scores are associated with low detection rate of genes (yellow and pink boxes). d, Stacked barplot showing the distribution of immune versus non-immune cells across molecular groups (left) and cycling versus non-cycling neoplastic cells across molecular groups (right) to clusters. Samples are colored by molecular group of tumor as in Fig. 4d. e, Barplot showing the total number of cells that are immune versus non-immune (left) and cycling versus non-cycling (right) by MG status of tumor of origin f, Boxplots comparing the cell type composition of bulk RNA seq samples after deconvolution using single cell RNA-seq signatures. Pairwise comparisons in each boxplot are statistically significant (p < 0.05), unless explicitly stated otherwise (ns, not significant). g. Heatmap showing the expression of marker genes for single cell clusters (determined by CIBERSORTx) in bulk RNA seq data. Each column represents one tumor. Rows are designated marker genes for each cluster. Tumors were partitioned into 4 partitions by consensus k-means clustering with samples and gene sets clustered by hierarchical clustering using Pearson distance metric.
Extended Data Fig. 11:
Extended Data Fig. 11:. Discrete and continuous patterns of variability can be identified in meningioma
a, Hierarchical clustering of similarities between NMF programs. Top panel indicates Pearson correlations between number of mitochondrial and ribosomal genes detected with NMF scores for each program. A cluster of programs (dashed lines) showed positive correlation with the expression of mitochondrial and ribosomal genes (confirmed by manual inspection). These programs were considered to be reflective of technical artifacts and not included in subsequent analyses. b, Violin plots showing the distribution of activation scores for NMF programs across MGs. c, Side-by-side tSNEs showing the relationship of discrete clustering results with activation scores of each NMF program. Shown are four representative samples. Activation scores of cell cycle program are closely associated with discrete clusters, whereas scores of metabolism, inflammatory, and mesenchymal program are not associated with discrete clusters. d, Heatmap showing the average expression of genes defining NMF programs (annotated to left) in representative sample CAM_0071. Cells are ranked and ordered according to the activation score of the metabolism program. There is a continuous pattern of gene expression variability in these programs.
Extended Data Fig. 12.
Extended Data Fig. 12.. Graphical summary of findings.
Shown is a schematic representation that summarizes the major molecular findings and conclusions of our study: unsupervised consensus clustering combining DNA copy number, DNA methylation, and mRNA sequencing data revealed four robust groups of tumors with prototypical biology and distinct clinical outcomes.
Figure 1.
Figure 1.. Integrative multiplatform analysis reveals 4 novel molecular groups of meningioma
a, Flow diagram showing relationship of molecular datasets in this study: whole-exome sequencing, DNA methylation and mRNA sequencing (n=124), proteomics (n=96), and single cell data (n=8). A total of 121 samples were used for discovery on bulk analyses, with an additional 3 samples assembled specifically for single cell analyses. b, t-distributed stochastic neighbor embedding (tSNE) reduction of individual platform data with annotated unsupervised cluster assignments for each individual platform. c, Alluvial plot showing relationships of unsupervised cluster assignments from individual platforms analyses using DNA methylation, RNA sequencing, and copy number data. Width of the nodes and edges are proportional to the number of samples. d, Multiplatform higher order integration of genetic, epigenetic and transcriptomic data by Cluster-of-Cluster assignments. Cluster assignments for each independent platform (rows) are shown for each sample (columns). Membership for a given cluster is noted by a black tick. Annotation for clinical factors: WHO grade and the extent of resection (Simpson grade) are shown above the matrix. e, Kaplan Meier estimates of recurrence-free survival of patients according to molecular groups. f, Brier prediction curve for recurrence-free survival comparing classification by molecular groups to WHO grade, DNA methylation cluster assignments by the DKFZ, and cluster assignments by the individual data types in this study. The integrated Brier score is shown for each datatype.
Figure 2:
Figure 2:. Molecular groups are distinguished by prototypical biology that inform on novel therapeutics
a, Oncoprint showing the recurrent somatic mutations identified in samples in this study. Novel and recurrent mutations in epigenetic regulators and tumor suppressor genes are detected. Colors in oncoprint represent different types of somatic alterations. The relative proportions of the six different possible base-pair substitutions across all variants in each sample are shown in the bottom of the panel. b, Network of distinguishing gene circuits for each molecular group by mRNA abundance. Nodes represent pathways and edges represent shared genes between pathways. Nodes colored in red are up-regulated pathways while those colored in blue are downregulated pathways in each molecular group. Light purple edges represent the pathways that are targeted by Vorinostat. Inset shows a boxplot comparing inferred immune cell infiltrates by ESTIMATE between MGs. c, Results of cell viability assay testing the efficacy of Vorinostat and 5-azacytidine on patient-derived meningioma cell lines that recapitulate specific MGs. Cell lines aligned to MG4 are colored orange, those aligned to MG1 are colored red, and those aligned to MG3 are colored green. * indicates statistical significance by Student’s t test at p < 0.05. Vorinostat shows a reduction in more than 50% cell viability in MG4 cell lines only, whereas other general treatments such as 5-azacytidine do not show any anti-tumor activity in meningiomas. d, Tumor volumes of intracranial MG4-xenografted mice measured by serial MRI measurements during treatment with Vorinostat or control. * indicates statistical significance by Student’s t test at p < 0.05. e, Kaplan-Meier overall survival distribution of MG4-intracranial xenografts treated with Vorinostat versus control. Statistical significance tested by Log-rank test.
Figure 3:
Figure 3:. Proteogenomic characterization validates the robustness of MGs and identifies markers that can distinguish MGs by immunohistochemistry
a, Hierarchical clustering of genes from select pathways identified by GSEA. Selected genes have been labeled. Gene annotation to pathway(s) is shown in the side bar. b, Scatterplot of Hazard Ratios of genes by gene expression (x-axis) and protein abundance (y-axis). Genes with significant associations with outcome are colored in red. Selected genes are labeled. Pearson correlation and its associated 95% confidence interval are shown. c, Panel showing immunohistochemistry results for group specific markers. Selected are four representative cases (rows). Images shown for each patient are at the same region of the slide for each antibody. Scale bars represent 50um. Each case was subjected to unbiased digital quantitation. Below the panel of representative stains are the Receiver-Operating characteristic (ROC) curve for each antibody with the Area Under the Curve (and 95%CI by Delong method).
Figure 4:
Figure 4:. Single cell RNA sequencing of human meningiomas reveals substantial interpatient heterogeneity and subtle within patient variability
a-d, Side-by-side-by-side-by-side t-distributed Stochastic Neighbor Embedding (tSNE) plots of 54,393 nuclei from ten samples, colored by patient of origin (a), cluster number (b), cell type (c), and molecular group of tumor of origin (d). e, Stacked barplot showing distribution of cell type fractions in bulk RNA-seq data. Samples are grouped according to molecular group. Deconvolution was performed using CIBERSORTx f, t-distributed Stochastic Neighbor Embedding (tSNE) plot show cluster results for each tumor sample using all cells (left) and tumor cells only (right). Clustering was performed by both Seurat and DBSCAN. Cells that are colored gray by DBScan algorithm did not meet the parameters for clustering (see Methods). For clustering of all cells, the different colors represent the cluster color scheme in (b). For clustering of neoplastic cells, the different colors represent discrete tumor subpopulations. Annotation of patient sample and MG is shown to the left of the tSNEs. g, Hierarchical clustering of pairwise similarities between non-negative matrix factorization (NMF) programs on the basis of number of shared genes. Four groups of similar programs (meta-programs, black boxes) were identified. The NMF scores for each gene within modules are plotted below as a heatmap. Select genes are labelled. Programs (column) are labelled as in above heatmap.

References

    1. Ostrom QT et al. CBTRUS Statistical Report: Primary Brain and Other Central Nervous System Tumors Diagnosed in the United States in 2012–2016. Neuro. Oncol 21, v1–v100 (2019). - PMC - PubMed
    1. Goldbrunner R. et al. EANO guidelines for the diagnosis and treatment of meningiomas. Lancet. Oncol 17, e383–91 (2016). - PubMed
    1. Sahm F. et al. DNA methylation-based classification and grading system for meningioma: a multicentre, retrospective analysis. Lancet Oncol. 18, 682–694 (2017). - PubMed
    1. Clark VE et al. Genomic analysis of non-NF2 meningiomas reveals mutations in TRAF7, KLF4, AKT1, and SMO. Science (80-. ) 339, 1077–1080 (2013). - PMC - PubMed
    1. Brastianos PK et al. Genomic sequencing of meningiomas identifies oncogenic SMO and AKT1 mutations. Nat. Genet 45, 285–289 (2013). - PMC - PubMed

References (Methods only)

    1. Aryee MJ et al. Minfi: a flexible and comprehensive Bioconductor package for the analysis of Infinium DNA methylation microarrays. Bioinformatics 30, 1363–1369 (2014). - PMC - PubMed
    1. Ritchie ME et al. limma powers differential expression analyses for RNA-sequencing and microarray studies. Nucleic Acids Res. 43, e47–e47 (2015). - PMC - PubMed
    1. Li H. & Durbin R. Fast and accurate short read alignment with Burrows-Wheeler transform. Bioinformatics 25, 1754–1760 (2009). - PMC - PubMed
    1. McKenna A. et al. The Genome Analysis Toolkit: A MapReduce framework for analyzing next-generation DNA sequencing data. Genome Res. 20, 1297–1303 (2010). - PMC - PubMed
    1. Cibulskis K. et al. Sensitive detection of somatic point mutations in impure and heterogeneous cancer samples. Nat. Biotechnol 31, 213–219 (2013). - PMC - PubMed

Publication types

Substances