

Multilevel-growth modelling for the study of sustainability transitions
- PMID: 34434847
- PMCID: PMC8374327
- DOI: 10.1016/j.mex.2021.101359
Multilevel-growth modelling for the study of sustainability transitions
Abstract
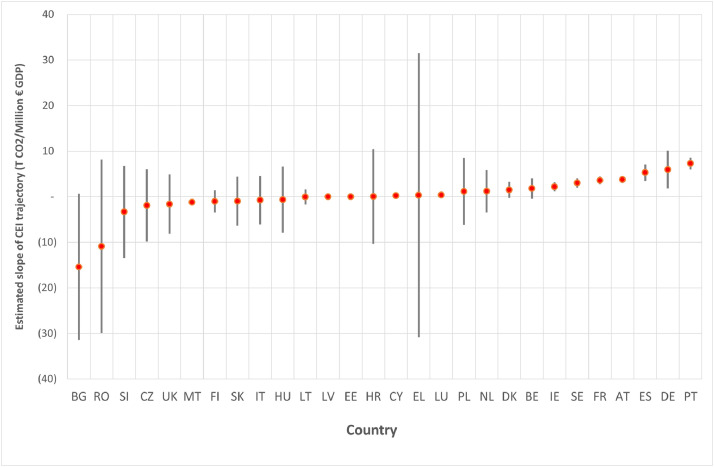
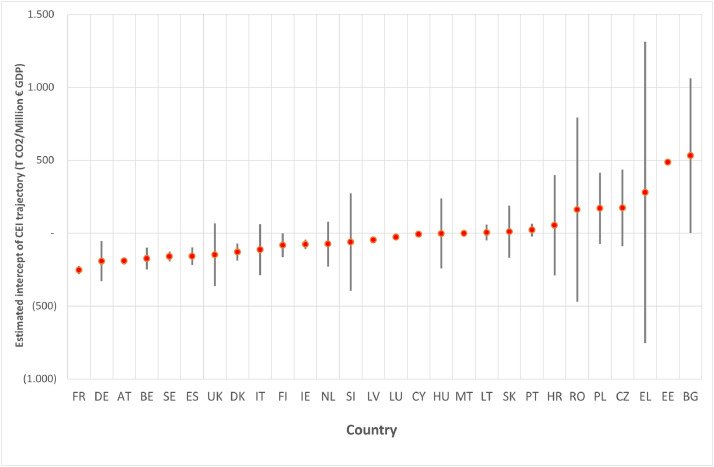
Sustainability Transitions (ST) is a complex phenomenon, encompassing environmental, societal and economic aspects. Its study requires a proper investigation, with the identification of a robust indicator and the definition of a suitable method of analysis. To identify the most informative geographical boundaries for analysing ST pathways, we consider the Carbon Emission Intensity (CEI) and estimate a four-level growth model to study its pattern over time for all the EU regions. We apply this model to a novel longitudinal dataset that covers CEI data of European regions at four different geographical scales (state, areas, regions, and provinces) over a nine-year timespan. This approach aims at supporting the decision-makers in developing more effective sustainability transitions policies across Europe, especially focusing on regions and overcoming the well-known "one-size fits all" approach.•The unconditional growth model has been applied to a multi-level structure considering four levels, defined by three geographical scales and time.•The ideal structure of the model would have required five levels, but the sample size of the dataset made the application computationally unfeasible;•The application of the model allowed to identify patterns of stability and change over time of the variable amongst different geographical units.
Keywords: Carbon emission intensity; Multilevel-growth model; Sustainability transitions; Time dependence; Transition Pathways.
© 2021 The Authors. Published by Elsevier B.V.
Conflict of interest statement
The authors confirm that there are no conflicts of interest.
Figures


References
-
- Acquaye A., Ibn-Mohammed T., Genovese A., Africa G.A., Yamoah F.A., Oppon E. A quantitative model for environmentally sustainable supply chain performance measurement. Eur. J. Oper. Res. 2018;269:188–205.
-
- Bates D., Mächler M., Bolker B., Walker S. Fitting linear mixed-effects models using lme4. J. Stat. Softw. 2015;67(1):1–48.
-
- Bollen K.A., Curran P.J. John Wiley & Sons; Hoboken, NJ: 2006. Latent Curve Models: A Structural Equation Perspective.
-
- Byrne B.M. Structural Equation Modeling With Mplus: Basic concepts, applications, and Programming. Routledge/Taylor & Francis Group; 2012. Multivariate applications series.
-
- Byrne B.M., Crombie G. Modeling and testing change: an introduction to the latent growth curve model. Underst. Stat. 2003;2(3):177–203.
LinkOut - more resources
Full Text Sources
