. 2021 Oct;90(4):570-583.
doi: 10.1002/ana.26200. Epub 2021 Sep 17.

Brain Structure and Degeneration Staging in Friedreich Ataxia: Magnetic Resonance Imaging Volumetrics from the ENIGMA-Ataxia Working Group

Affiliations

Brain Structure and Degeneration Staging in Friedreich Ataxia: Magnetic Resonance Imaging Volumetrics from the ENIGMA-Ataxia Working Group

Ian H Harding et al. Ann Neurol. 2021 Oct.

Abstract

Objective: Friedreich ataxia (FRDA) is an inherited neurological disease defined by progressive movement incoordination. We undertook a comprehensive characterization of the spatial profile and progressive evolution of structural brain abnormalities in people with FRDA.

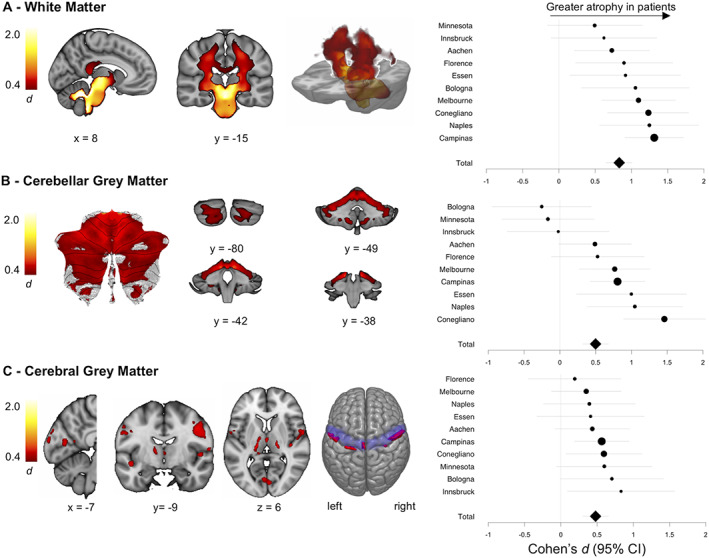
Methods: A coordinated international analysis of regional brain volume using magnetic resonance imaging data charted the whole-brain profile, interindividual variability, and temporal staging of structural brain differences in 248 individuals with FRDA and 262 healthy controls.

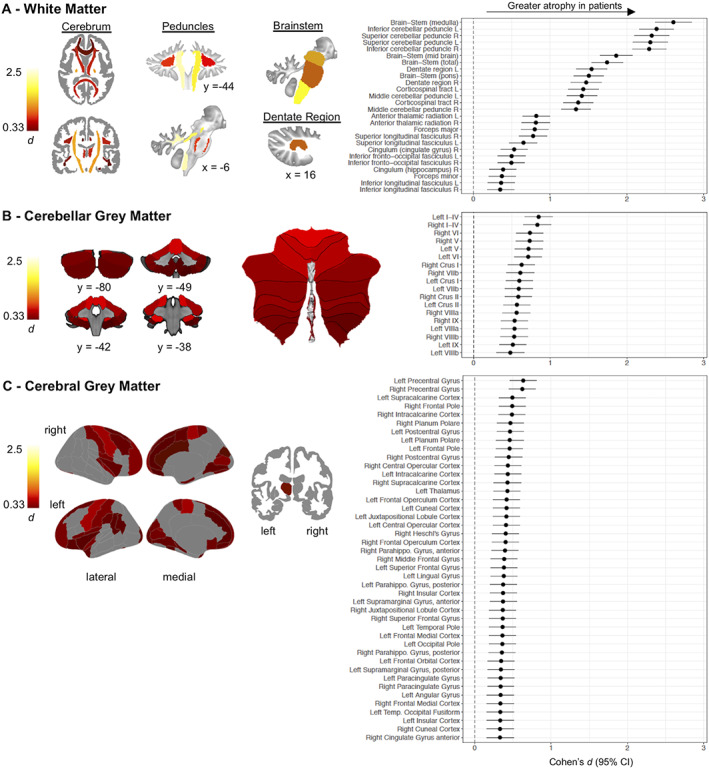
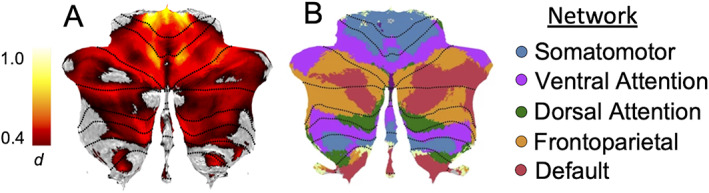
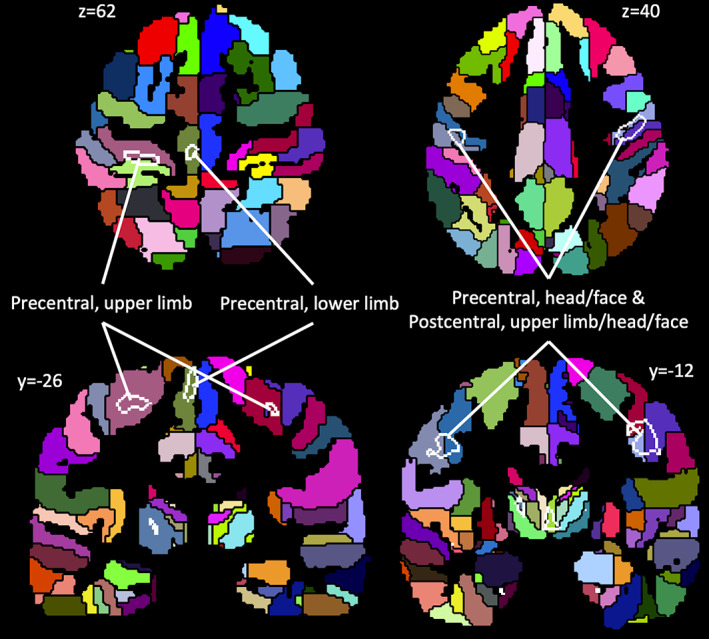
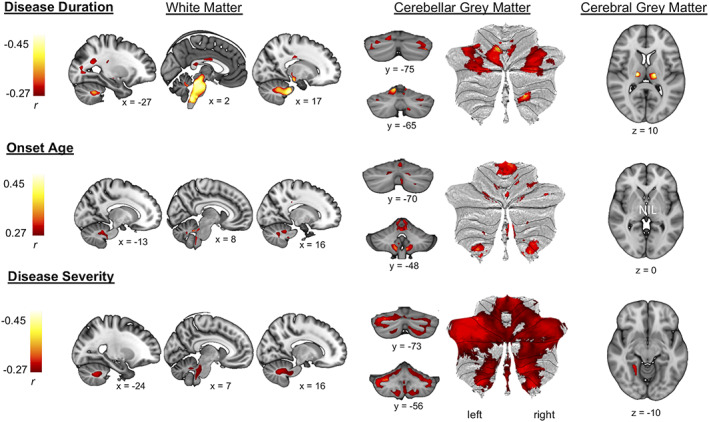
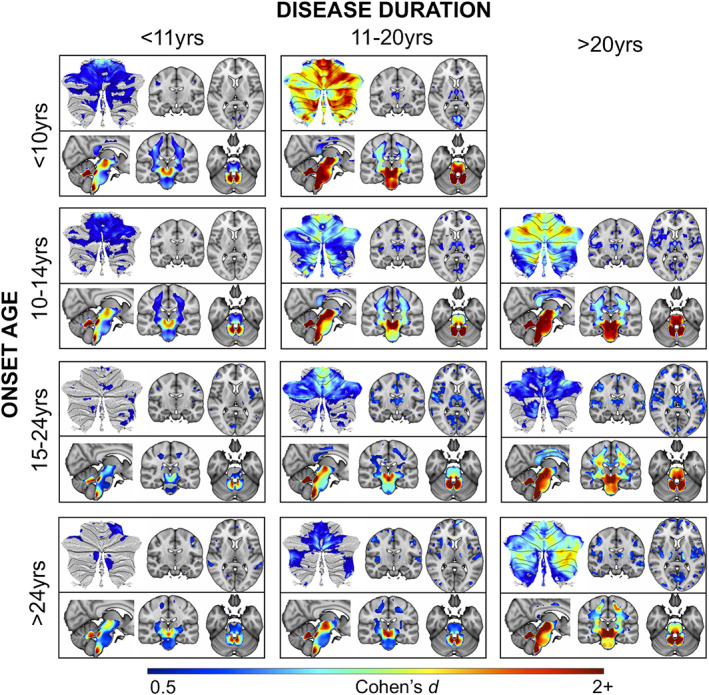
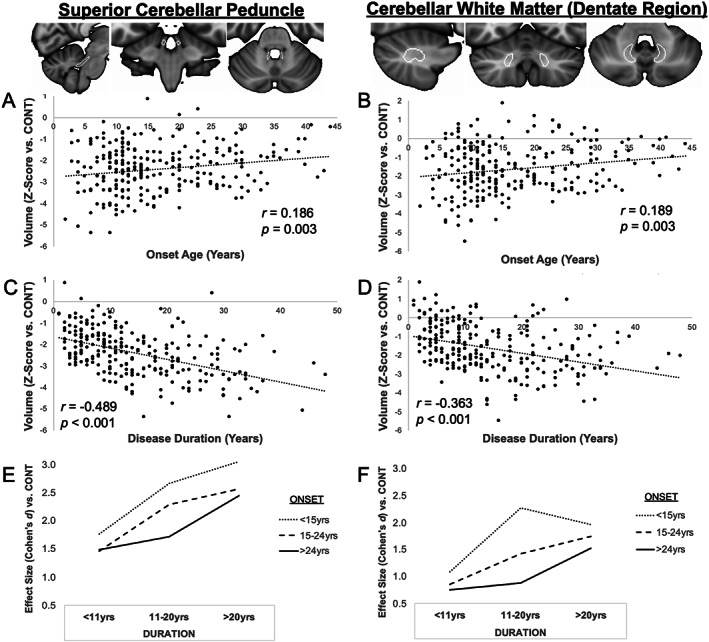
Results: The brainstem, dentate nucleus region, and superior and inferior cerebellar peduncles showed the greatest reductions in volume relative to controls (Cohen d = 1.5-2.6). Cerebellar gray matter alterations were most pronounced in lobules I-VI (d = 0.8), whereas cerebral differences occurred most prominently in precentral gyri (d = 0.6) and corticospinal tracts (d = 1.4). Earlier onset age predicted less volume in the motor cerebellum (rmax = 0.35) and peduncles (rmax = 0.36). Disease duration and severity correlated with volume deficits in the dentate nucleus region, brainstem, and superior/inferior cerebellar peduncles (rmax = -0.49); subgrouping showed these to be robust and early features of FRDA, and strong candidates for further biomarker validation. Cerebral white matter abnormalities, particularly in corticospinal pathways, emerge as intermediate disease features. Cerebellar and cerebral gray matter loss, principally targeting motor and sensory systems, preferentially manifests later in the disease course.

Interpretation: FRDA is defined by an evolving spatial profile of neuroanatomical changes beyond primary pathology in the cerebellum and spinal cord, in line with its progressive clinical course. The design, interpretation, and generalization of research studies and clinical trials must consider neuroanatomical staging and associated interindividual variability in brain measures. ANN NEUROL 2021;90:570-583.


Conflict of interest statement

Nothing to report.

Figures

FIGURE 1
FIGURE 1
Atlas‐based effect size (Cohen d) maps and forest plots (Cohen d ± 95% confidence interval [CI]) for individuals with Friedreich ataxia versus controls, statistically controlling for site, intracranial volume, sex, age, disease onset, and disease duration. Regions with p FWE < 0.05 are shown (see Supplementary Table S3 for full tabulation). (A) Cerebral white matter regions of interest (ROIs) were defined using the Johns Hopkins University white matter tractography atlas, and cerebellar white matter ROIs were defined using the van Baarsen cerebellar white matter atlas. (B) Cerebellar gray matter ROIs were defined using the Spatially Unbiased Infratentorial Toolbox cerebellar atlas. (C) Cerebral gray matter ROIs were defined using the Harvard–Oxford cortical and subcortical atlases. Slice coordinates are in Montreal Neurological Institute space. [Color figure can be viewed at www.annalsofneurology.org]
FIGURE 2
FIGURE 2
Voxel‐level effect size (Cohen d) maps of individuals with Friedreich ataxia versus controls, statistically controlling for site, intracranial volume, sex, age, disease onset, and disease duration. Only voxels that survive voxelwise p FWE < 0.05 are displayed. Forest plots of mean effect size within these regions (Cohen d ± 95% confidence interval [CI]) for each site are given on the right, and the size of the point estimate is proportional to the sample size of the site (Supplementary Table S4). (A) White matter (cerebral and cerebellar). (B) Cerebellar gray matter. (C) Cerebral gray matter. The primary motor cortex (precentral gyri) is depicted on the superior surface. Slice coordinates are in Montreal Neurological Institute space. [Color figure can be viewed at www.annalsofneurology.org]
FIGURE 3
FIGURE 3
Network mapping of between‐group changes in the cerebellar cortex (Spatially Unbiased Infratentorial Toolbox template). Peak anatomical changes are localized to the somatomotor network, with hot spots also evident in the ventral attention network. (A) The effect size map is rescaled from Fig 2B to more easily depict the spatial pattern of cerebellar effects. (B) The network parcellation is reproduced from Buckner et al 2011. See Supplementary Table S5 for quantification. [Color figure can be viewed at www.annalsofneurology.org]
FIGURE 4
FIGURE 4
Volume decreases in the primary motor and somatosensory cortices (Fig 2C) are further disambiguated using a finer parcellation of the cortex provided by the Brainnetome Atlas. Areas of significant volume loss are shown by white outlines, and labeled according to the atlas. This depiction implicates principal involvement of limb and head regions. [Color figure can be viewed at www.annalsofneurology.org]
FIGURE 5
FIGURE 5
Voxel‐level correlation maps (partial r) between tissue volume and disease duration (negative), age at disease onset (positive), and disease severity (negative) for patients with Friedreich ataxia. Only voxels that survive voxel‐level p FWE < 0.05 are depicted. Disease duration correlations were computed using voxel‐level regression while adjusting the model for disease onset age, current age, site, and intracranial volume (ICV). Disease onset correlations were also computed using voxel‐level regression while adjusting the model for disease duration, age, site, and ICV. For correlations with disease severity, voxel‐based meta‐analysis was employed to account for the use of different clinical scales across sites. See Supplementary Table S6 for full tabulation. Slice coordinates are in Montreal Neurological Institute space. [Color figure can be viewed at www.annalsofneurology.org]
FIGURE 6
FIGURE 6
Subgroup effect size maps (Cohen d > 0.5) relative to the full control cohort (adjusted for age and site), demonstrating disease staging and the moderating role of onset age on brain structure. For each subgroup, gray matter effects are displayed on top (cerebellum flat map and representative cerebrum coronal and axial slices), and white matter effects on the bottom (representative sagittal, coronal, and axial slices). There are no data presented in the top right quadrant due to insufficient data in this subcohort. See Supplementary Table S7 for subgroup sizes and demographics. [Color figure can be viewed at www.annalsofneurology.org]
FIGURE 7
FIGURE 7
Data plots for the bilateral superior cerebellar peduncles (van Baarsen atlas) and cerebellar dentate region (dentate nucleus mask from the Spatially Unbiased Infratentorial Toolbox atlas) in the Friedreich ataxia (FRDA) cohort (age and site adjusted, and z‐normalized to the control (CONT) data distribution [(meanFRDA – meanCONT) / std_deviationCONT]). These regions represent the strongest between‐group differences relative to controls, with significant correlations with both disease onset age and disease duration, and map onto the primary pathology of FRDA. (A–D) Scatterplots depict linear relationships between volume and each of disease onset age (A, B) and disease duration (C, D); compare to Fig 5. (E,F) Line graphs illustrate effect size estimates across the 9 subgroups; compare to Fig 6).

References

    1. Ruano L, Melo C, Silva MC, Coutinho P. The global epidemiology of hereditary ataxia and spastic paraplegia: a systematic review of prevalence studies. Neuroepidemiology 2014;42:174–183. - PubMed
    1. Delatycki MB, Bidichandani SI. Friedreich ataxia—pathogenesis and implications for therapies. Neurobiol Dis 2019;132:104606. - PubMed
    1. Reetz K, Dogan I, Costa AS, et al. Biological and clinical characteristics of the European Friedreich's Ataxia Consortium for Translational Studies (EFACTS) cohort: a cross‐sectional analysis of baseline data. Lancet Neurol 2015;14:174–182. - PubMed
    1. Koeppen AH, Mazurkiewicz JE. Friedreich ataxia: neuropathology revised. J Neuropathol Exp Neurol 2013;72:78–90. - PMC - PubMed
    1. Harding IH, Lynch DR, Koeppen AH, Pandolfo M. Central nervous system therapeutic targets in Friedreich ataxia. Hum Gene Ther 2020;31:1226–1236. - PMC - PubMed

Publication types