Review
. 2021 Jul 28;8(8):108.
doi: 10.3390/bioengineering8080108.

Stem Cell Niche Microenvironment: Review

Affiliations
Review

Stem Cell Niche Microenvironment: Review

Mohamed Abdul-Al et al. Bioengineering (Basel). .

Abstract

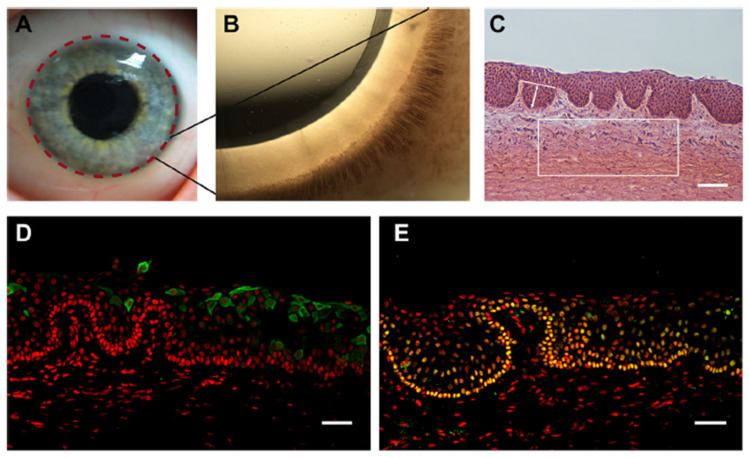
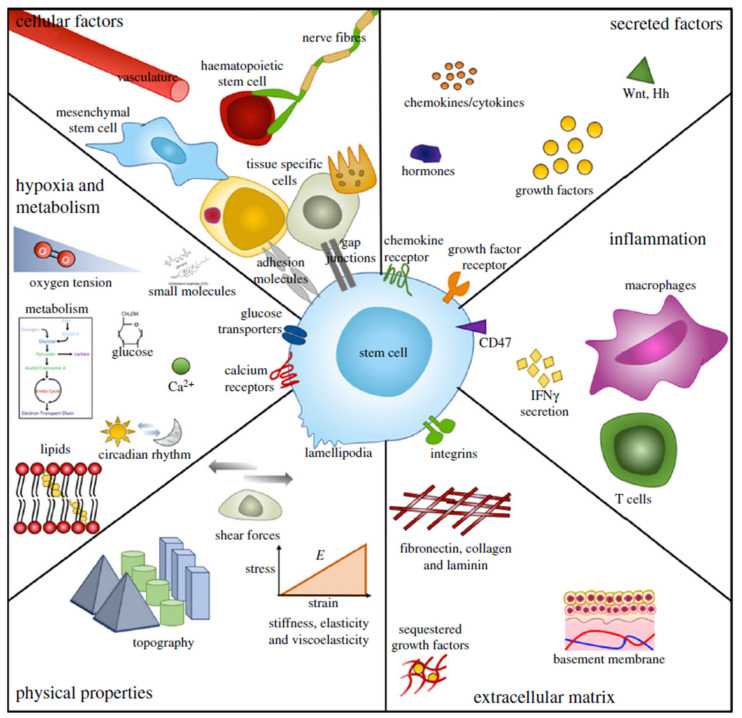
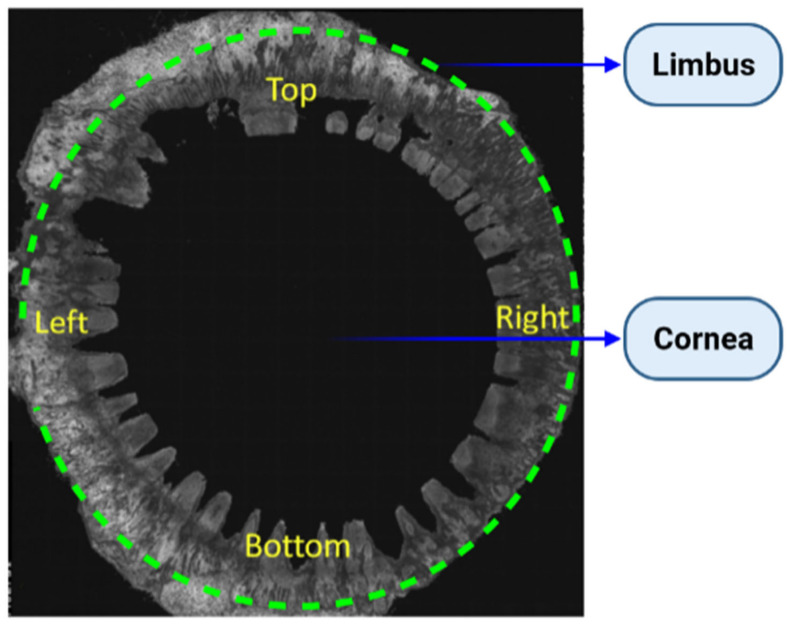
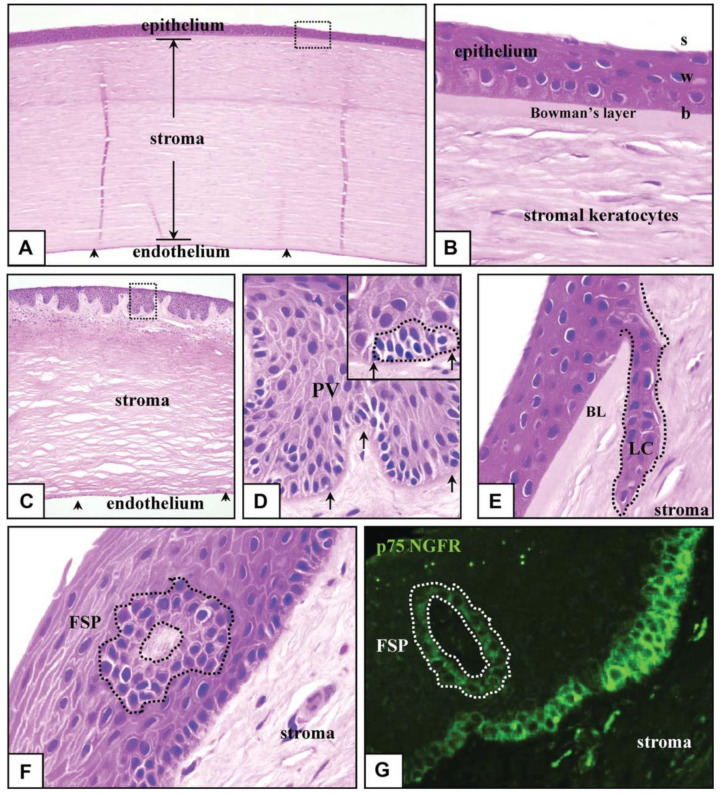
The cornea comprises a pool of self-regenerating epithelial cells that are crucial to preserving clarity and visibility. Limbal epithelial stem cells (LESCs), which live in a specialized stem cell niche (SCN), are crucial for the survival of the human corneal epithelium. They live at the bottom of the limbal crypts, in a physically enclosed microenvironment with a number of neighboring niche cells. Scientists also simplified features of these diverse microenvironments for more analysis in situ by designing and recreating features of different SCNs. Recent methods for regenerating the corneal epithelium after serious trauma, including burns and allergic assaults, focus mainly on regenerating the LESCs. Mesenchymal stem cells, which can transform into self-renewing and skeletal tissues, hold immense interest for tissue engineering and innovative medicinal exploration. This review summarizes all types of LESCs, identity and location of the human epithelial stem cells (HESCs), reconstruction of LSCN and artificial stem cells for self-renewal.

Keywords: cornea; microenvironment; niches; stem cell.


Conflict of interest statement

The authors declare no conflict of interest.

Figures

Figure 3
Figure 3
The human limbal stem cell niche. (A) Describes the location of the limbus with dashed lines on the human ocular surface. (B) Shows a highly pigmented Palisades of Vogt that is visible in the limbus of human. (C) Indicates H and E-stained tangential section of the human limbus, showing the LCs (limbal crypts). The box indicates a representative area of 0.1 mm2 of the limbal stroma. The white line indicates an example of LC width measurements and arrowed line LC depth measurements. (D) CK3- and (E) p63a (green)-stained cryosections of human LCs counterstained with PI (red). Scale bars C: 100 µm, D and E: 50 µm [39].
Figure 9
Figure 9
Characteristics of SCs and their niches. Niches are multi-factorial and dynamic microenvironments that are distinct and exclusive to function, but many of their primary parameters are shared. Physical and complex influences, including cell–cell interactions and heterologous cellular functions, secreted and soluble or membrane bound factors, immunological activity and reaction, ECM protein elements and properties, physical architectural parameters, oxygen stress and metabolic regulation, are all included [196].
Figure 1
Figure 1
The morphology of the human limbal region for the entire eye. Entire 360° corneoscleral rim, where corneal button has been removed for keratoplasty. Image captured by OCT [6].
Figure 2
Figure 2
Human corneo-limbus pathologic characteristics. Entire human eye sections were segmented, stained with eosin and hematoxylin (AF), as well as for the low-affinity NGFR (p75) (G), and visualized using normal (AF) or fluorescence (G) microscopy. The middle cornea is made up of a multilayered epithelium of squames (s), basal (b) and wing (w) layers, a keratocyte including a monolayer and stroma with complex endothelial cells (A,C, arrowheads). BL separates the corneal epithelium from the stroma (B). The limbus is distinguished by the PV (C,D), which contains bundles of small stem-like cells (D; inset, hatched line). LC (E, hatched line) and FSP are two other newly discovered stem cell-harboring structures (F,G, hatched lines). The limbal membrane is shown by the arrows in (D). The boxed region in (C) is magnified (D). Apart from (A,C) (100), and (G) (400), all pictures were taken with an optical microscope using oil (1000). BL stands for Bowman’s layer, FSP stands for focusing on PV stands, stromal projections, LC stands for limbal crypt and NGFR stands for nerve growth factor receptor for Palisades of Vogt.
Figure 4
Figure 4
Controlling MSC adhesion for osteogenesis and self-renewal by topography. (a) Self-renewing MSCs bind weakly compared to osteo-committed cells, leading to a reduction of integrin-mediated signaling via focal adhesion kinase (FAK), while retaining levels of extracellular signal-regulated kinase (ERK1/2) to promote growth but not separation. (b) MSCs inducing osteogenesis need greater adhesions: enhanced FAK activation raises ERK1/2 activation to lineage commitment levels, raising intracellular stress, activating Runt-related transcription factor 2 (RUNX2), a central regulator of osteogenesis, although subsequently inactivating adipogenic controller peroxisome proliferator-activated receptor gamma (PPAR-y). Fluorescent photographs display a significant improvement in adhesion length on near square (NSQ) surfaces relative to square (SQ). Adjusted from the source [92].
Figure 5
Figure 5
Interspecies variation in limbal morphology: human, pig and mouse. En face FFOCM (full-field optical coherence microscopy) pictures of (A) human, (B) pig and (C) mouse limbus, with inset diagrams of geometry of crypt formation about 360° of the eye. FFOCM pictures are oriented with the sclera on top and the cornea on the right. Photos have been measured to represent an identical area of every cornea (though differently sized due to different eye sizes) [6].
Figure 6
Figure 6
Production of BLC-containing RAFT constructs using RHPAs. (A) Shows a schematic of the RAFT process using RHPAs which are placed on top of a collagen hydrogel in a 24-well plate and incubated for 15 min. This will allow wicking of liquid from the hydrogel. RHPAs are then removed, and the RAFT construct remains at the bottom of the well. (B) Shows a schematic pattern of topography of micro-ridges on the base of RHPAs whiles. (C) Shows SEM images of a RAFT construct showing four different topologies on the same surface. (D) Shows the SEM images of the protruding micro-ridges of variable depth on the RHPA surface and corresponding BLCs produced in the surface of the RAFT constructs. Scale bars, C: 1 mm, D: 100 µm [39].
Figure 7
Figure 7
BLCs in RAFT constructs. (A) Shows a representation of an OCT image of an unfixed RAFT construct produced using an HPA. (B) Shows a representation of an OCT image of an unfixed RAFT construct produced using a RHPA. (C) Shows a representation of the H and E-stained section of a BLC on the surface of a RAFT construct. The white arrow shows width and the black arrow shows the depth measurements. Scale bars, C: 50 µm [39].
Figure 8
Figure 8
Cell-filled BLCs. (A) Shows an H and E-stained paraffin-embedded section of HCE-T cell-filled BLCs (black arrow) on RAFT construct. (B) Represents an orthogonal confocal image of HCE-T cells in BLCs stained with phalloidin (green) and DAPI (blue). Yellow line indicates Z-stack position on X-axis and blue line on Y-axis. (C) Shows an H and E-stained paraffin-embedded section of HLE cell-filled BLCs (black arrow) on the surface of HLF (white arrow) containing RAFT constructs. (D) Is a representation of an orthogonal confocal image of HLE cells in crypts (white stars) and HLF cells (white arrows) within the RAFT construct, both stained with phalloidin (green) and DAPI (blue). Yellow line indicates Z-stack position on X-axis and blue line on Y-axis. (E) Shows gallery view of a series of confocal Z-stack images showing HLE cell-filled BLCs and HLF cells within the RAFT construct stained with p63a (red), phalloidin (green) and DAPI (blue), with the depth from the epithelial surface indicated in mm. (F) Shows the confocal line scan image of the HLE cell-filled BLCs stained with p63a (red), phalloidin (green) and DAPI (blue). Scale bars: A, C: 50 µm, B, G–I: 100 µm, D: 200 µm, E: 40 µm, F: 20 µm [39].
Figure 10
Figure 10
Phase contrast microscopy and scanning electron microscopy were used to investigate the structure of the PEGDA rings. (A) Describes the optical micrographs of the PEGDA outer ring with horseshoe morphology. (B) Describes the circular morphology of the micrographs of PEGDA. (C) Describes a SEM micrography of the PEGDA outer ring with horseshoe niches. (D) Shows a PEGDA outer ring of diameter 1.2 cm with well-defined artificial micro-pockets of diameter around 300 µm [206].
Figure 11
Figure 11
(A) Shows a washed sample of the SEM images of cells in the short term. (B) Shows a washed sample of the SEM images of cells in the long term. (C) Shows an SEM high-magnification image of well-attached RLF on PEGDA surface [206].

References

    1. Notara M., Alatza A., Gilfillan J., Harris A., Levis H., Schrader S., Vernon A., Daniels J. In sickness and in health: Corneal epithelial stem cell biology, pathology and therapy. Exp. Eye Res. 2010;90:188–195. doi: 10.1016/j.exer.2009.09.023. - DOI - PubMed
    1. Notara M., Shortt A., Galatowicz G., Calder V., Daniels J.T. IL6 and the human limbal stem cell niche: A mediator of epithelial–stromal interaction. Stem Cell Res. 2010;5:188–200. doi: 10.1016/j.scr.2010.07.002. - DOI - PubMed
    1. Daniels J.T., Dart J.K.G., Tuft S.J., Khaw P.T. Corneal stem cells in review. Wound Repair. Regen. 2001;9:483–494. doi: 10.1046/j.1524-475x.2001.00483.x. - DOI - PubMed
    1. Xuan M., Wang S., Liu X., He Y., Li Y., Zhang Y. Proteins of the corneal stroma: Importance in visual function. Cell Tissue Res. 2016;364:9–16. doi: 10.1007/s00441-016-2372-3. - DOI - PubMed
    1. DelMonte D.W., Kim T. Anatomy and physiology of the cornea. J. Cataract. Refract. Surg. 2011;37:588–598. doi: 10.1016/j.jcrs.2010.12.037. - DOI - PubMed

LinkOut - more resources