. 2021 Jul 26;11(8):480.
doi: 10.3390/metabo11080480.

Metformin Decreases 2-HG Production through the MYC-PHGDH Pathway in Suppressing Breast Cancer Cell Proliferation

Affiliations

Metformin Decreases 2-HG Production through the MYC-PHGDH Pathway in Suppressing Breast Cancer Cell Proliferation

Sehyun Oh et al. Metabolites. .

Abstract

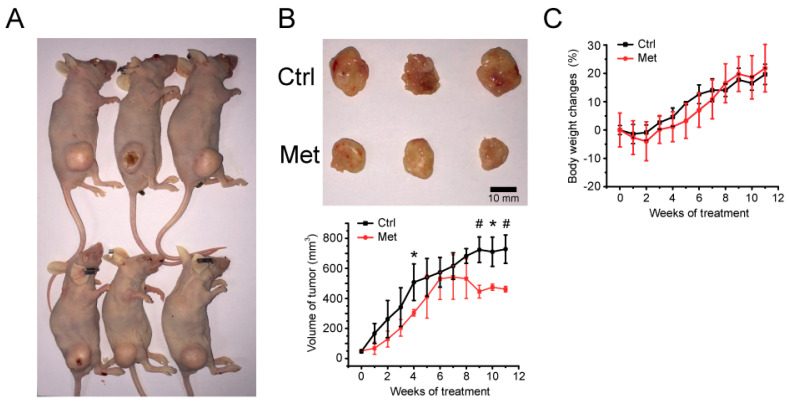
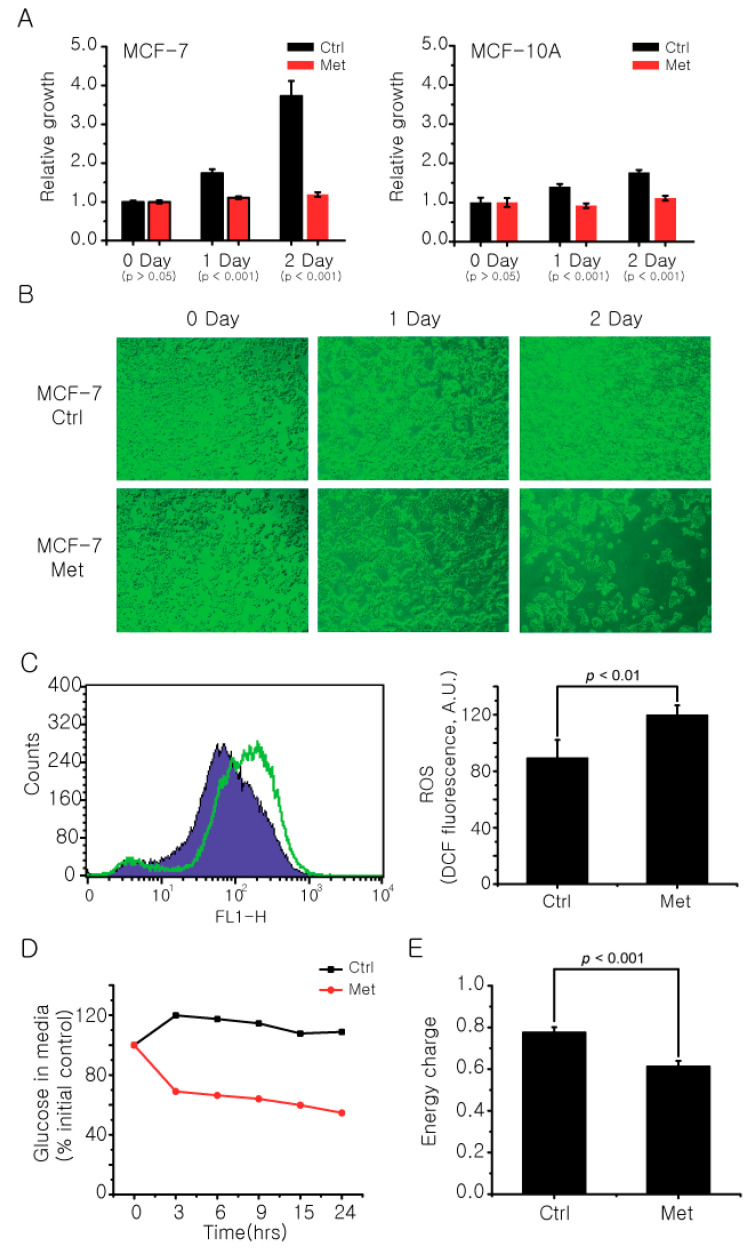
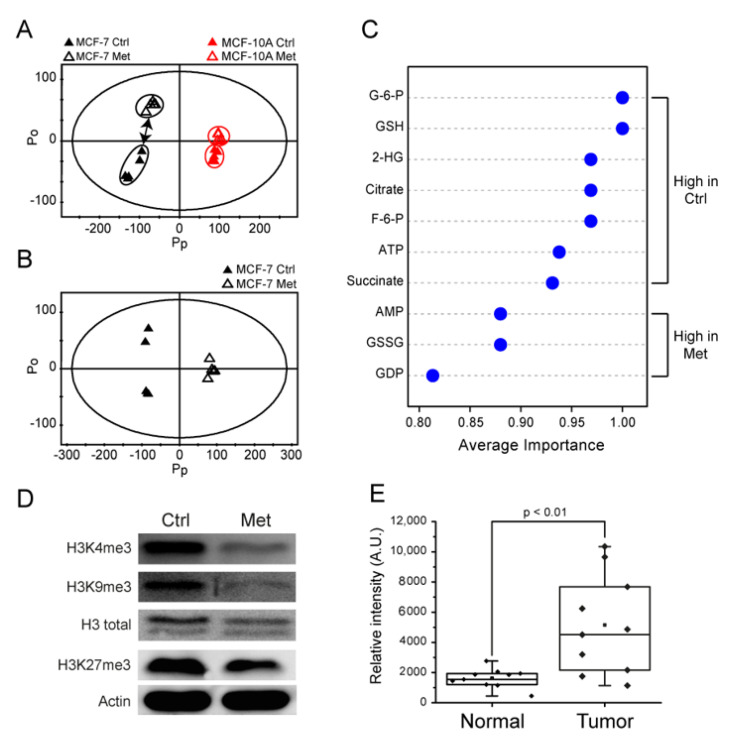
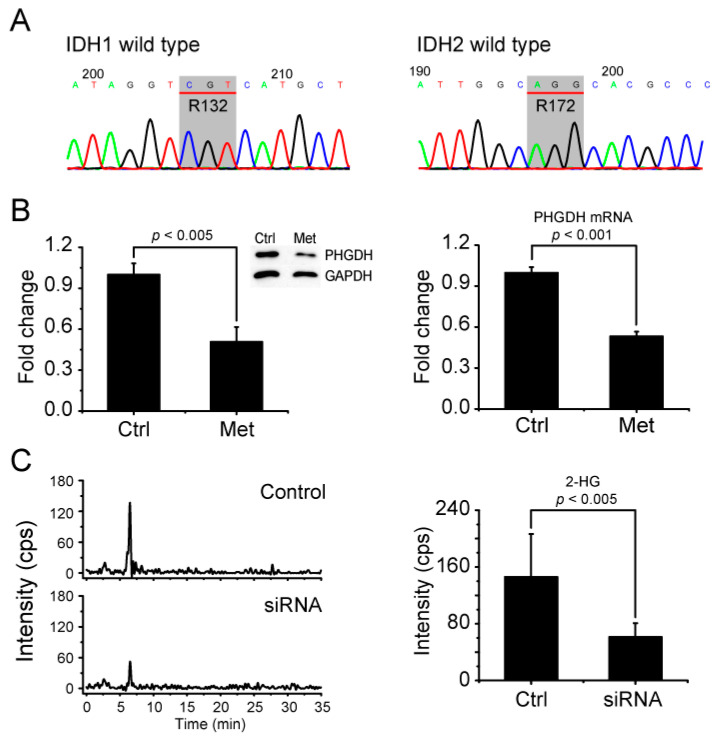
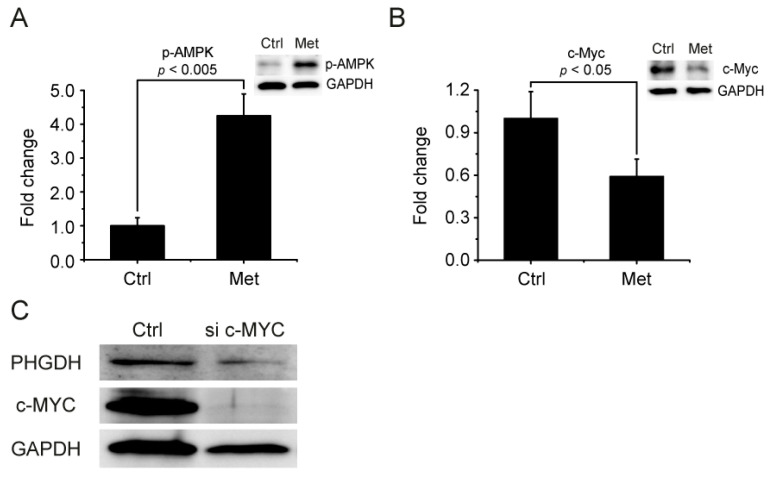
The biguanide drug metformin has been widely used for the treatment of type 2 diabetes, and there is evidence supporting the anticancer effect of metformin despite some controversy. Here, we report the growth inhibitory activity of metformin in the breast cancer (MCF-7) cells, both in vitro and in vivo, and the associated metabolic changes. In particular, a decrease in a well-known oncometabolite 2-hydroxyglutarate (2-HG) was discovered by a metabolomics approach. The decrease in 2-HG by metformin was accompanied by the reduction in histone methylation, consistent with the known tumorigenic mechanism of 2-HG. The relevance of 2-HG inhibition in breast cancer was also supported by a higher level of 2-HG in human breast cancer tissues. Genetic knockdown of PHGDH identified the PHGDH pathway as the producer of 2-HG in the MCF-7 cells that do not carry isocitrate dehydrogenase 1 and 2 (IDH1/IDH2) mutations, the conventional producer of 2-HG. We also showed that metformin's inhibitory effect on the PHGDH-2HG axis may occur through the regulation of the AMPK-MYC pathway. Overall, our results provide an explanation for the coherent pathway from complex I inhibition to epigenetic changes for metformin's anticancer effect.

Keywords: 2-HG; PHGDH; anticancer effect; metabolomics; metformin.


Conflict of interest statement

The authors declare no conflict of interest.

Figures

Figure 1
Figure 1
Mouse xenograft model of MCF-7 cells and metformin’s relevance in vivo. (A) MCF-7 cells were implanted subcutaneously into the right flank of BALB/c nude mice. Upper: control; lower: metformin treated. (B) The effect of 300 mg/Kg metformin daily administration on the growth of MCF-7 xenograft tumors. The upper panel shows sample tumors from 11 weeks post-metformin administration. The tumor size was measured once a week, and the average tumor tissue volume is represented in the lower panel with the mean ± standard deviations (n = 3). (C) Mouse body weight changes were determined every week after metformin administration. *, # statistically significant difference in tumor size. *: p < 0.05, #: p < 0.01.
Figure 2
Figure 2
Metformin affects cancer cell growth and metabolic phenotypes. The final concentration of 20 mM metformin was treated to MCF-7 and MCF-10A cells for 2 days and the cell viability at each day was measured by a standard MTT assay (A) and microscope (B). (C) The change in ROS levels in MCF-7 cells after metformin treatment was measured using a fluorescent dye DCFH-DA. (D) The difference in glucose uptake by metformin treatment was compared by measuring glucose level in MCF-7 cell culture media using an NMR spectrometer. The relative amounts were normalized against the 0 h point. (E) The change in energy charge of MCF-7 cells after metformin treatment was calculated with absolute concentrations of AMP, ADP, and ATP measured with LC/MS using the following equation: ([ATP] + 0.5 [ADP])/([ATP] + [ADP] + [AMP]). Ctrl: control group; Met: Metformin treated group. The data are from three independent experiments. The error bars represent the standard deviation.
Figure 3
Figure 3
Multivariate analysis on metabolomic changes, histone methylation status by metformin treatment in MCF-7 cells, and the 2-HG level in breast cancer tissues from patients. (A,B) NMR metabolomic changes by metformin treatment were analyzed by multivariate analysis. Black symbols: MCF-7; red symbols: MCF-10A; filled symbols: Control (Ctrl) group; open symbols: Metformin (Met) treated group. (A) Principal component analysis (PCA) on metformin-treated and control groups for MCF10a and MCF7 cells. (B) Orthogonal projections to latent structure-discriminant analysis (OPLS-DA) for control and metformin-treated MCF-7 cells. (C) Multiple ROC curve analysis for the significance of contributing metabolites using the quantitative LC/MS analysis. (D) The changes in the histone methylation status of MCF-7 cells were measured by Western blot using H3K4me3, H3K9me3, and H3K27me3 antibodies after metformin treatment. The data are representative of three independent experiments. (E) The 2-HG levels from paired normal (non-involved) and tumor tissues from breast cancer patients were measured by LC/MS (n = 10 for each group).
Figure 4
Figure 4
Metformin inhibits 2-HG production by PHGDH in MCF-7 cells without IDH mutations. (A) DNA sequencing against IDH1 R132 and IDH2 R172 residues was performed using genomic DNA from MCF-7 cells. Codons for IDH1 R132 and IDH2 R172 are indicated in gray boxes as CGT and AGG encoding Arginine. (B) The PHGDH level after metformin treatment was measured for protein (left) and mRNA (right) by Western blot and real-time PCR, respectively. (C) The alteration of the 2-HG level by PHGDH siRNA was measured with LC/MS. The data are from five independent experiments. The error bars represent the standard deviation.
Figure 5
Figure 5
Metformin inhibits PHGDH through the AMPK-MYC pathway. (A) Changes in (A) p-AMPK and (B) c-MYC levels by metformin treatment were measured by Western blot. (C) The effect of c-MYC siRNA on PHGDH was estimated by Western blot.

References

    1. Rena G., Hardie D.G., Pearson E.R. The mechanisms of action of metformin. Diabetologia. 2017;60:1577–1585. doi: 10.1007/s00125-017-4342-z. - DOI - PMC - PubMed
    1. Sanchez-Rangel E., Inzucchi S.E. Metformin: Clinical use in type 2 diabetes. Diabetologia. 2017;60:1586–1593. doi: 10.1007/s00125-017-4336-x. - DOI - PubMed
    1. Diabetes Prevention Program Research Group Long-term safety, tolerability, and weight loss associated with metformin in the Diabetes Prevention Program Outcomes Study. Diabetes Care. 2012;35:731–737. - PMC - PubMed
    1. Chaudhury A., Duvoor C., Reddy Dendi V.S., Kraleti S., Chada A., Ravilla R., Marco A., Shekhawat N.S., Montales M.T., Kuriakose K., et al. Clinical Review of Antidiabetic Drugs: Implications for Type 2 Diabetes Mellitus Management. Front. Endocrinol. 2017;8:6. doi: 10.3389/fendo.2017.00006. - DOI - PMC - PubMed
    1. Madiraju A.K., Qiu Y., Perry R.J., Rahimi Y., Zhang X.M., Zhang D., Camporez J.G., Cline G.W., Butrico G.M., Kemp B.E., et al. Metformin inhibits gluconeogenesis via a redox-dependent mechanism in vivo. Nat. Med. 2018;24:1384–1394. doi: 10.1038/s41591-018-0125-4. - DOI - PMC - PubMed

LinkOut - more resources