. 2022 Apr;18(4):891-908.
doi: 10.1080/15548627.2021.1963155. Epub 2021 Aug 26.

USP19 (ubiquitin specific peptidase 19) promotes TBK1 (TANK-binding kinase 1) degradation via chaperone-mediated autophagy

Affiliations

USP19 (ubiquitin specific peptidase 19) promotes TBK1 (TANK-binding kinase 1) degradation via chaperone-mediated autophagy

Xibao Zhao et al. Autophagy. 2022 Apr.

Abstract

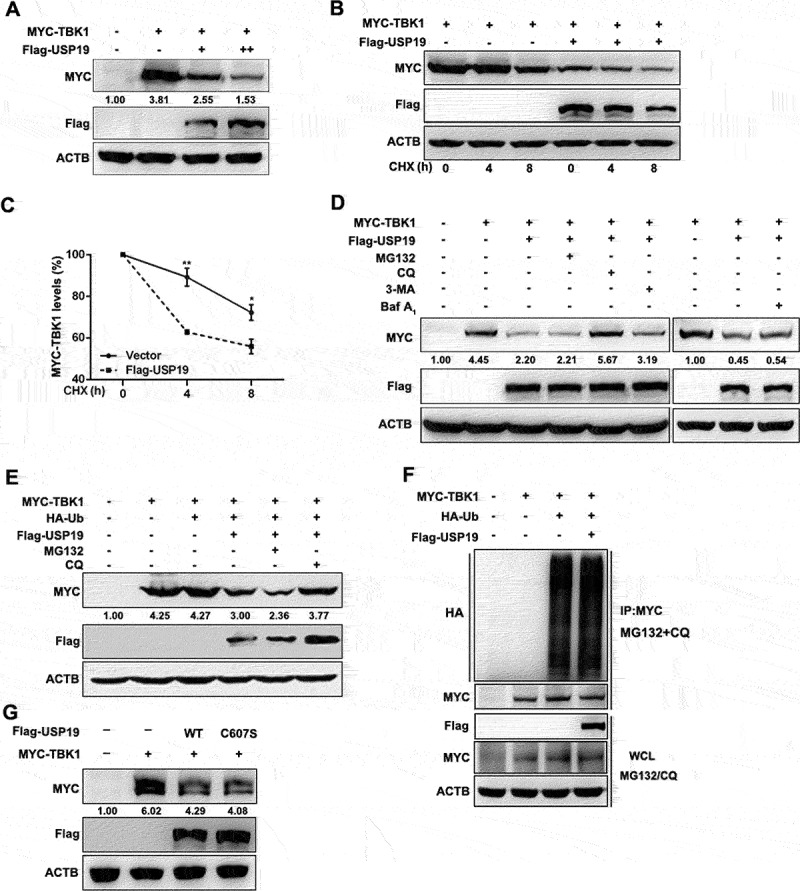
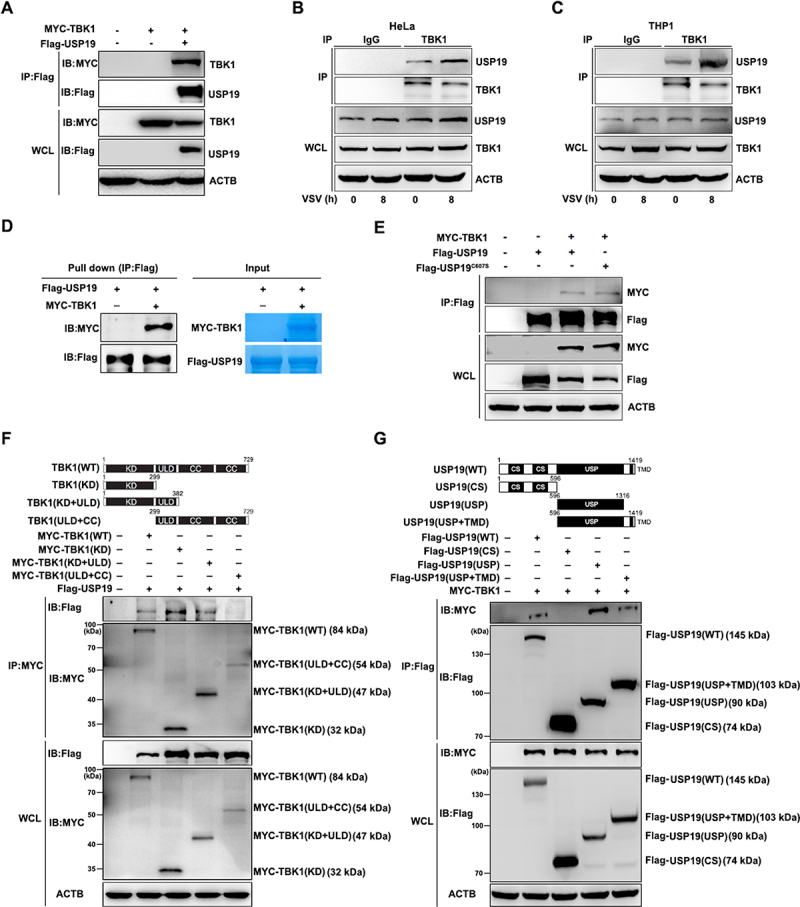
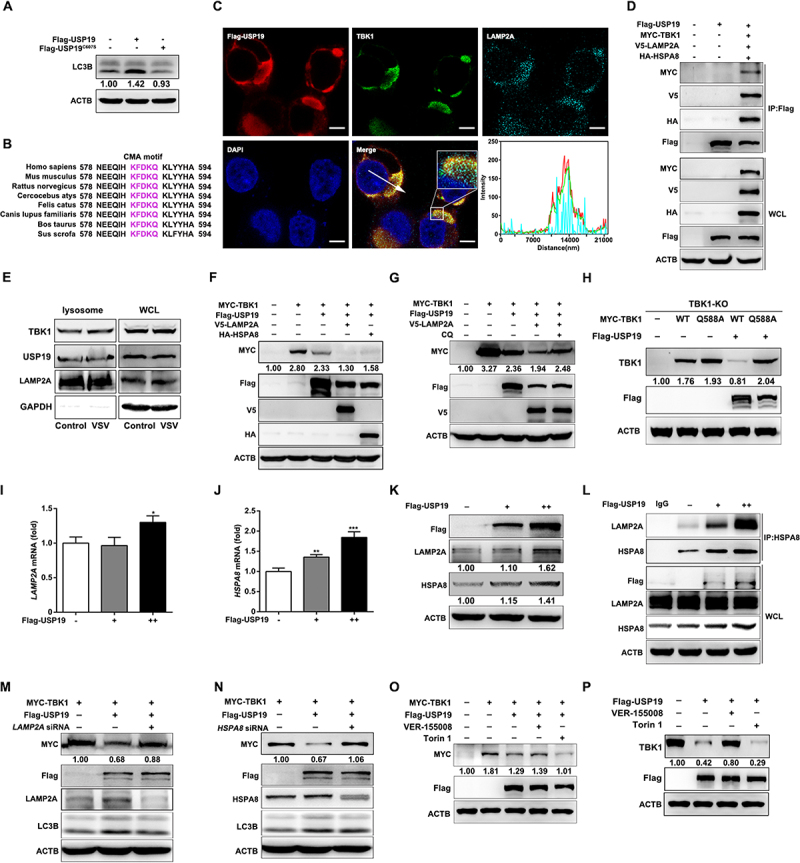
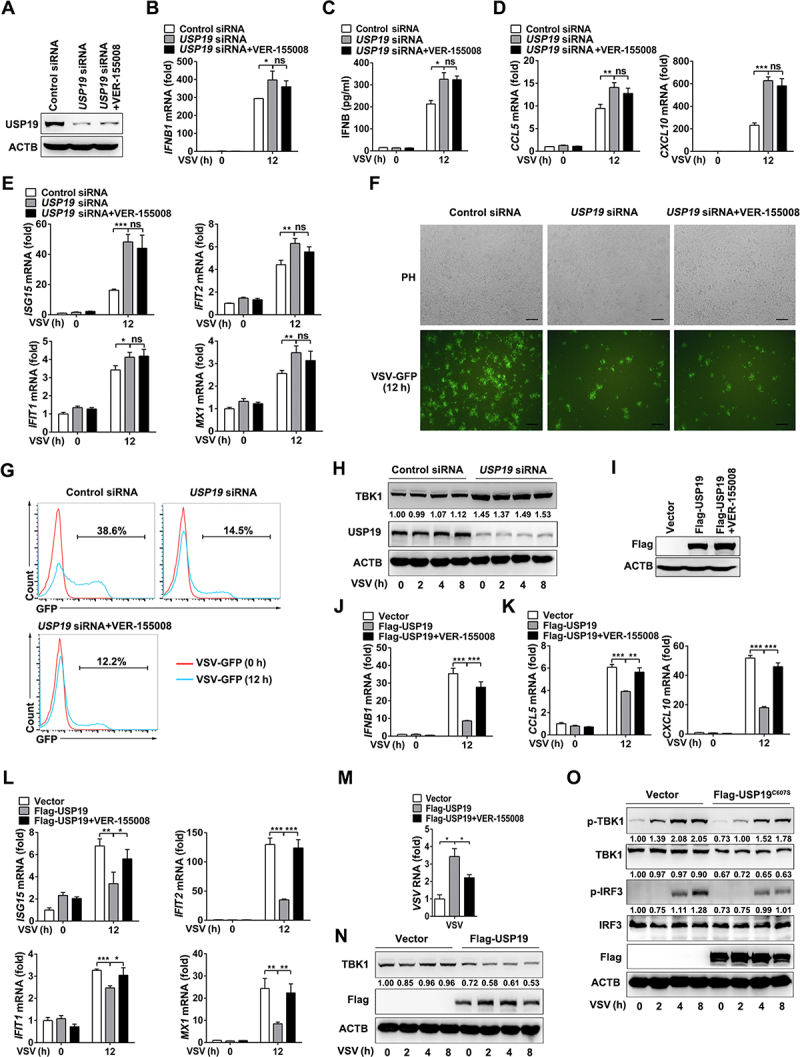
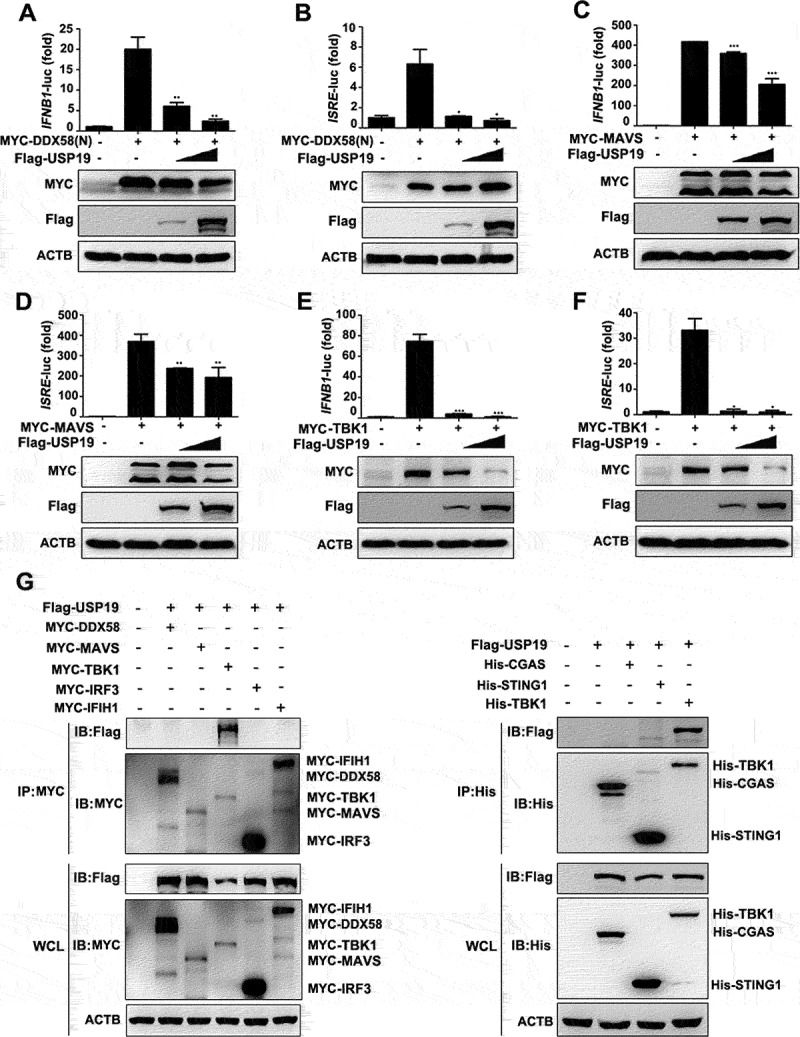
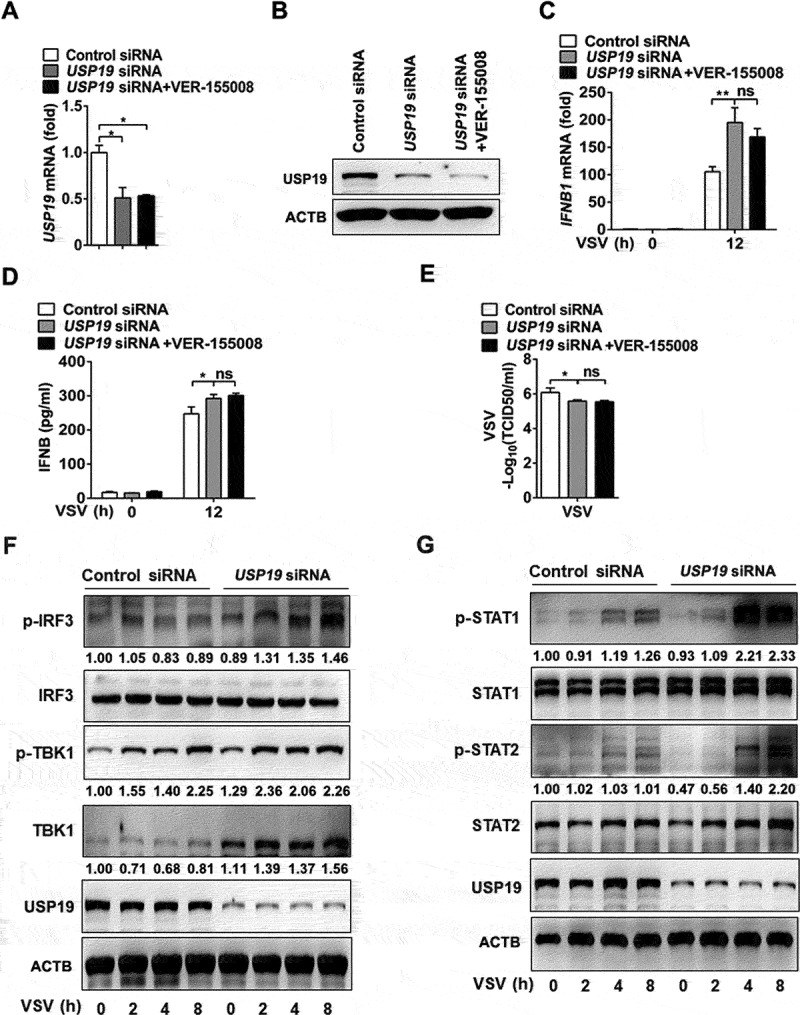
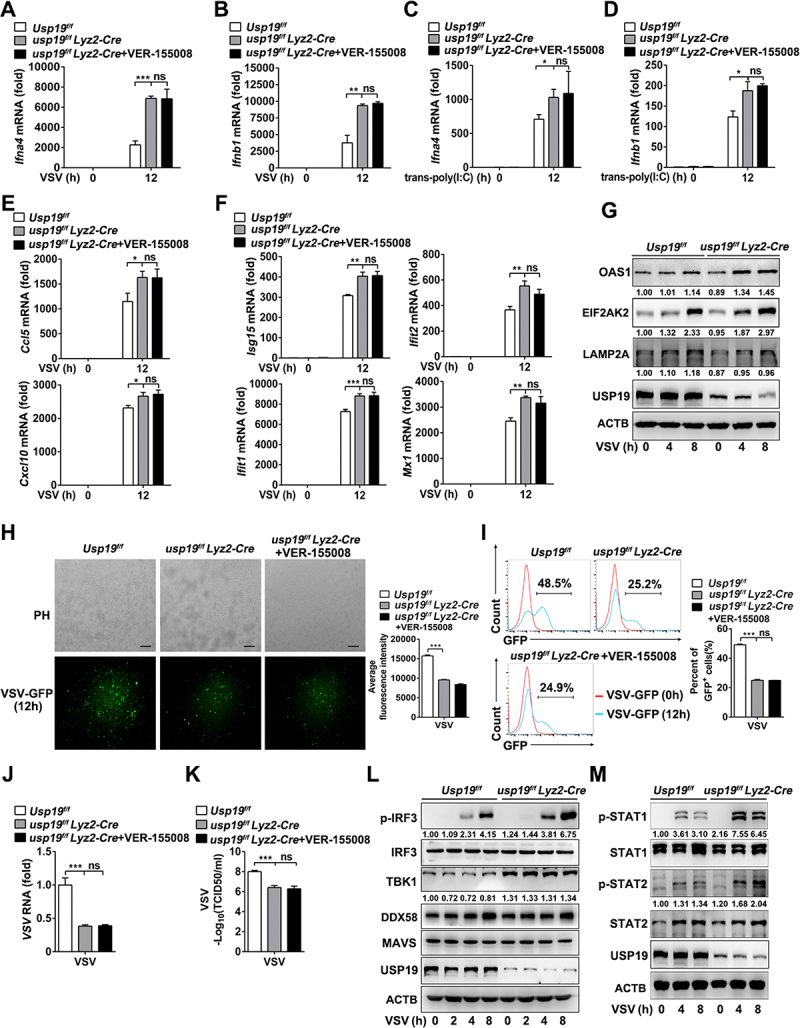
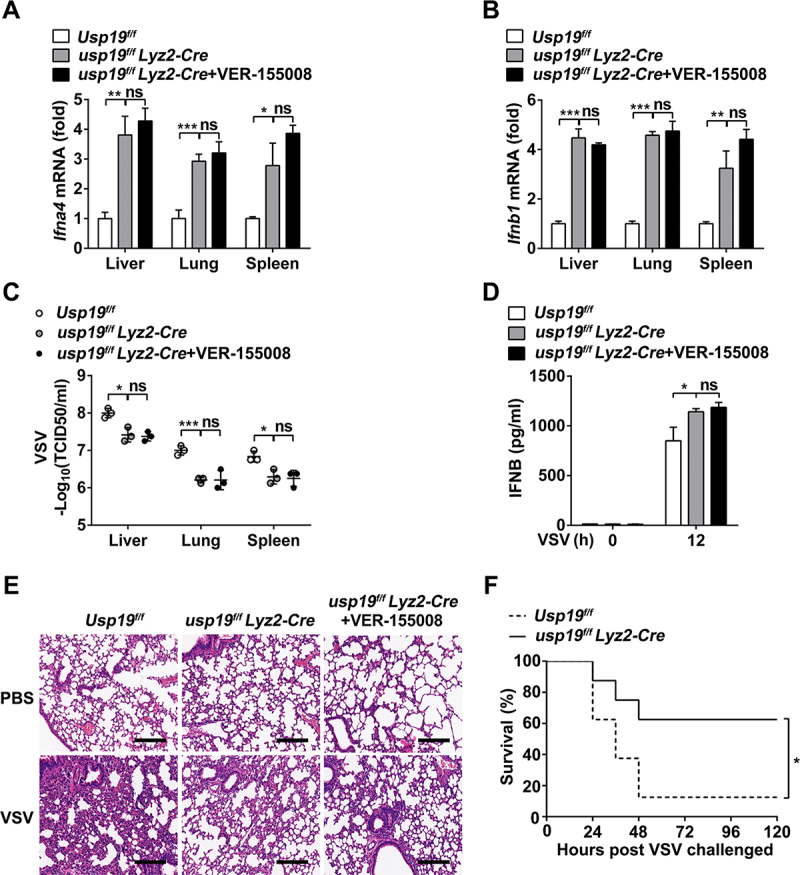
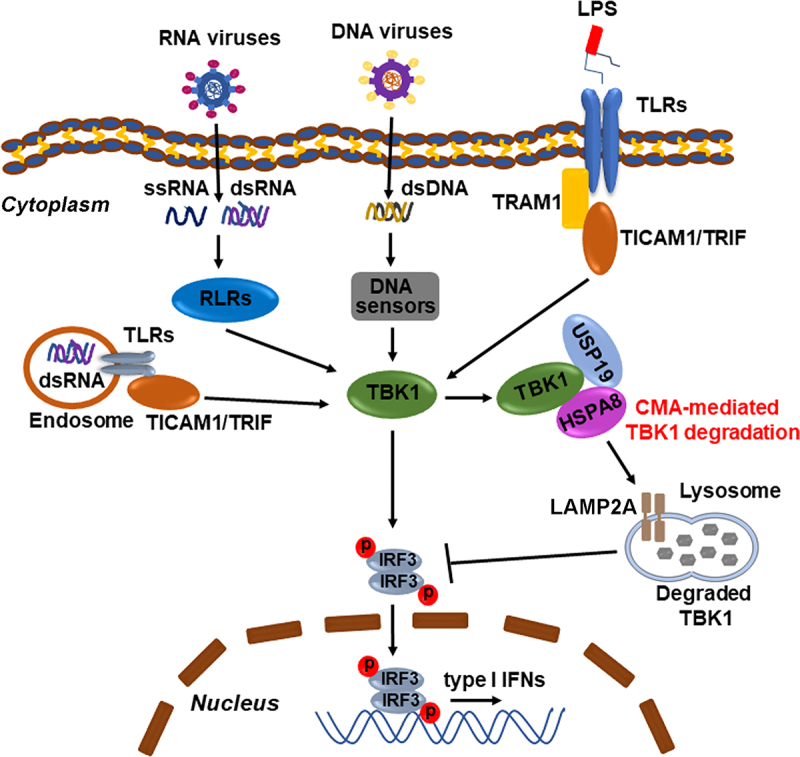
TBK1 (TANK-binding kinase 1) is an essential receptor protein required for the innate immune response, but the mechanisms underlying TBK1 stability, especially those regulated via autophagy, remain poorly understood. Here, we demonstrate that USP19 (ubiquitin specific peptidase 19) interacts with and promotes TBK1 lysosomal degradation via chaperone-mediated autophagy (CMA). We observed that TBK1 had a canonical CMA motif, knocking down key proteins involved in CMA (HSPA8/HSC70 or LAMP2A) or inhibiting CMA-prevented USP19-mediated TBK1 degradation. Furthermore, USP19 deficiency in macrophages caused an elevation of TBK1 and the activation of the type-I interferon signaling pathway after vesicular stomatitis virus (VSV) infection. Consistently, macrophage-specific usp19 knockout in mice resulted in attenuated VSV replication and resistance to VSV infection in vivo. Altogether, our results suggest that USP19 is a key regulator of TBK1 and uncovers a previously uncharacterized role for USP19 in CMA-mediated TBK1 degradation and infectious diseases.

Keywords: Antiviral immunity; autophagic degradation; hspa8/hsc70; lamp2a; type i interferon.


Conflict of interest statement

No potential conflict of interest was reported by the author(s).

Figures

Figure 1.
Figure 1.
USP19 promotes TBK1 degradation in a lysosome-dependent manner. (A) HEK293T cells were transfected with a MYC-TBK1 plasmid and increasing amounts of a Flag-USP19 expression plasmid and the extracted proteins were detected via immunoblotting. (B and C) HEK293T cells were transfected with MYC-TBK1 and Flag-USP19, then treated with CHX (100 μg/mL) for the indicated times after 24 h transfection. MYC-TBK1 protein levels were analyzed via immunoblotting (B). Myc-TBK1 expression was normalized to ACTB (C). (D and E) HEK293T cells were transfected with the indicated plasmids without (D) or with (E) a HA-Ub plasmid for 24 h, and then treated with MG132 (20 μM), CQ (50 μM), 3-MA (5 mM) or Baf-A1 (20 nM) for 6 h. The proteins were then detected via immunoblotting. (F) HEK293T cells were transfected with MYC-TBK1, HA-Ub, and Flag-USP19 plasmids for 24 h, then the cells were treated with MG132 (20 μM) and CQ (50 μM) for 6 h before harvest. The ubiquitination experiment was performed and the results were analyzed via immunoblotting. (G) HEK293T cells were transfected with MYC-TBK1, Flag-USP19, or Flag-USP19C607S plasmids, and the extracted proteins were detected via immunoblotting. The data are representative of three independent experiments. Error bars show the means ± SD. *p < 0.05, **p < 0.01 using the student’s t test.
Figure 2.
Figure 2.
USP19 interacts with TBK1. (A) HEK293T cells were transfected with MYC-TBK1 and Flag-USP19 plasmids, and then subjected to immunoprecipitation with a Flag antibody before immunoblot analysis. (B and C) HeLa (B) or THP1 cells (C) were infected with VSV for the indicated times, and then subjected to immunoprecipitation with a TBK1 antibody before immunoblot analysis of endogenous TBK1and USP19 protein levels. (D) HEK293T cells were transfected with MYC-TBK1 or Flag-USP19 plasmids, using immunoprecipitation to purify the proteins using Flag or MYC beads. The purified proteins, including Flag-usp19 and MYC-TBK1, were mixed in a Co-IP buffer to perform an in vitro pull-down assay and the results were analyzed via Coomassie Brilliant Blue staining and an immunoblot assay. (E) HEK293T cells were transfected with MYC-TBK1, Flag-USP19, or Flag-USP19C607S plasmids, and then subjected to immunoprecipitation with a Flag antibody before immunoblot analysis. (F) Schematic of TBK1 and the derivatives used (top). HEK293T cells were transfected with MYC-TBK1 (WT), MYC-TBK1 (KD), MYC-TBK1 (KD+ULD), MYC-TBK1 (ULD+CC), and Flag-USP19 plasmids, and then analyzed via immunoprecipitation and immunoblotting with the indicated antibodies (bottom). (G) Schematic of USP19 and the derivatives used (top). HEK293T cells were transfected with Flag-USP19 (WT), Flag-USP19 (CS), Flag-USP19 (USP), Flag-USP19 (USP+TMD), and MYC-TBK1, and then analyzed via immunoprecipitation and immunoblotting with the indicated antibodies (bottom). The data are representative of three independent experiments.
Figure 3.
Figure 3.
USP19 promotes TBK1 degradation through the CMA-dependent autophagy pathway. (A) HeLa cells were transfected with Flag-USP19 or Flag-USP19C607S plasmid and the LC3B levels were analyzed via immunoblotting. (B) Alignment of TBK1 orthologs. The pink shading indicates the conserved CMA motif. (C) HEK293T cells were transfected with MYC-TBK1 and Flag-USP19 plasmids for 24 h, labeled with the indicated antibodies, and analyzed via confocal microscopy. (D) HEK293T cells were transfected with MYC-TBK1, Flag-USP19, V5-LAMP2A, and HA-HSPA8 plasmids for 24 h, and then the lysates were immunoprecipitated with an anti-Flag antibody and analyzed via immunoblotting. (E) HeLa cells were infected with or without VSV, then the lysosomes were isolated and enriched before the proteins were analyzed via immunoblotting. (F) HeLa cells were transfected with MYC-TBK1, Flag-USP19, V5-LAMP2A, and HA-HSPA8 plasmids before analysis via immunoblotting with the indicated antibodies. (G) HeLa cells were transfected with MYC-TBK1, Flag-USP19, and V5-LAMP2A plasmids, and then treated with CQ (50 μM) before the proteins were analyzed via immunoblotting. (H) Tbk1-knockout Raw 264.7 cells were transfected with Flag-USP19, MYC-TBK1, or MYC-TBK1Q588A plasmids, and the indicated proteins were analyzed via immunoblotting. (I and J) HeLa cells were transfected with increasing amounts of Flag-USP19 plasmids for 24 h before qPCR analysis of LAMP2A (I) and HSPA8 (J) mRNA expression. (K) HeLa cells were transfected with increasing amounts of Flag-USP19 plasmids for 24 h before analysis of LAMP2A and HSPA8 protein levels via immunoblotting. (L) HeLa cells were transfected with increasing amounts of Flag-USP19 plasmids for 24 h, subjected to immunoprecipitation with an anti-HSPA8 antibody, and the results were analyzed via immunoblotting. (M and N) HeLa cells were transfected with gene-specific siRNA to knock down LAMP2A (M) or HSPA8 (N) mRNA expression, and were then transfected with MYC-TBK1 and Flag-USP19 plasmids. MYC-TBK1 protein levels were analyzed via immunoblotting. (O and P) HEK293T cells were transfected with a Flag-USP19 plasmid, with (O) or without (P) MYC-TBK1 plasmids, and then treated with VER-155,008 (5 μM) or Torin 1 (250 nM). MYC-TBK1 or endogenous TBK1 protein levels were analyzed via immunoblotting. Scale bars: 5 μm. The data are representative of three independent experiments. Error bars show the means ± SD. *p < 0.05, **p < 0.01, ***p < 0.001 using Student’s t test.
Figure 4.
Figure 4.
USP19 negatively regulates VSV-induced IFNB production and the antiviral response in THP1 cells. (A-G) THP1 cells were transfected with control or USP19 siRNA for 48 h, with or without pretreatment with VER-155,008 (5 μM) for 30 min, then USP19 protein levels were analyzed via immunoblotting (A). qPCR analysis of IFNB1 expression for the indicated times after VSV infection (MOI = 1) (B). ELISA analysis of IFNB production in the cell culture supernatants 12 h after VSV infection (C). qPCR analysis of CCL5 and CXCL10 expression 12 h after VSV infection (MOI = 1) (D). qPCR analysis of ISG15, IFIT2, IFIT1, and MX1 expression 12 h after VSV infection (MOI = 1) (E). THP-1 cells were infected with VSV-GFP (MOI = 1) for 12 h and the cells were imaged under a confocal microscope (F). The percentage of GFP+ cells was determined via flow cytometry (G). (H) THP1 cells were transfected with control or USP19 siRNA, and then infected with VSV. Immunoblotting was performed to analyze TBK1 protein levels. (I-M) THP1 cells were transfected with Flag-USP19 plasmids or an empty vector for 24 h, with or without pretreatment with VER-155,008 (5 μM) for 30 min. USP19 expression was analyzed via immunoblotting using a Flag antibody (I). qPCR analysis of IFNB1 (J), CCL5, CXCL10 (K), ISG15, IFIT2, IFIT1, and MX1 (L) expression and VSV replication (M) for the indicated times after VSV infection (MOI = 1). (N) THP1 cells were transfected with Flag-USP19 plasmids or an empty vector, and then infected with VSV. Immunoblotting was performed to analyze TBK1 protein levels. (O) THP1 cells were transfected with Flag-USP19C607S plasmids or an empty vector, and then infected with VSV. Immunoblotting was performed to analyze indicated proteins levels. The data are representative of three independent experiments. Scale bars: 100 μm. Error bars show the means ± SD. *p < 0.05, **p < 0.01, ***p < 0.001 using Student’s t test.
Figure 5.
Figure 5.
USP19 negatively regulates antiviral signaling by targeting TBK1. (A-F) HEK293T cells were transfected with different concentrations of USP19 plasmids and DDX58 (A and B), MAVS (C and D) or TBK1 (E and F) plasmids. Dual-luciferase reporter assays were performed 24 h after transfection. Exogenous USP19 protein levels were analyzed via immunoblotting. (G) HEK293T cells were transfected with MYC-DDX58, MYC-MAVS, MYC-TBK1, MYC-IRF3, MYC-IFIH1, His-CGAS, His-STING1, His-TBK1, and Flag-USP19 expression plasmids for 24 h before the lysates were subjected to immunoprecipitation with an anti-MYC or His antibody, and the results were analyzed via immunoblotting. The data are representative of three independent experiments. Error bars show the means ± SD. *p < 0.05, **p < 0.01, ***p < 0.001 using Student’s t test.
Figure 6.
Figure 6.
Knockdown of USP19 promotes cellular antiviral response in human PBMCs. (A-E) PBMCs were transfected with control or USP19 siRNAs for 48 h, with or without pretreatment with VER-155,008 (5 μM) for 30 min. USP19 expression was analyzed via qPCR (A) and immunoblotting (B). qPCR analysis of IFNB1 expression 12 h after VSV infection (MOI = 1) (C). ELISA analysis of IFNB production in PBMC supernatants 12 h after VSV infection (MOI = 1) (D). qPCR analysis of VSV replication 12 h after VSV infection (MOI = 1) (E). (F and G) PBMCs were transfected with control or USP19 siRNAs for 48 h, VSV infection (MOI = 1) was performed at the indicated times, and the indicated proteins were analyzed via immunoblotting. The data are representative of three independent experiments. Error bars show the means ± SD. *p < 0.05, **p < 0.01 using Student’s t test.
Figure 7.
Figure 7.
USP19 deficiency in macrophages enhanced VSV-induced type I interferon production and antiviral response by suppressing CMA-mediated TBK1 degradation. (A and B) qPCR analysis of Ifna4 (A) and Ifnb1 (B) expression in Usp19flox/flox and usp19flox/flox Lyz2-Cre peritoneal macrophages infected with VSV (MOI = 1) for the indicated times with or without VER-155,008 (5 μM) pretreatment. (C and D) qPCR analysis of Ifna4 (C) and Ifnb1 (D) expression in Usp19flox/flox and usp19flox/flox Lyz2-Cre peritoneal macrophages transfected with poly(I:C) (1 μg/mL) for the indicated hours with or without pretreatment with VER-155,008 (5 μM). (E and F) qPCR analysis of Ccl5, Cxcl10 (E), Isg15, Ifit2, Ifit1, and Mx1 expression (F) in Usp19flox/flox and usp19flox/flox Lyz2-Cre peritoneal macrophages infected with VSV (MOI = 1) for 12 h with or without pretreatment with VER-155,008 (5 μM). (G) Immunoblot analysis of OSA1, EIF2AK2, and LAMP2A expression in Usp19flox/flox and usp19flox/flox Lyz2-Cre peritoneal macrophages infected with VSV (MOI = 1) for the indicated durations. (H and I) Usp19flox/flox and usp19flox/flox Lyz2-Cre peritoneal macrophages were infected with VSV-GFP for 12 h with or without VER-155,008 (5 μM) pretreatment, and images were captured under a fluorescence microscope (H). The percentage of GFP+ cells was determined via flow cytometry (I). (J) qPCR analysis of VSV replication in Usp19flox/flox and usp19flox/flox Lyz2-Cre peritoneal macrophages infected with VSV (MOI = 1) with or without VER-155,008 (5 μM) pretreatment. (K) Determination of VSV titers in supernatants via a TCID50 assay of Usp19flox/flox and usp19flox/flox Lyz2-Cre peritoneal macrophages infected with VSV with or without VER-155,008 (5 μM) treatment. (L) Immunoblot analysis of the indicated proteins in Usp19flox/flox and usp19flox/flox Lyz2-Cre peritoneal macrophages infected with VSV (MOI = 1) for the indicated durations. (M) Immunoblot analysis of STAT1 and STAT2 phosphorylation in Usp19flox/flox and usp19flox/flox Lyz2-Cre peritoneal macrophages infected with VSV (MOI = 1) for the indicated hours. The data are representative of three independent experiments. Scale bars: 100 μm. Error bars show the means ± SD. *p < 0.05, **p < 0.01, ***p < 0.001 using Student’s t test.
Figure 8.
Figure 8.
USP19 macrophage-deficient mice show resistance to VSV infection. (A and B) qPCR analysis of Ifna4 (A) and Ifnb1 (B) mRNA expression in organs from Usp19flox/flox and usp19flox/flox Lyz2-Cre mice 12 h after VSV administration (1 × 108 PFU/g) via intraperitoneal injection (n = 3 per group) with or without VER-155,008 (40 mg/kg) treatment. (C) Determination of VSV loads in organs through the TCID50 assay using Usp19flox/flox and usp19flox/flox Lyz2-Cre mice (n = 3 per group). (D) ELISA analysis of IFNB production in sera from Usp19flox/flox and usp19flox/flox Lyz2-Cre mice (n = 3 per group). Error bars show means ± SD. *p < 0.05, **p < 0.01, ***p < 0.001 using Student’s t test. (E) Pathology of Usp19flox/flox and usp19flox/flox Lyz2-Cre mice in response to VSV infection with or without pretreatment with VER-155,008 (40 mg/kg). Scale bar: 200 μm. (F) Survival of Usp19flox/flox and usp19flox/flox Lyz2-Cre mice administered with VSV (1 × 108 PFU/g) via intraperitoneal injection (n = 8–10 per group). Statistical significance was calculated using the Log-rank (Mantel-Cox) test. The data are representative of three independent experiments.
Figure 9.
Figure 9.
Schematic representation of the role of USP19 in the regulation of TBK1 degradation via CMA. Pattern recognition receptors (PRRs, e.g., RLRs, TLRs, and CGAS) can recognize pathogen-associated molecular patterns (PAMPs, e.g., ssRNA, dsRNA, dsDNA, and LPS) and recruit different receptor proteins (e.g., MAVS, STING1, and TICAM1/TRIF) to activate TBK1. USP19 interacts with the TBK1-HSPA8 complex and then promotes TBK1 degradation via CMA, negatively regulating type I interferon production.

References

    1. Yu L, Chen Y, Tooze SA.. Autophagy pathway: cellular and molecular mechanisms. Autophagy. 2018;14(2):207–215. - PMC - PubMed
    1. Ktistakis NT, Tooze SA.. Digesting the expanding mechanisms of autophagy. Trends Cell Biol. 2016;26:624–635. - PubMed
    1. Shibutani ST, Saitoh T, Nowag H, et al. Autophagy and autophagy-related proteins in the immune system. Nat Immunol. 2015;16:1014–1024. - PubMed
    1. Mizushima N, Komatsu M. Autophagy: renovation of cells and tissues. Cell. 2011;147:728–741. - PubMed
    1. Levine B, Kroemer G. Biological Functions of autophagy genes: a disease perspective. Cell. 2019;176:11–42. - PMC - PubMed

Publication types