. 2021 Jul 16;373(6552):eabf8113.
doi: 10.1126/science.abf8113.

A human apolipoprotein L with detergent-like activity kills intracellular pathogens

Affiliations

A human apolipoprotein L with detergent-like activity kills intracellular pathogens

Ryan G Gaudet et al. Science. .

Abstract

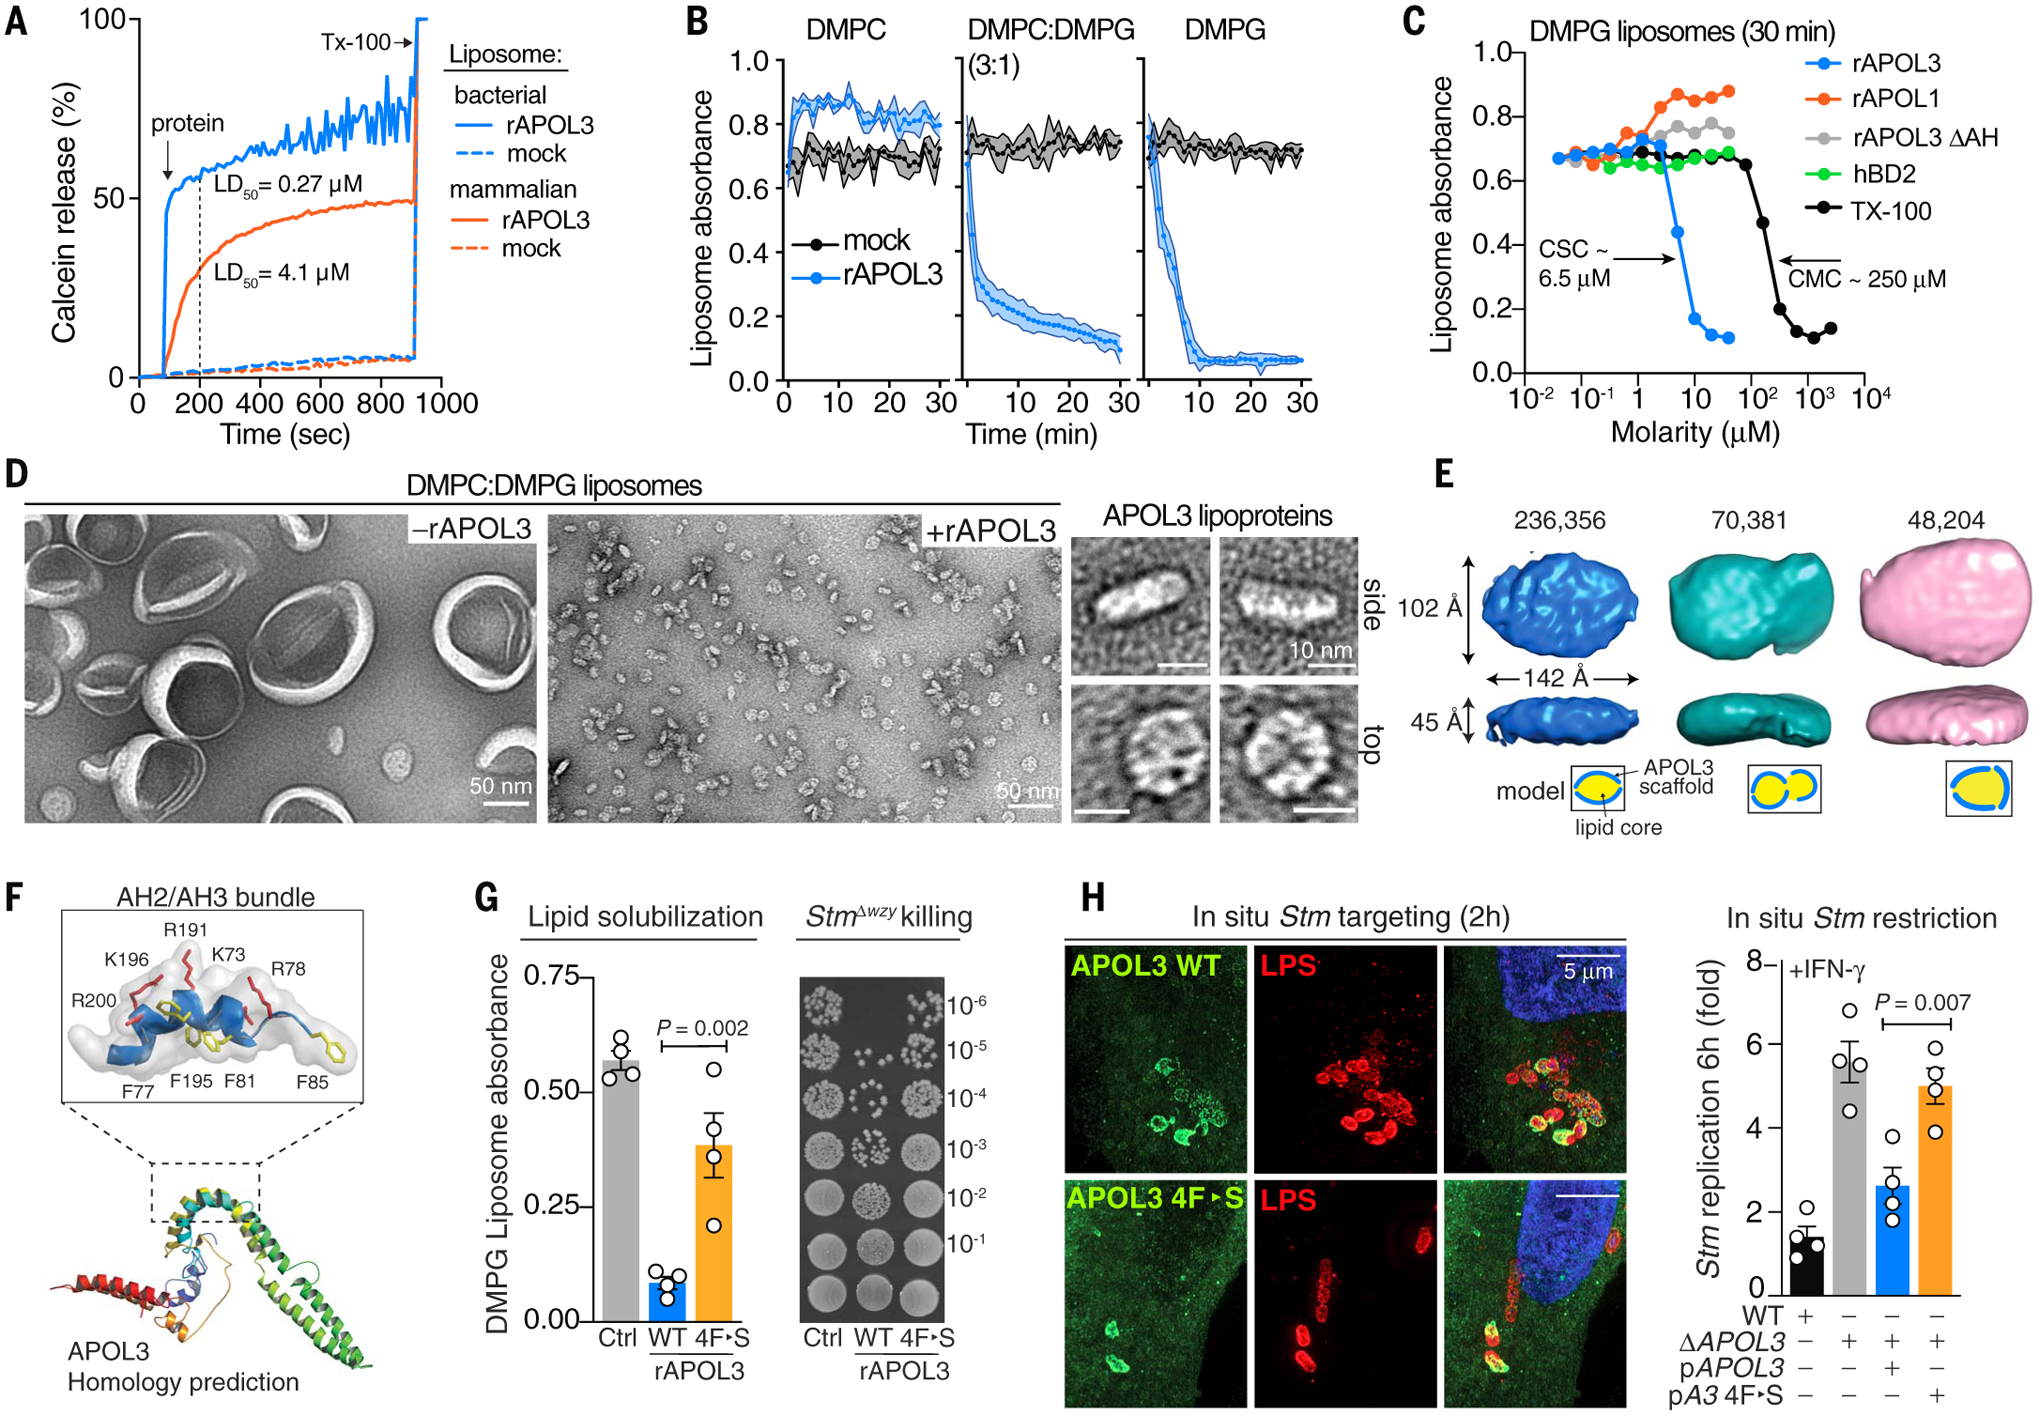
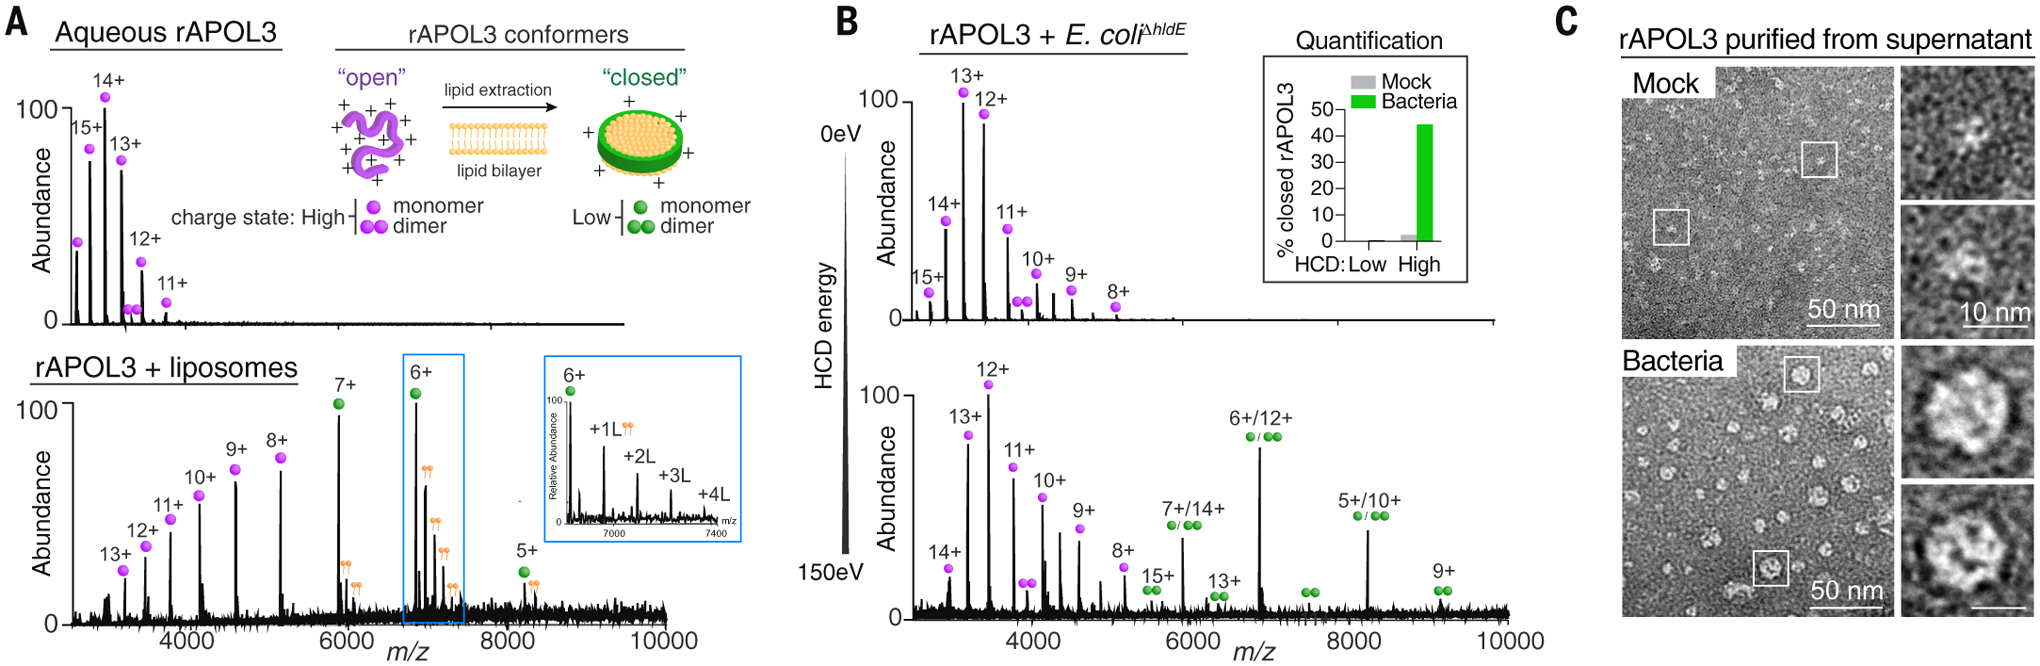
Activation of cell-autonomous defense by the immune cytokine interferon-γ (IFN-γ) is critical to the control of life-threatening infections in humans. IFN-γ induces the expression of hundreds of host proteins in all nucleated cells and tissues, yet many of these proteins remain uncharacterized. We screened 19,050 human genes by CRISPR-Cas9 mutagenesis and identified IFN-γ-induced apolipoprotein L3 (APOL3) as a potent bactericidal agent protecting multiple non-immune barrier cell types against infection. Canonical apolipoproteins typically solubilize mammalian lipids for extracellular transport; APOL3 instead targeted cytosol-invasive bacteria to dissolve their anionic membranes into human-bacterial lipoprotein nanodiscs detected by native mass spectrometry and visualized by single-particle cryo-electron microscopy. Thus, humans have harnessed the detergent-like properties of extracellular apolipoproteins to fashion an intracellular lysin, thereby endowing resident nonimmune cells with a mechanism to achieve sterilizing immunity.


Conflict of interest statement

Competing interests: The authors declare there are no competing interests.

Figures

Fig. 1.
Fig. 1.. Genome-wide identification of human APOL3 as an antibacterial ISG.
(A) FACS of HeLa cells infected with GFP-expressing Salmonella enterica Typhimurium (StmGFP). HR and SR gates are percentages of infected cells. Below, 3D confocal microscopy and calculated bacterial load per cell from each population (mean ± SEM). (B) Genome-wide CRISPR-Cas9 screen schema and gene-level enrichment scores in HR versus SR populations in the presence or absence of IFN-γ. Each gene is plotted against relative (fold) induction of its mRNA in IFN-γ–activated cells determined by RNA-seq. (C) StmGFP growth by FACS at 6 hours (left) and gentamicin protection assays (right) in APOL3-deficient HeLa cells (ΔAPOL3) genetically complemented with APOL3 (bottom row) or empty retroviral control (top two rows). Fold is given as relative to 1-hour starting time point (input). (D) Increase in bacterial load [relative to wild-type (WT) cells] recovered from APOL3- or STAT1-deficient IFN-γ–activated HeLa cells after the indicated time. **P < 0.01, ***P < 0.001 (one-way ANOVA); ns, not significant. (E) Human primary intestinal myofibroblasts treated with APOL3 siRNA or nontargeting scrambled control (siCtrl) (immunoblot, bottom right) and infected with StmmScarlet. Shown are representative final micrographs (10 hours) and quantification of HR Stm (foci 10 to 35 μm) every hour (mean ± SD, n = 3, representative of two independent experiments. In (C) and (D), data are means ± SEM from four independent experiments and FACS plots representative of at least four independent experiments. ϕ denotes a nonspecific band. Scale bar, 75 μm.
Fig. 2.
Fig. 2.. Human APOL3 targets and inflicts damage to cytosolic bacteria.
(A) APOL3mnGFP targeting StmRFP by live imaging in HeLa cells (movie S1). Percentage of total Stm targeted by HA-tagged APOL family members (2 hours) is shown at right. (B) StmRFP targeting and replication in IFN-γ–primed ΔAPOL3 cells complemented with the indicated APOL3 variant. (C) Deconvolved wide-field images of APOL3mnGFP targeting vacuole-confined StmRFP (StmΔinvA::pR1203) with or without vacuole release with LLOMe; fold replication is shown at right. (D) Inner membrane (IM) integrity as measured by minDmnGFP aggregation within Stm in HeLa cells expressing APOL3RFP at 2 hours with or without IFN-γ. Quantification reflects aggregation in APOL3-coated versus uncoated bacteria or total bacteria in WT versus ΔAPOL3 cells via Fisher’s exact test. (E) Arabinose-induced GFP in Stm targeted by APOL3FLAG in HeLa cells with or without IFN-γ. Maximal-intensity GFP/mCherry ratios are shown (mean ± SD, n = 50). (F) Immunofluorescence and SIM of APOL3HA and LPS on Stm with or without IFN-γ at selected times. Mid-2D z-planes are shown. Quantification of LPS penetrance (25 bacilli, mean ± SEM, n = 3) and 3D surface rendering are shown below. Blue arrows indicate cryo-immunogold EM staining of APOL3GFP in Stm-infected HeLa cells; OM, outer membrane. Micrographs are representative of at least three independent experiments. Data are means ± SEM [(A), (B), (C)] with significance by one-way ANOVA at 6 hours. ***P < 0.001. Scale bars, 5 μm [(A), (B), (C), and (E)], 2 μm (D), 1 μm (F).
Fig. 3.
Fig. 3.. Human APOL3 has direct bactericidal activity.
(A), Viability of Stm extracted from ΔAPOL3 cells with or without IFN-γ and exposed to rAPOL3 (3 hours). (B) Live imaging of cytosol-extracted Stm:ssTorA-GFP treated with 568-labeled rAPOL3 (5 μM) and membrane-impermeable Zombie-UV dye with quantitation (n = 100). (C) Bacterial viability after pulsing with the indicated agent followed by rAPOL3 exposure for 3 hours. (D) Median lethal dose (LD50) at 3 hours after in vivo or ex vivo sensitization of Stm. (E) rAPOL3 domain analysis (10 μM) at 3 hours after incubation with EDTA-pulsed Stm; Hydrophobicity and amphipathicity (μH) plot above. AH, amphipathic helix; TM, transmembrane domain. (F) Sensitivity of Stm and E. coli LPS truncation mutants to rAPOL3 (10 μM) in potassium gluconate (KGl). (G) EM micrographs of E. coliΔhldE exposed to His6-rAPOL3 for 5 min and detected with 5-nm Ni2+-gold beads. Data are means ± SEM from three to five independent experiments [(A), (B), (C), (E), and (F)] or are representative of three independent experiments [(D) and (G)]. *** P < 0.001. Scale bar in (B), 2 μm.
Fig. 4.
Fig. 4.. Human GBP1 potentiates APOL3 bactericidal activity.
(A) Viability of cytosolic Stm extracted from the indicated HeLa cell genotype (+IFN-γ) and exposed to rAPOL3. (B to D) Stm treated with 5 μM recombinant human GBP1RFP (rGBP1) (1 hour) with or without GTP and imaged by confocal microscopy (B), washed, treated with 5 μM rAPOL3 for 1 hour, and then analyzed by colony counting (C) or ATP (bubble size) in conjunction with both OM and IM permeability by NPN or Sytox uptake, respectively (D). Bubbles represent five independent experiments in technical duplicate. (E) Fold replication of Stm in unprimed HeLa cells expressing doxycycline-inducible (TRE, Tet response element) APOL3, GBP1, or both in tandem separated by the self-cleavable P2A peptide. (F) IFN-γ–activated HeLa cells expressing APOL3FLAG infected with Stm for 2 hours were analyzed by SIM (mid-2D single-plane imaging) after immunostaining for FLAG, GBP1, and Stm LPS (O-antigen). Arrows indicate penetrating APOL3 foci and quantification (n = 50). (G and H) IFN-γ–activated HeLa cells infected with StmGFP were analyzed by live microscopy for HR Stm (foci 10 to 35 μm) and cell death (Sytox+) (G) or whole-cell lysates probed by immunoblot after 3 hours (H). Representative images and immunoblots from one of three independent experiments and quantification of total events per well (% total cells) are shown. Data are means ± SEM from three to five independent experiments. Micrographs in [(B) and (F)] are representative of three independent experiments. Statistics indicate significance by one-way ANOVA [(C) and (G)], two-way ANOVA (E), unpaired t test (F), or nonlinear regression (A). *P < 0.05, ***P < 0.001. Scale bars, 10 μm (B), 1 μm (F), 80 μm (G).
Fig. 5.
Fig. 5.. APOL3 dissolves anionic membranes into lipoprotein nanodiscs.
(A) Calcein leakage from “bacterial” (80:20 DOPE:DOPG) or “mammalian” (60:10:30 DOPC/DOPS/cholesterol) liposomes (500 μM lipid) exposed to rAPOL3 (500 nM). Vertical dashed line indicates dosage yielding 50% dye release (LD50) in 200 s. (B and C) Turbidity of liposomes treated with rAPOL3 or indicated reagent over time (B) or after 30 min (C). (D) Negative-stain EM of liposomes before and after addition of rAPOL3 for 30 min as in (B). (E) Single-particle cryo-EM reconstruction of APOL3 lipoprotein nanodiscs. Isosurface representation of top three particle classes (number of particles) is shown, with space-constrained model below. Thickness is equivalent to a single DMPC or DMPG bilayer (45 Å). (F) Phyre2 structural homology prediction. Inset indicates arrangement of amphipathic helices (AH) 2 and 3, with four Phe (F) residues on the interior hydrophobic face highlighted in yellow and exterior-facing acidic residues Arg (R) and Lys (K) highlighted in red. (G) Liposome turbidity and viability of StmΔwzy treated with wild-type or mutant rAPOL3. The four Phe residues depicted in (F) were mutated to Ser (S). (H) Complementation of ΔAPOL3 HeLa cells with the indicated APOL3HA genotype evaluated for Stm targeting (left) and IFN-γ–dependent restriction (right). Data are means ± SEM from three or four independent experiments [(B), (G), and (H)] or are representative of three or more independent experiments [(A), (C), and (D)]. Statistics indicate significance by one-way ANOVA.
Fig. 6.
Fig. 6.. APOL3 extracts bacterial lipid to form lipoproteins during killing.
(A) Conformational analysis by native mass spectrometry (nativeMS) of rAPOL3 in ammonium acetate buffer (aqueous) or after incubation with DMPC/DMPG liposomes for 30 min. Inset shows that satellite peaks correspond to successive lipid (L) adducts. Schematic indicates the two observed charge states: lipid-free “open” or lipid-bound “closed” monomers (single circle) or dimers (doublet). (B) NativeMS spectra of soluble rAPOL3 after incubating with live E. coliΔhldE for 1 hour. Collisional activation energy (HCD) was set to 0 eV (top) or 150 eV (bottom). Inset shows nativeMS quantification of “closed” APOL3 conformers before (mock) and after treatment of bacteria and analyzed at the indicated HCD energy. (C) rAPOL3 was incubated with live E. coliΔhldE as in (B), purified from the supernatant by Ni-NTA pull-down and analyzed by negative-stain electron microscopy. Data from [(A) to (C)] are representative of three independent experiments.

Comment in

  • Rethinking immunology.
    Nathan C. Nathan C. Science. 2021 Jul 16;373(6552):276-277. doi: 10.1126/science.abj5637. Science. 2021. PMID: 34437138 No abstract available.

References

    1. Randow F, MacMicking JD, James LC, Cellular self-defense: How cell-autonomous immunity protects against pathogens. Science 340, 701–706 (2013). doi: 10.1126/science.1233028 - DOI - PMC - PubMed
    1. MacMicking JD, Interferon-inducible effector mechanisms in cell-autonomous immunity. Nat. Rev. Immunol 12, 367–382 (2012). doi: 10.1038/nri3210 - DOI - PMC - PubMed
    1. Schroder K, Hertzog PJ, Ravasi T, Hume DA, Interferon-γ: An overview of signals, mechanisms and functions. J. Leukoc. Biol 75, 163–189 (2004). doi: 10.1189/jlb.0603252 - DOI - PubMed
    1. Zhang S-Y et al., Inborn errors of interferon (IFN)-mediated immunity in humans: Insights into the respective roles of IFN-α/β, IFN-γ, and IFN-λ in host defense. Immunol. Rev 226, 29–40 (2008). doi: 10.1111/j.1600-065X.2008.00698.x - DOI - PubMed
    1. Zhang S-Y et al., Human inborn errors of immunity to infection affecting cells other than leukocytes: From the immune system to the whole organism. Curr. Opin. Immunol 59, 88–100 (2019). doi: 10.1016/j.coi.2019.03.008 - DOI - PMC - PubMed

Publication types

MeSH terms