. 2021 Jul 16;373(6552):306-315.
doi: 10.1126/science.abf8705.

Chromatin landscape signals differentially dictate the activities of mSWI/SNF family complexes

Affiliations

Chromatin landscape signals differentially dictate the activities of mSWI/SNF family complexes

Nazar Mashtalir et al. Science. .

Abstract

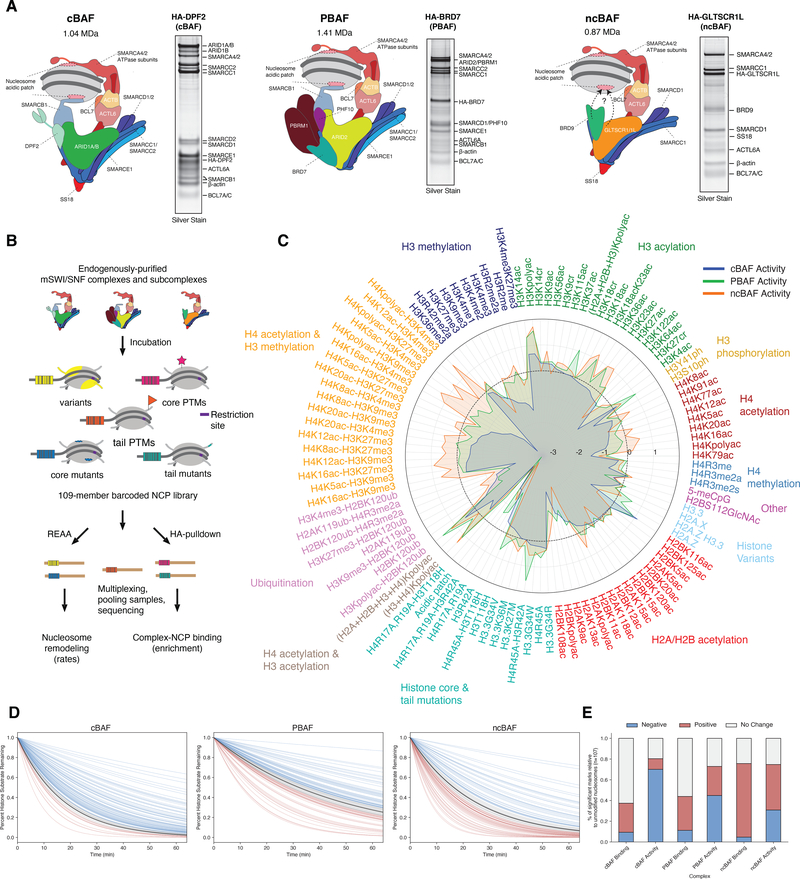
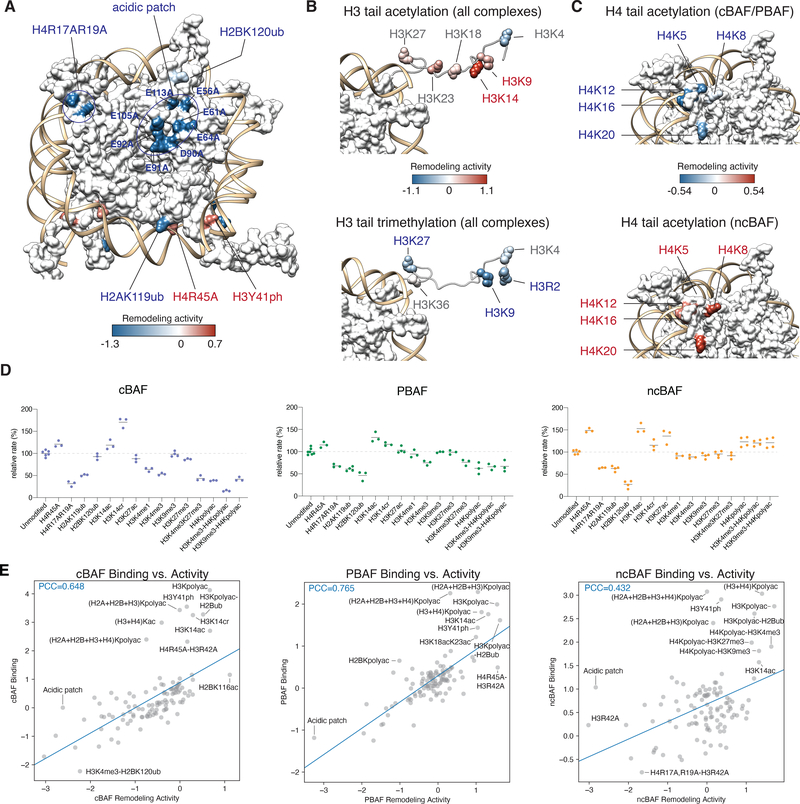
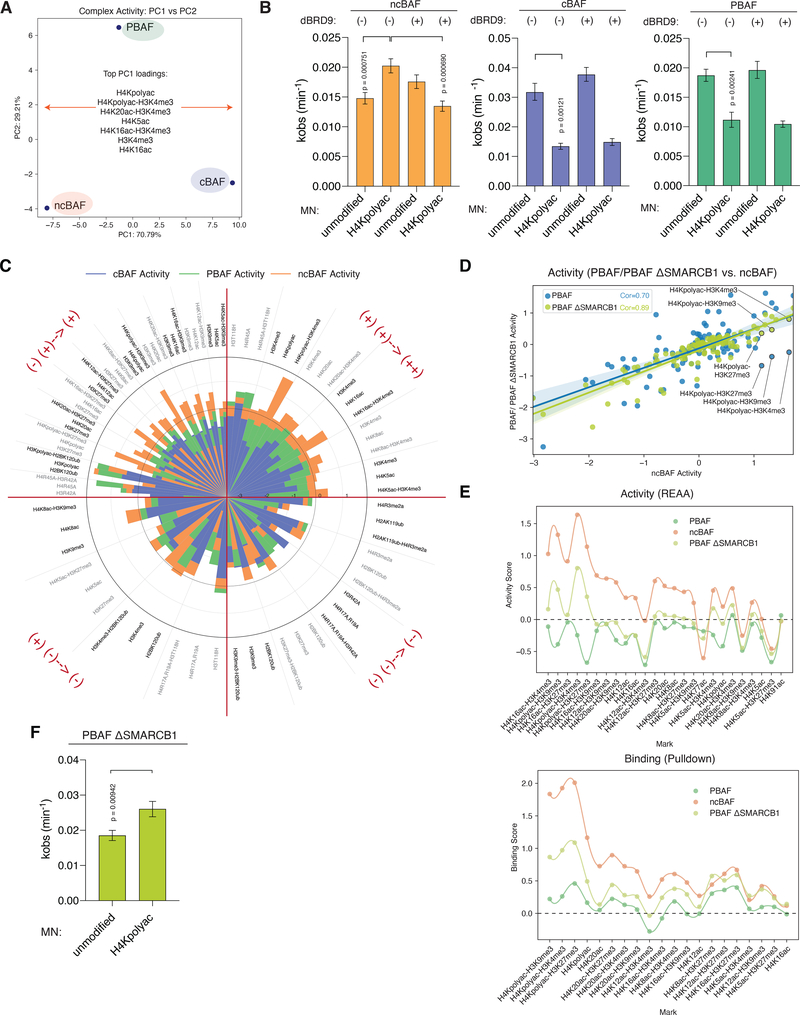
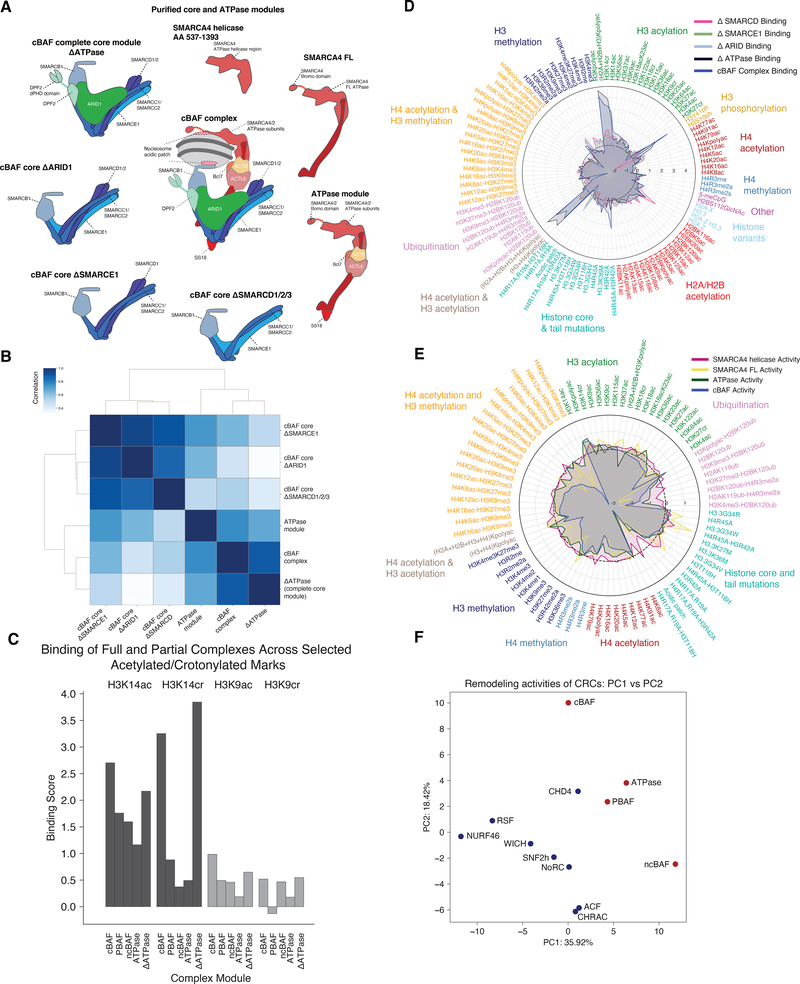
Mammalian SWI/SNF (mSWI/SNF) adenosine triphosphate-dependent chromatin remodelers modulate genomic architecture and gene expression and are frequently mutated in disease. However, the specific chromatin features that govern their nucleosome binding and remodeling activities remain unknown. We subjected endogenously purified mSWI/SNF complexes and their constituent assembly modules to a diverse library of DNA-barcoded mononucleosomes, performing more than 25,000 binding and remodeling measurements. Here, we define histone modification-, variant-, and mutation-specific effects, alone and in combination, on mSWI/SNF activities and chromatin interactions. Further, we identify the combinatorial contributions of complex module components, reader domains, and nucleosome engagement properties to the localization of complexes to selectively permissive chromatin states. These findings uncover principles that shape the genomic binding and activity of a major chromatin remodeler complex family.


Conflict of interest statement

Competing interests: CK is the scientific founder, fiduciary Board of Directors member, Scientific Advisory Board Member, shareholder and consultant for Foghorn Therapeutics, Inc. (Cambridge, MA). The other authors declare that they have no competing interests.

Figures

Figure 1.
Figure 1.. Comprehensive profiling of nucleosome binding and remodeling activities of mSWI/SNF family complexes using DNA-barcoded nucleosome libraries.
A. Schematics and representative SDS-PAGE silver stain gel analyses of endogenous human mSWI/SNF family complexes from HEK-293T cells using HA-tagged DPF2, -BRD7, and -GLTSCR1L as baits for cBAF, PBAF, and ncBAF, respectively. B. Strategy for high-throughput sequencing-based nucleosome binding and remodeling activity analyses of endogenous human mSWI/SNF complexes incubated with a DNA-barcoded mononucleosome library (n= 109 mononucleosomes). C. Radar plots mapping the activity measurements of all three mSWI/SNF family complexes across the entire mononucleosome library, normalized to activity on unmodified substrates. Marks and variants are separated by color. Positive score indicates increased activity, negative score indicates decreased activity relative to complex activity on unmodified nucleosome substrates. Marks are sorted by cBAF remodeling activity within each mononucleosome subtype. D. Activity curves for cBAF, PBAF, and ncBAF complexes across the n=109 mononucleosomes in the library using one-phase decay. Average of complex activity on unmodified (wild-type) mononucleosomes is shown as black line; mononuclesomes showing complex activity > 2 s.d. from WT are shown in red, < 2 s.d. from WT are shown in blue, remaining are shown in gray. See Methods for additional information. E. Proportion of the unchanged and statistically significant positive and negative regulators of binding and activity measurements across cBAF, PBAF and ncBAF complexes. Positive and negative marks identified as those greater than +/− two standard deviations from the unmodified average. See Methods for additional information.
Figure 2.
Figure 2.. Histone modification hotspots impact mSWI/SNF family complex nucleosome remodeling activities.
A. Modifications of all key residues in the acidic patch (H2AE56A, E61A, E64A, D90A, E91A, E92A and H2BE105A, E113A), the H4 tail basic patch (H4R17A, R19A), and H2AK119ub uniformly inhibit the remodeling activities of all three complex types (blue), while modifications mapping to histone-DNA interfaces (H3Y41ph and the H4R45A sin- mutant) promote the remodeling activity (red). All sites are colored according to the average of log2(fold-change vs. the unmodified nucleosome) values of the three complexes. Note, acidic patch sites have an average log2 value of −2.9, which is out of the color bar range, and is colored blue. (PDB: 1KX5). B. Acetylation of the H3 tail predominantly promotes remodeling activity (top), while methylation marks tend to inhibit the remodeling activity of the three complexes (bottom). Modifications that consistently have negative, positive, or variable effects across all three complexes are indicated in blue, red, and gray, respectively. All sites are colored according to the average of log2(fold-change vs. the unmodified nucleosome) values of individual acetylation marks (top), and trimethylation marks (bottom) across the three complexes. (PDB: 1KX5). C. Acetylation of the H4 tail predominantly inhibits the remodeling activity of cBAF and PBAF complexes (top, blue), while they selectively promote the remodeling activity of ncBAF complexes (bottom, red). Modifications that consistently have negative, and positive, or variable effects across all three complexes are written in red and blue, respectively. All sites are colored according to the average of log2(fold-change vs. the unmodified nucleosome) values of cBAF and PBAF (top), and ncBAF (bottom). (PDB: 1KX5). D. Validation experiments using individual chemically-modified NCPs (lacking DNA barcodes; 10nM), performed on separately-purified cBAF, PBAF, and ncBAF complexes (5nM) across a selection of histone marks and variants from the screen (~15% of the library). n= 3–4 experimental replicates; dots highlight individual data points, black line represents mean value. See Methods for additional information. E. Activity vs. binding scores for cBAF, PBAF and ncBAF complexes across all mononucleosomes profiled, normalized to unmodified nucleosomes. Pearson correlation coefficients (PCC) are reported for the simple linear regression using all marks (blue).
Figure 3.
Figure 3.. Preferential activity of ncBAF complexes on poly-acetylated histone H4 substrates is facilitated by BRD9 and the absence of the SMARCB1 subunit.
A. Principal component analysis (PCA) of cBAF, PBAF, and ncBAF complex activity measurements across the full n=109 nucleosome library; PC1: 70.79% and PC2: 29.21%. Top PC1 loadings are indicated. B. Effect of H4polyac marks and dBRD9 (BRD9 inhibitor, 5 μM) on the remodeling activity (kinetics) of ncBAF, cBAF, and PBAF complexes. Graphs show the fit remodeling rates (kobs) for different conditions. Error bars represent 95% confidence interval. P-values of significant conditions are indicated (n = 3–5 replicates). C. Radar plots containing stacked bar charts for cBAF, PBAF, and ncBAF complex activities, showing nucleosomes with sets of single and combination marks, distributed in quadrants showing additive positive and negative and dominant positive and negative combinations. D. Correlation of pan-library activity scores for ncBAF with PBAF complexes (blue) or SMARCB1-deficient PBAF complexes (light green). Key H4ac marks are labeled. E. Activity (REAA) (top) and binding (bottom) library screen results for PBAF, PBAF ΔSMARCB1, and ncBAF complexes over nucleosome substrates containing H4 tail acetylation. Curves representing smoothened activity and binding scores across the marks presented are shown. F. SMARCB1-deficient PBAF remodeling activity on WT and H4polyac nucleosome substrates as measured by restriction enzyme accessibility assay (REAA). Graphs show the fit remodeling rates (kobs) for different conditions. Error bars represent 95% confidence interval. P-values of significant conditions are indicated (n = 3 replicates).
Figure 4.
Figure 4.. Epigenetic modification preferences of mSWI/SNF complexes are defined by module-specific histone binding properties.
A. Schematic summarizing the cBAF core and ATPase modules/subunits subjected to full library binding and activity experiments. B. Correlation heatmap for pan-library binding profiles for all cBAF core modules, ATPase module, and full cBAF complexes. C. Binding scores for cBAF, PBAF, ncBAF complexes as well as the full core module (Core, ΔATPase) and the ATPase module (ATPase) over H3 lysine acylation marks (H3K14ac, H3K14cr, H3K9ac, and H3K9cr). D. Radar plots indicating the binding of cBAF cores (ΔARID, ΔSMARCD, ΔSMARCE1, ΔATPase) and full cBAF complexes across all mononucleosomes profiled in the library. Marks and variants are separated by color. The radar plots are sorted by cBAF full complex binding within each histone mark type. E. Radar plots indicating the remodeling activities of the ATPase module, SMARCA4 FL, truncated SMARCA4 (aa 537–1393) and full cBAF complexes across all mononucleosomes profiled in the library. Marks and variants are separated by color. The radar plots are sorted by cBAF full complex binding within each histone mark type. G. Principal component analysis (PCA) of mSWI/SNF, CHD4 and ISWI complex activities.

Comment in

References

    1. Bates SE, Epigenetic Therapies for Cancer. The New England journal of medicine 383, 650–663 (2020). - PubMed
    1. Kadoch C, Crabtree GR, Mammalian SWI/SNF chromatin remodeling complexes and cancer: Mechanistic insights gained from human genomics. Science advances 1, e1500447 (2015). - PMC - PubMed
    1. Mashtalir N et al., Modular Organization and Assembly of SWI/SNF Family Chromatin Remodeling Complexes. Cell 175, 1272–1288.e1220 (2018). - PMC - PubMed
    1. Michel BC et al., A non-canonical SWI/SNF complex is a synthetic lethal target in cancers driven by BAF complex perturbation. Nature cell biology 20, 1410–1420 (2018). - PMC - PubMed
    1. Pan J et al., Interrogation of Mammalian Protein Complex Structure, Function, and Membership Using Genome-Scale Fitness Screens. Cell systems 6, 555–568.e557 (2018). - PMC - PubMed

Publication types

MeSH terms