. 2021 Oct 15;131(20):e151520.
doi: 10.1172/JCI151520.

The autoimmune signature of hyperinflammatory multisystem inflammatory syndrome in children

Affiliations

The autoimmune signature of hyperinflammatory multisystem inflammatory syndrome in children

Rebecca A Porritt et al. J Clin Invest. .

Abstract

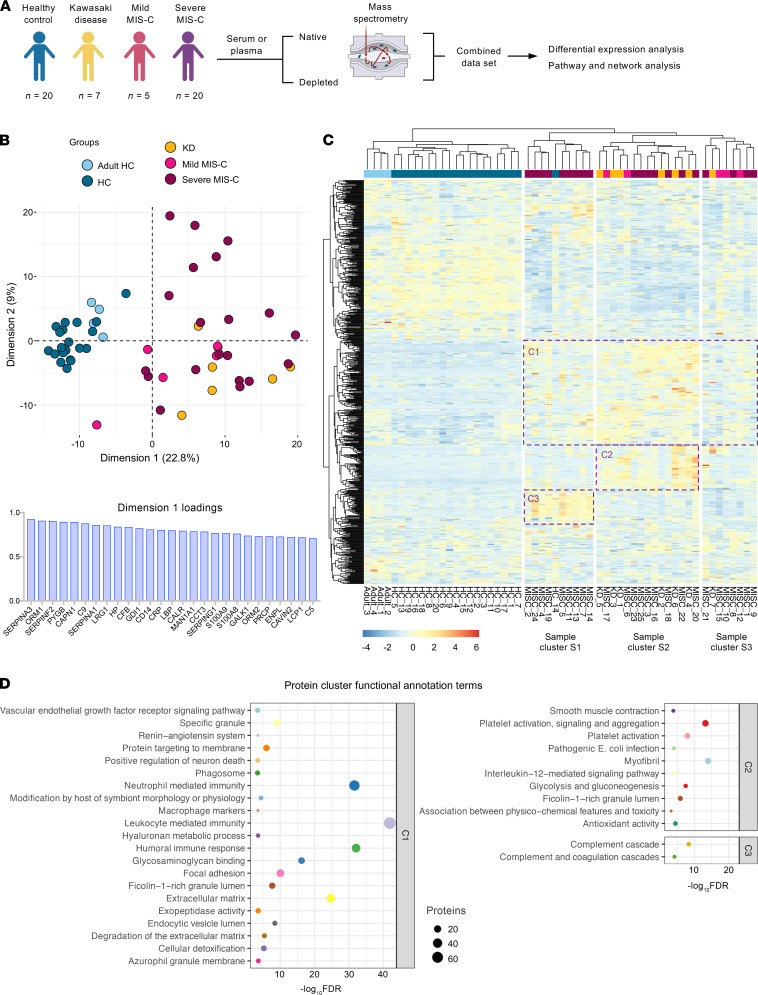
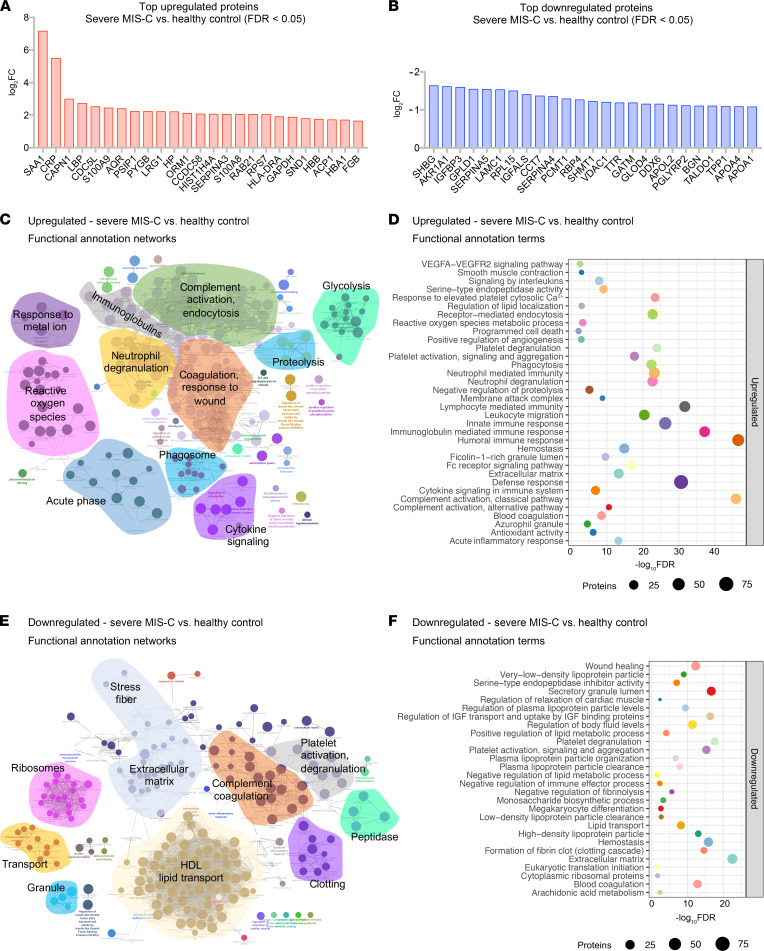
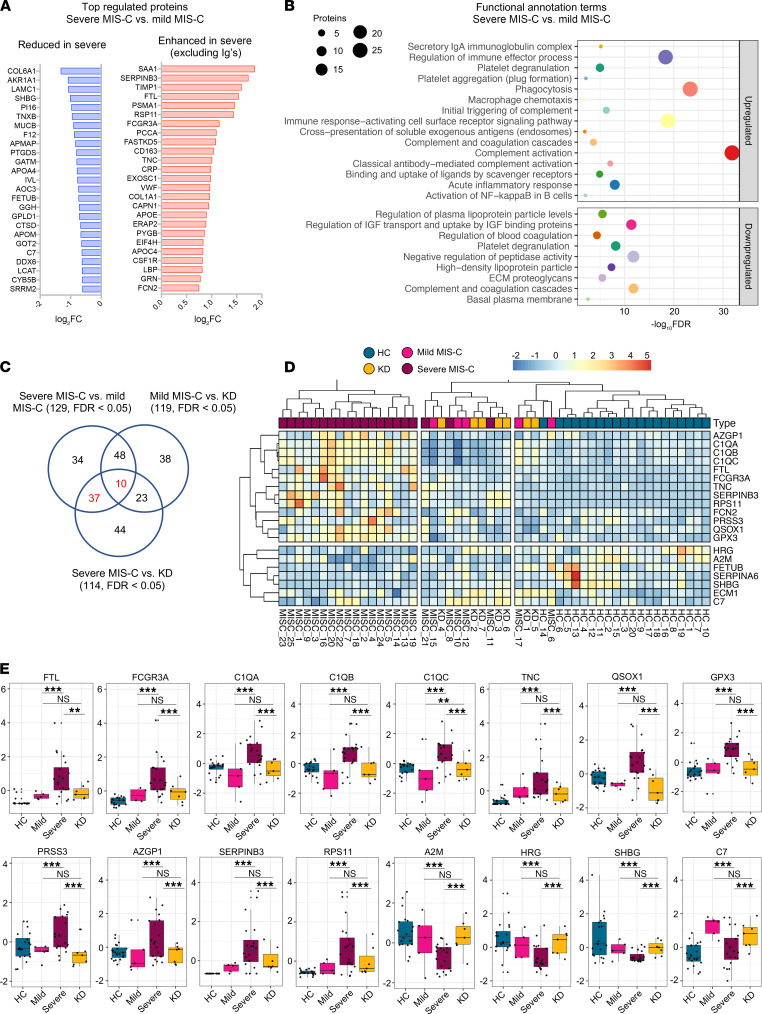
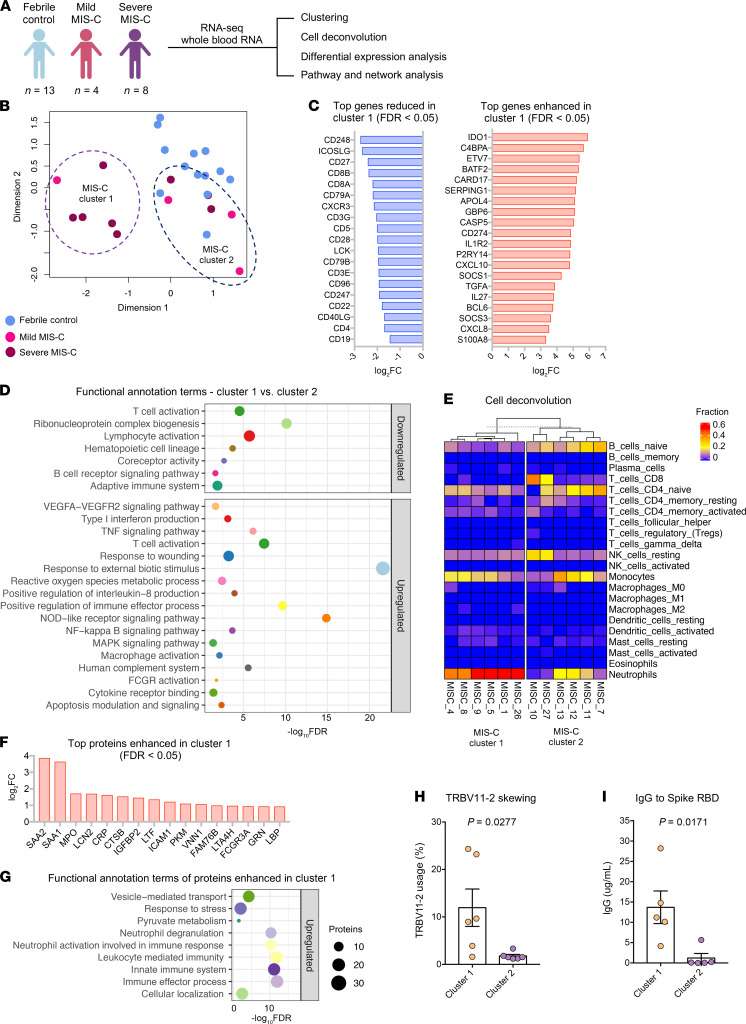
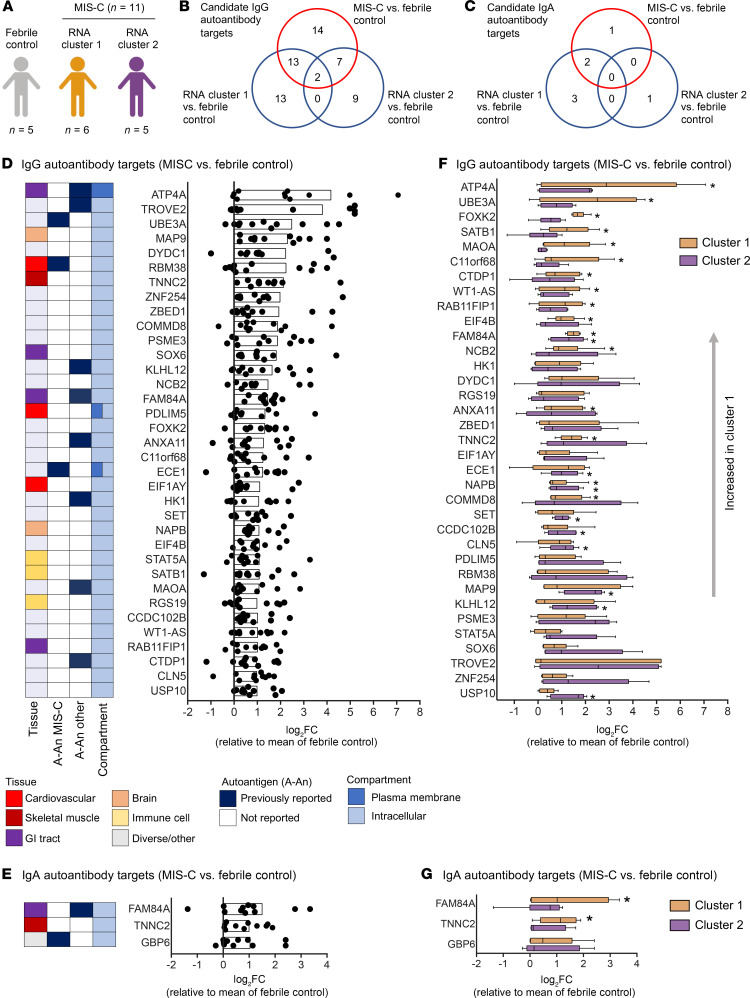
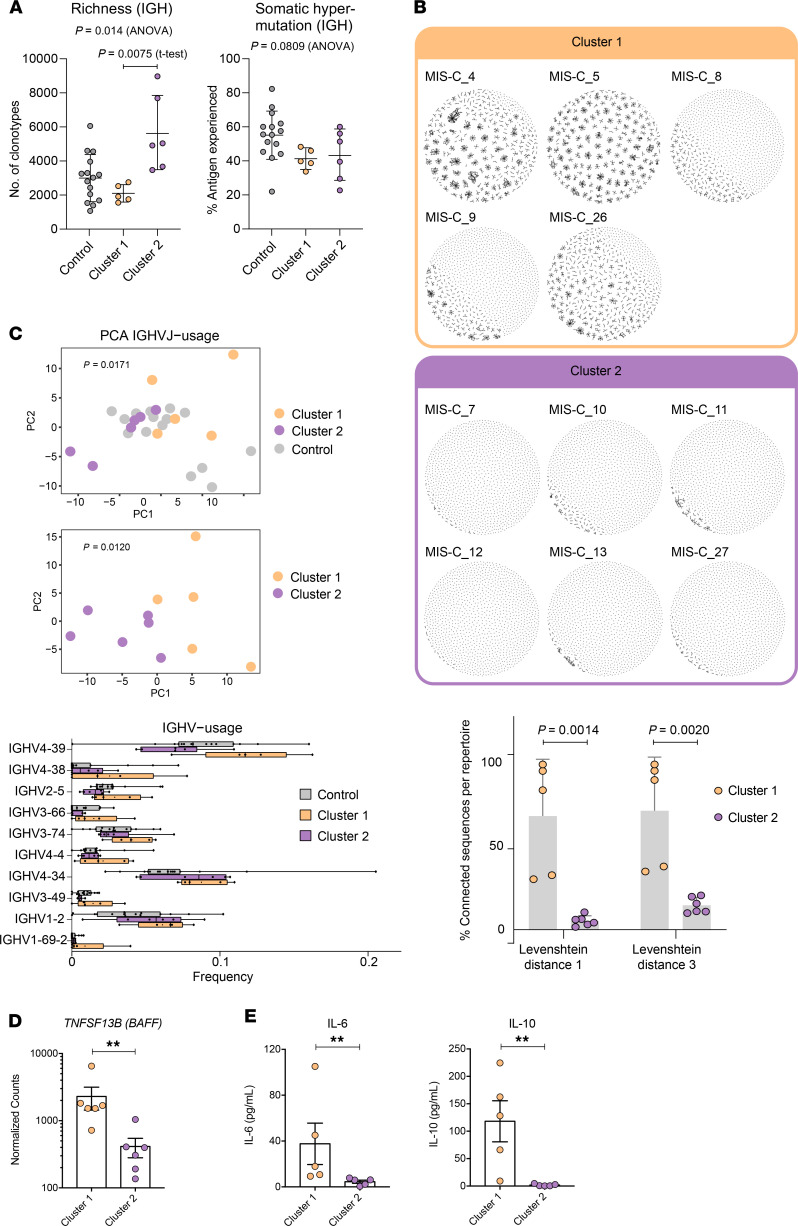
Multisystem inflammatory syndrome in children (MIS-C) manifests as a severe and uncontrolled inflammatory response with multiorgan involvement, occurring weeks after SARS-CoV-2 infection. Here, we utilized proteomics, RNA sequencing, autoantibody arrays, and B cell receptor (BCR) repertoire analysis to characterize MIS-C immunopathogenesis and identify factors contributing to severe manifestations and intensive care unit admission. Inflammation markers, humoral immune responses, neutrophil activation, and complement and coagulation pathways were highly enriched in MIS-C patient serum, with a more hyperinflammatory profile in severe than in mild MIS-C cases. We identified a strong autoimmune signature in MIS-C, with autoantibodies targeted to both ubiquitously expressed and tissue-specific antigens, suggesting autoantigen release and excessive antigenic drive may result from systemic tissue damage. We further identified a cluster of patients with enhanced neutrophil responses as well as high anti-Spike IgG and autoantibody titers. BCR sequencing of these patients identified a strong imprint of antigenic drive with substantial BCR sequence connectivity and usage of autoimmunity-associated immunoglobulin heavy chain variable region (IGHV) genes. This cluster was linked to a TRBV11-2 expanded T cell receptor (TCR) repertoire, consistent with previous studies indicating a superantigen-driven pathogenic process. Overall, we identify a combination of pathogenic pathways that culminate in MIS-C and may inform treatment.

Keywords: Autoimmune diseases; COVID-19; Cellular immune response; Cytokines; Inflammation.


Conflict of interest statement

Conflict of interest: The authors have declared that no conflict of interest exists.

Figures

Figure 1
Figure 1. Proteomic profiling of MIS-C cases.
(A) Experimental design of native and depleted serum proteomics profiling of healthy controls (n = 20), mild MIS-C (n = 5), severe MIS-C (n = 20), and KD (n = 7) patients. (B) PCA of proteomics data and top proteins contributing to dimension 1 of the PCA plot. (C) Heatmap and hierarchical clustering of proteomics expression data revealed 3 protein sets (C1, C2, and C3) driving separation between 3 clades of MIS-C and KD patients (sample clusters S1, S2, and S3). (D) ClueGO ontology analysis via PINE (Protein Interaction Network Extractor) for visualization of pathways and functional categories significantly enriched within each of the 3 protein sets (C1, C2, and C3) revealed by hierarchical clustering analysis in panel C. The x axis denotes the negative decimal logarithm of the FDR of enrichment (term P value corrected with Bonferroni’s test). Size of the node denotes number of proteins within each term.
Figure 2
Figure 2. Characterization of severe MIS-C.
Protein expression was compared between severe MIS-C (n = 20) and healthy controls (n = 20). Proteins were considered significantly changed when FDR was less than 0.05, as determined by mapDIA statistical software for protein differential expression using MS/MS fragment-level quantitative data. (A) Top proteins enhanced in severe MIS-C, ranked by fold change. (B) Top proteins reduced in severe MIS-C, ranked by fold change. (C) ClueGO Ontology analysis via PINE visualized a network of pathways and functional annotation terms enriched in a set of proteins significantly increased in severe MIS-C population when compared with healthy controls. (D) Selected pathways and functional annotation terms from PINE analysis of proteins increased in severe MIS-C when compared with healthy controls. (E) Network plots visualized via PINE analysis of proteins reduced in severe MIS-C group when compared with healthy controls. (F) Selected pathways and functional annotation terms from protein functional enrichment analysis of proteins reduced in severe MIS-C group when compared with healthy controls.
Figure 3
Figure 3. Proteins distinguishing severe MIS-C from mild disease and KD.
Protein differential expression analysis was performed between severe MIS-C (n = 20) and mild MIS-C (n = 5) groups. Proteins were considered significantly changed when FDR was less than 0.05 as calculated by mapDIA statistical software. (A) Bar graphs show top increased and top decreased proteins in severe MIS-C when compared with mild, ranked by fold change and excluding Igs. (B) Selected pathways and functional annotation terms from protein functional enrichment analysis facilitated by PINE software using proteins increased (top panel) and decreased (bottom panel) in severe MIS-C compared with mild MIS-C. (C) Venn diagram of proteins differentially regulated between severe MIS-C, mild MIS-C, and KD. (D) Heatmap of selected proteins distinguishing severe MIS-C from mild MIS-C and KD. (E) Box-and-whisker plots of selected proteins found increased in severe MIS-C compared with mild MIS-C and KD. For improved visualization purposes, box-and-whisker plots show scaled protein expression values. Scaling was performed by mean centering and division by SD of each protein variable. For box-and-whisker plots, the bounds of the boxes represent IQR (Q1 to Q3) and the whiskers represent the nonoutlier minimum and maximum values, 1.5 × IQR. The median values are marked with a horizontal line in the boxes, and outliers are marked with black centered points outside the whiskers. Statistical analysis was calculated by mapDIA statistical software for protein differential expression using MS/MS fragment-level quantitative data. **P < 0.01, ***P < 0.001. NS, not significant.
Figure 4
Figure 4. RNA-seq analysis of MIS-C.
RNA-seq was performed using whole-blood RNA isolated from febrile controls (n = 13), mild MIS-C (n = 4), and severe MIS-C (n = 8) patients. (A) Experimental design of RNA-seq analysis and patient groups. (B) PCA of RNA-seq profiles. (C) Genes up- or downregulated in cluster 1 vs. cluster 2 MIS-C patients (FDR < 0.05). (D) Selected pathways and functional annotation terms from gene functional enrichment analysis performed with PINE software using significantly up- and downregulated (FDR < 0.01, log2[FC] > 1.5 and < –1.25) genes in cluster 1 vs. cluster 2 MIS-C patients. (E) Cell deconvolution analysis of RNA-seq data by CIBERSORT. (F) Top proteins increased in cluster 1 vs. cluster 2, based on proteomics data. (G) Enriched pathways and functional annotation terms based on protein expression changes significantly (FDR < 0.05) upregulated in cluster 1 with respect to cluster 2. (H) TRBV11-2 expansion of RNA-seq samples (17). (I) IgG titers against Spike protein receptor binding domain (RBD). Data are presented as mean ± SEM. Statistical significance was determined by Mann-Whitney test (H and I).
Figure 5
Figure 5. Autoantibody analysis of MIS-C.
(A) Autoantibody analysis was performed on serum from febrile controls (n = 5) and MIS-C patients (n = 11) using HuProt array. MIS-C samples correspond to RNA cluster 1 (n = 6) and RNA cluster 2 (n = 5) identified in Figure 4. (B) Venn diagram of candidate IgG autoantibody targets in MIS-C and RNA clusters (P < 0.05, FC > 2). (C) Venn diagram of candidate IgA autoantibody targets in MIS-C and RNA clusters (P < 0.05, FC > 2). (D) IgG autoantibody targets identified in MIS-C (n = 11) compared with febrile controls (n = 5). The bar represents log2(FC). Each symbol represents 1 MIS-C patient presented as log2(FC) above the mean of febrile controls. (E) IgA autoantibody targets identified in MIS-C (n = 11) compared with febrile controls (n = 5). The bar represents log2(FC). Each symbol represents 1 MIS-C patient presented as log2(FC) above the mean of febrile controls. (F) IgG autoantibody targets separated based on RNA cluster 1 (n = 6) and RNA cluster 2 (n = 5). Data are presented as log2(FC) above the mean of febrile controls. (G) IgA autoantibody targets separated based on RNA cluster 1 (n = 6) and RNA cluster 2 (n = 5). Data are presented as log2(FC) above the mean of febrile controls. For box-and-whisker plots, the bounds of the boxes represent the interquartile range (IQR, Q1 to Q3) and the whiskers represent the minimum and maximum values. The median values are marked with a horizontal line within the box. *FDR < 0.05 compared with febrile controls.
Figure 6
Figure 6. B cell repertoire metrics, connectivity characteristics, and skewing of IGHV-J usage of MIS-C patients in RNA clusters 1 and 2.
(A) Richness and somatic hypermutation of productive IGH repertoires of MIS-C patients of RNA cluster 1 (n = 5) and RNA cluster 2 (n = 6) compared with age-matched febrile control patients (n = 15). Bars indicate mean ± SD. Statistical analysis: ordinary 1-way ANOVA for global analysis and unpaired Student’s t test for paired comparison. (B) Petri dish plots of IGH repertoire networks of MIS-C patients of RNA cluster 1 and 2. A sample of 1000 unique CDR3 amino acid clones per repertoire were subjected to imNet network analysis (75). Petri dish plots are shown for Levenshtein distance 1. Percentages of connected sequences of MIS-C patients of RNA cluster 1 and 2 obtained from networks with Levenshtein distance 1 and 3 are shown as bar plots. Bars indicate mean ± SD. Statistical analysis: unpaired Student’s t test. (C) PCA of differential IGHV-J gene usage in MIS-C patients of RNA cluster 1 (n = 5) versus cluster 2 (n = 6) versus age-matched febrile controls (n = 15). Statistical analysis: Pillai-Bartlett test of MANOVA of all principal components. Frequencies per repertoire of the 10 most skewed IGHV genes in MIS-C and febrile control patients are shown as box-and-whisker plots. The boxes extend from the 25th to 75th percentiles, whiskers from minimum to maximum, and the line within the box indicates the median. (D) BAFF expression in MIS-C cluster 1 and cluster 2, using the RNA-seq data in Figure 5. Data are presented as mean ± SEM. (E) IL-6 and IL-10 levels in serum of MIS-C cluster 1 and cluster 2 patients, using cytokine data from Supplemental Figure 1. Data are presented as mean ± SEM. Statistical analysis: Mann-Whitney test (D and E). **P < 0.01.

References

    1. Stokes EK, et al. Coronavirus Disease 2019 case surveillance - United States, January 22-May 30, 2020. MMWR Morb Mortal Wkly Rep. 2020;69(24):759–765. doi: 10.15585/mmwr.mm6924e2. - DOI - PMC - PubMed
    1. Götzinger F, et al. COVID-19 in children and adolescents in Europe: a multinational, multicentre cohort study. Lancet Child Adolesc Health. 2020;4(9):653–661. doi: 10.1016/S2352-4642(20)30177-2. - DOI - PMC - PubMed
    1. Verdoni L, et al. An outbreak of severe Kawasaki-like disease at the Italian epicentre of the SARS-CoV-2 epidemic: an observational cohort study. Lancet. 2020;395(10239):1771–1778. doi: 10.1016/S0140-6736(20)31103-X. - DOI - PMC - PubMed
    1. Toubiana J, et al. Kawasaki-like multisystem inflammatory syndrome in children during the covid-19 pandemic in Paris, France: prospective observational study. BMJ. 2020;369:m2094. - PMC - PubMed
    1. Belay ED, et al. Trends in geographic and temporal distribution of US children with multisystem inflammatory syndrome during the COVID-19 pandemic. JAMA Pediatr. 2021;175(8):837–845. doi: 10.1001/jamapediatrics.2021.0630. - DOI - PMC - PubMed

Publication types

MeSH terms

Supplementary concepts