. 2021 Aug 26;17(8):e1009264.
doi: 10.1371/journal.pcbi.1009264. eCollection 2021 Aug.

Mitigating COVID-19 outbreaks in workplaces and schools by hybrid telecommuting

Affiliations

Mitigating COVID-19 outbreaks in workplaces and schools by hybrid telecommuting

Simon Mauras et al. PLoS Comput Biol. .

Abstract

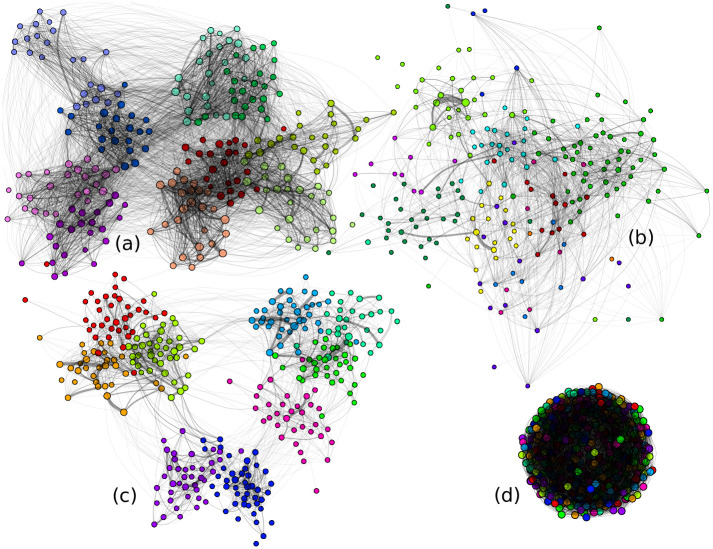
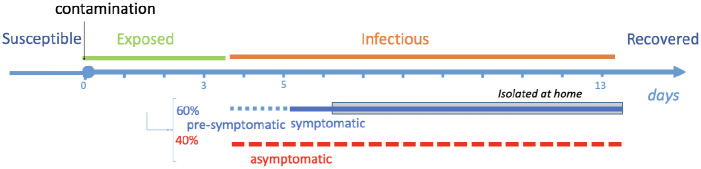
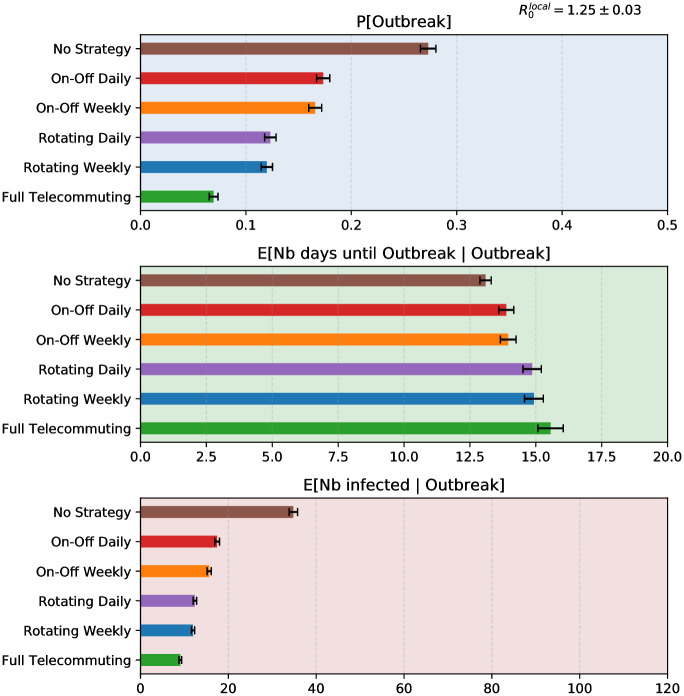
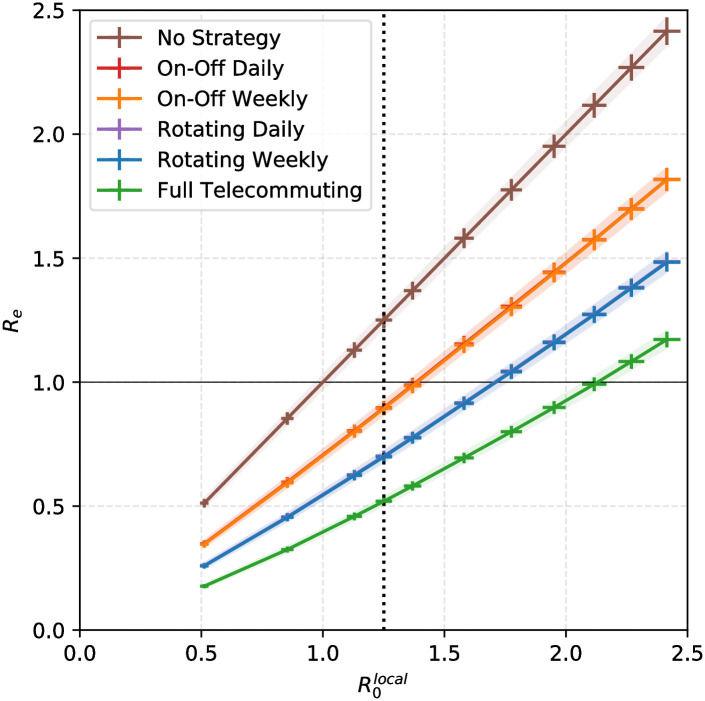
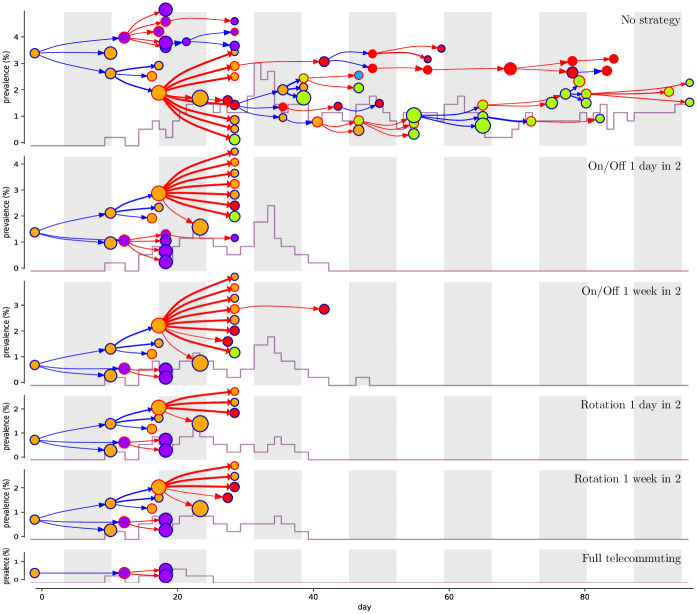
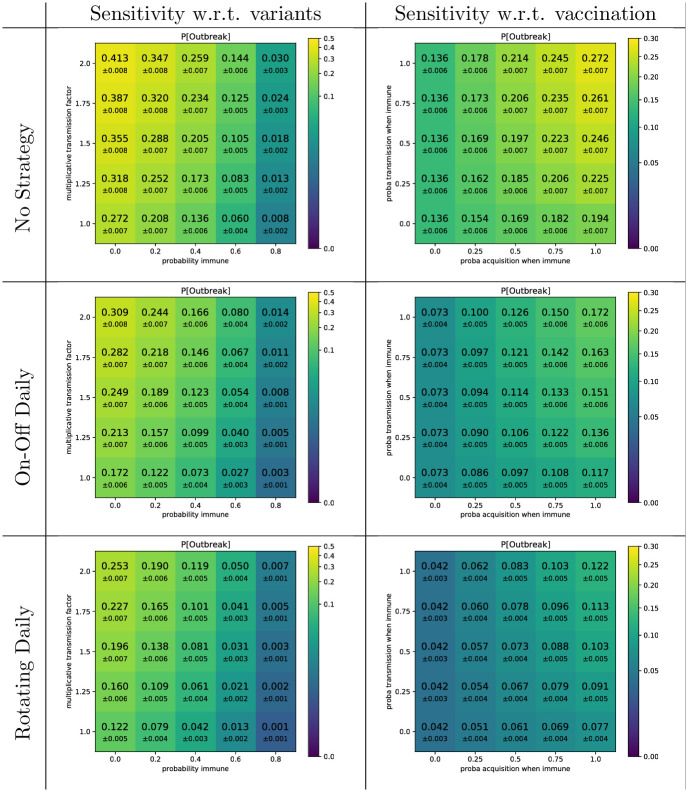
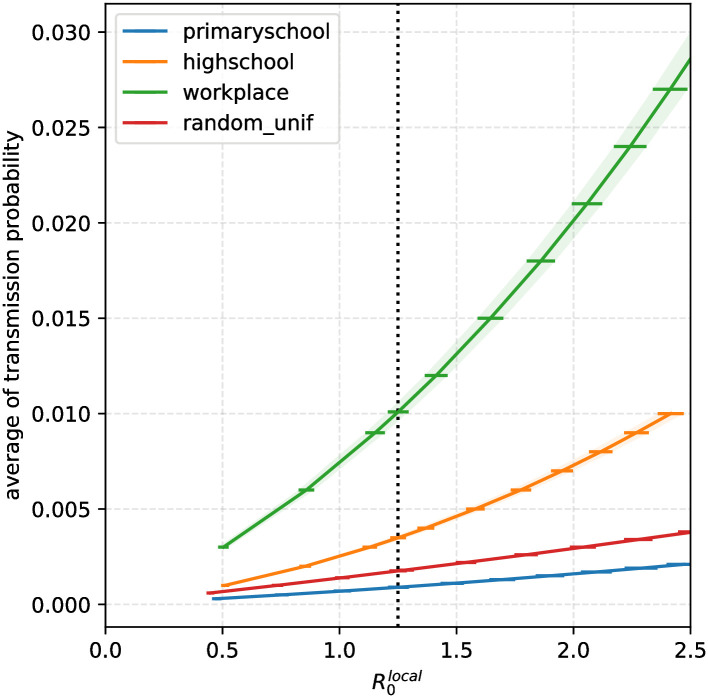
The COVID-19 epidemic has forced most countries to impose contact-limiting restrictions at workplaces, universities, schools, and more broadly in our societies. Yet, the effectiveness of these unprecedented interventions in containing the virus spread remain largely unquantified. Here, we develop a simulation study to analyze COVID-19 outbreaks on three real-life contact networks stemming from a workplace, a primary school and a high school in France. Our study provides a fine-grained analysis of the impact of contact-limiting strategies at workplaces, schools and high schools, including: (1) Rotating strategies, in which workers are evenly split into two shifts that alternate on a daily or weekly basis; and (2) On-Off strategies, where the whole group alternates periods of normal work interactions with complete telecommuting. We model epidemics spread in these different setups using a stochastic discrete-time agent-based transmission model that includes the coronavirus most salient features: super-spreaders, infectious asymptomatic individuals, and pre-symptomatic infectious periods. Our study yields clear results: the ranking of the strategies, based on their ability to mitigate epidemic propagation in the network from a first index case, is the same for all network topologies (workplace, primary school and high school). Namely, from best to worst: Rotating week-by-week, Rotating day-by-day, On-Off week-by-week, and On-Off day-by-day. Moreover, our results show that below a certain threshold for the original local reproduction number [Formula: see text] within the network (< 1.52 for primary schools, < 1.30 for the workplace, < 1.38 for the high school, and < 1.55 for the random graph), all four strategies efficiently control outbreak by decreasing effective local reproduction number to [Formula: see text] < 1. These results can provide guidance for public health decisions related to telecommuting.


Conflict of interest statement

I have read the journal’s policy and the authors of this manuscript have the following competing interests: L.O. has received research funding from Pfizer (through her research unit) on research related to meningococcal epidemiology and antimicrobial resistance. All other authors have declared that no competing interests exist.

Figures

Fig 1
Fig 1. Contact graphs.
(a-c) Three one-day contact networks in (a) a primary school with 242 students, (b) a workplace with 217 workers, (c) a high school with 327 students. Node colors correspond to known groups (classes or department). We see that the majority of contacts happen within groups. (d) A synthetic random graph with 9 groups selected randomly.
Fig 2
Fig 2. The infection model for SARS-CoV-2.
The incubation (Exposed, green) lasts on average 3.7 days [–13] and is followed by an infectious period (Infectious, orange) of 9.5 days on average, consisting of a presymptomatic period of average 1.5 days [11] followed by a symptomatic period of average 8 days [14]. We assume that symptomatic individuals self-isolate after one day of symptoms, while asymptomatic individuals (40% of the infected [15]) do not isolate.
Fig 3
Fig 3. Comparison of the effects on SARS-CoV-2 outbreak of containment strategies implemented in the contact graph of a high school when R0local=1.25.
The three panels respectively correspond to three relevant metrics: (top) the probability that at least 5 people are infected besides patient 0 (which we define as ‘Outbreak’ event); (middle) the average number of days until 5 people are infected besides patient 0, conditioned on the occurrence of outbreak; (bottom) the average total number of people infected in the population in case of outbreak. That number is a random variable that has a large standard deviation, but with probability 95% its expectation lies within the error bars.
Fig 4
Fig 4. Impact of the strategies for the high school contact graph.
The x-coordinate gives the value of the baseline reproduction number R0local (mean number of persons infected by index case). For each strategy the y-coordinate gives the mean value of the effective reproduction number as a result of using the strategy. Thus, for our baseline value R0local=1.25 (dotted vertical line), doing nothing leads to Re = 1.25 > 1, whereas, as long as R0local<1.38, all strategies lead to Re < 1. For each curve, the shaded areas correspond to 95% confidence intervals on the estimate of R0local (calculated as a function of the model parameters: horizontal error bar) and on the estimate of Re (as a function of the strategy: vertical error bar).
Fig 5
Fig 5. Epidemic propagation in the high school contact graph for different strategies.
Each panel corresponds to an example simulation for a given strategy; strategies are sorted as by their effectiveness, from no strategy to full telecommuting. In each panel, the horizontal axis corresponds to time (day of infection) and each white or gray column corresponds to one week. The vertical axis shows the prevalence (percentage of infectious persons among the students), its evolution is plotted in grey. The epidemic propagation is shown as a tree, where each node represents an infected person and points to the persons it infects. Nodes corresponding to symptomatic (resp. asymptomatic) persons are circled in blue (resp. red). Similarly a blue (resp. red) arrow corresponds to a contamination by a symptomatic (resp. asymptomatic) person. The thickness of arrows indicates the super-spreading factor. The node color corresponds to the group of the person (class or department). The node size is linear in its degree in the graph. All the propagation trees are generated using the same realizations of the probabilistic events (run 15978 in our simulations), so that the differences between the trees are not artifacts of their randomness, but solely depend on the different strategies in place.
Fig 6
Fig 6. Impact of strategies on outbreak probability in a partially immunized population subject to the circulation of variants, simulated in the high school contact network.
In our baseline scenario with no strategy, the probability of outbreak equals 27.2%. Each row reproduces results under specific strategies. In the left column, we study the sensitivity of this quantity with respect to potential variants showing increased transmission capacity compared to the reference strain (multiplicative factor on the y-axis), by assuming that such variants would circulate in partially immune populations (percentage of immune people on the x-axis); immune people do not get infected nor transmit the virus. In the right column, we study the sensitivity with respect to vaccination: we assume that 40% of the population is partially immune and that partially immune individuals are less likely to be infected and to contaminate others when infected. On the x-axis, we vary the relative probability of becoming infected and, on the y-axis, the relative probability of transmission by an infected partially immune individual. These results assume that patient 0 is never immune.
Fig 7
Fig 7. Relation between the baseline transmission parameter p0 and the network-dependent local reproduction number R0local for our four contact networks.
We see that each curve is monotone increasing, as expected, but that the dependency is not quite linear.

References

    1. Giordano G, Blanchini F, Bruno R, Colaneri P, Di Filippo A, Di Matteo A, et al.. Modelling the COVID-19 epidemic and implementation of population-wide interventions in Italy. Nature Medicine. 2020; 1–6. doi: 10.1038/s41591-020-0883-7 - DOI - PMC - PubMed
    1. Malani A, Soman S, Asher S, Novosad P, Imbert C, Tandel V, et al. Adaptive control of COVID-19 outbreaks in India: Local, gradual, and trigger-based exit paths from lockdown. National Bureau of Economic Research; 2020.
    1. Ely J, Galeotti A, Steiner J. Rotation as Contagion Mitigation. CEPR Discussion Paper No DP14953. 2020.
    1. Casella F. Can the COVID-19 Epidemic Be Controlled on the Basis of Daily Test Reports? IEEE Control Systems Letters. 2021;5(3):1079–1084. doi: 10.1109/LCSYS.2020.3009912 - DOI
    1. Della Rossa F, Salzano D, Di Meglio A, De Lellis F, Coraggio M, Calabrese C, et al.. A network model of Italy shows that intermittent regional strategies can alleviate the COVID-19 epidemic. Nature Communications. 2020;11(1):1–9. doi: 10.1038/s41467-020-18827-5 - DOI - PMC - PubMed

Publication types

MeSH terms