. 2021 Aug 26;16(8):e0256201.
doi: 10.1371/journal.pone.0256201. eCollection 2021.

Racial and ethnic disparities in "stop-and-frisk" experience among young sexual minority men in New York City

Affiliations

Racial and ethnic disparities in "stop-and-frisk" experience among young sexual minority men in New York City

Maria R Khan et al. PLoS One. .

Abstract

Although racial/ethnic disparities in police contact are well documented, less is known about other dimensions of inequity in policing. Sexual minority groups may face disproportionate police contact. We used data from the P18 Cohort Study (Version 2), a study conducted to measure determinants of inequity in STI/HIV risk among young sexual minority men (YSMM) in New York City, to measure across-time trends, racial/ethnic disparities, and correlates of self-reported stop-and-frisk experience over the cohort follow-up (2014-2019). Over the study period, 43% reported stop-and-frisk with higher levels reported among Black (47%) and Hispanic/Latinx (45%) than White (38%) participants. Stop-and-frisk levels declined over follow-up for each racial/ethnic group. The per capita rates among P18 participants calculated based on self-reported stop-and-frisk were much higher than rates calculated based on New York City Police Department official counts. We stratified respondents' ZIP codes of residence into tertiles of per capita stop rates and observed pronounced disparities in Black versus White stop-and-frisk rates, particularly in neighborhoods with low or moderate levels of stop-and-frisk activity. YSMM facing the greatest economic vulnerability and mental disorder symptoms were most likely to report stop-and-frisk. Among White respondents levels of past year stop-and-frisk were markedly higher among those who reported past 30 day marijuana use (41%) versus those reporting no use (17%) while among Black and Hispanic/Latinx respondents stop-and-frisk levels were comparable among those reporting marijuana use (38%) versus those reporting no use (31%). These findings suggest inequity in policing is observed not only among racial/ethnic but also sexual minority groups and that racial/ethnic YSMM, who are at the intersection of multiple minority statuses, face disproportionate risk. Because the most socially vulnerable experience disproportionate stop-and-frisk risk, we need to reach YSMM with community resources to promote health and wellbeing as an alternative to targeting this group with stressful and stigmatizing police exposure.


Conflict of interest statement

The authors have declared that no competing interests exist.

Figures
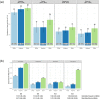
Fig 1
Fig 1
a. Race differences in past year stop-and-frisk prevalence of past year stop-and-frisk* among P18 participants over cohort follow-up (2014–2019; N = 591 at baseline). *P18 questionnaire item: “How many times have you been stopped, questioned, and/or frisked in the past year?” We coded a dichotomous indicator of any prior stop-and-frisk in the past year. In the sample overall, 32.3% reported being stopped-and-frisk at baseline and 21.5% reported being stopped-and-frisked at least once over the course of the follow-up. b. Race differences in past year stop-and-frisk rate* among P18 participants over cohort follow-up (above bar chart) and unadjusted rate ratios (RRs) and 95% confidence intervals (CIs) for associations between race and stop-and-frisk rate (below table) (2014–2019; N = 591 at baseline). *P18 questionnaire item: “How many times have you been stopped, questioned, and/or frisked in the past year?” P18 rates were calculated as the race-specific number of stop-and-frisk events reported by P18 participants/race-specific P18 study population times 1,000. Note: Rate among Black P18 participants at the 36-month visit was driven by a high stop rate among one participant (66 stops in the past year); when this participant was excluded from the analysis the stop rate was reduced to 0.5 from 0.9 among the remaining participants.
Fig 2
Fig 2. Stop-and-frisk rate per 1,000 population* reported by P18 participants vs recorded by the New York City Police Department (NYPD), by race.
*P18 rates were calculated as the race-specific number of stop-and-frisk events reported by P18 participants/race-specific P18 study population. These were compared to rates in the general population, calculated as the race-specific number of stop-and-frisk events recorded by the New York City Police Department/race-specific American Community Survey New York City population estimates. Note: Rate among Black P18 participants at the 36-month visit was driven by a high stop rate among one participant (66 stops in the past year); when this participant was excluded from the analysis the stop rate was reduced to 58.6 per 1,000.
Fig 3
Fig 3. Geographic distribution of past year stop-and-frisk among P18 participants at cohort baseline, by race: P18 participants are mapped by participant ZIP code of residence.
Those with a history of stop-and-frisk are indicated by red circles (White race), green circles (Hispanic/Latinx race/ethnicity), blue circles (Black race) with increasing circle size indicating increasing number of stop-and-frisk events, while those with no stop-and-frisk history are indicated by Black circles.
Fig 4
Fig 4. Race differences in past year stop-and-frisk rate among P18 participants at cohort baseline in 2014 by neighborhood-level stop-and-frisk rate (counts/1000)*.
*P18 participants were categorized according to their neighborhood-level stop-and-frisk rate, which were calculated as followed. Participant’s ZIP code was translated to latitude and longitude, which was then used to identify the New York City Police Department (NYPD) precinct in which the respondent lived (total of 77 possible precincts). NYPD precinct-level stop-and-frisk rates were calculated as the 2014 NYPD recorded number of stop-and-frisk events divided by the precinct population of male residents aged 20–29 years old; restricted given the younger age range of the P18 sample. The population estimates for New York City were calculated from 2014 estimates from the 2010–2014 5-year American Community Survey; population estimates for each census tract of New York City were calculated after restricting the sample to males aged 20–29 years. Each of the 77 precincts were categorized into group groups based on the precinct-level stop-and-frisk tertile. Within each tertile indicating neighborhood-level stop-and-frisk, stop-and-frisk rates were calculated at the race-specific number of stop-and-frisk events reported by P18 participants/race-specific P18 study population.

References

    1. Daniels v. City of New York, (2003).
    1. Floyd et al., v. City of New York, (2013).
    1. Spitzer E. The New York City Police Department’s "Stop and Frisk" Practices: A Report to the People of the State of New York. 1999.
    1. Schneiderman ET. A Report on Arrests Arising from the New York City Police Department’s Stop-And-Frisk Practices. 2013.
    1. Kelling GL, Wilson JQ. Broken Windows: The police and neighborhood safety. The Altantic. 1982:29–36.

Publication types