

Genotypic and phenotypic diversity of Mycobacterium tuberculosis complex genotypes prevalent in West Africa
- PMID: 34437584
- PMCID: PMC8389432
- DOI: 10.1371/journal.pone.0255433
Genotypic and phenotypic diversity of Mycobacterium tuberculosis complex genotypes prevalent in West Africa
Abstract
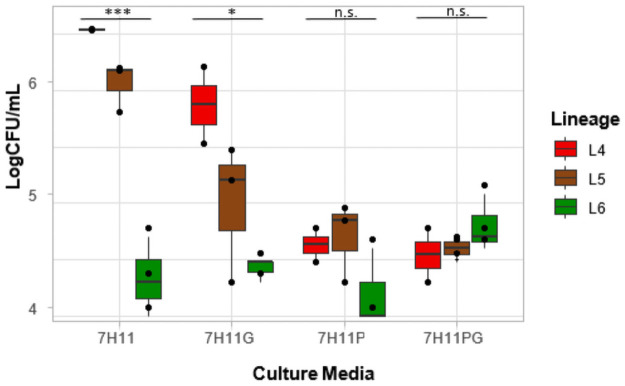
Findings from previous comparative genomics studies of the Mycobacterium tuberculosis complex (MTBC) suggest genomic variation among the genotypes may have phenotypic implications. We investigated the diversity in the phenotypic profiles of the main prevalent MTBC genotypes in West Africa. Thirty-six whole genome sequenced drug susceptible MTBC isolates belonging to lineages 4, 5 and 6 were included in this study. The isolates were phenotypically characterized for urease activity, tween hydrolysis, Thiophen-2-Carboxylic Acid Hydrazide (TCH) susceptibility, nitric oxide production, and growth rate in both liquid (7H9) and solid media (7H11 and Löwenstein-Jensen (L-J)). Lineage 4 isolates showed the highest growth rate in both liquid (p = 0.0003) and on solid (L-J) media supplemented with glycerol (p<0.001) or pyruvate (p = 0.005). L6 isolates optimally utilized pyruvate compared to glycerol (p<0.001), whereas L5 isolates grew similarly on both media (p = 0.05). Lineage 4 isolates showed the lowest average time to positivity (TTP) (p = 0.01; Average TTP: L4 = 15days, L5 = 16.7days, L6 = 29.7days) and the highest logCFU/mL (p = 0.04; average logCFU/mL L4 = 5.9, L5 = 5.0, L6 = 4.4) on 7H11 supplemented with glycerol, but there was no significant difference in growth on 7H11 supplemented with pyruvate (p = 0.23). The highest release of nitrite was recorded for L5 isolates, followed by L4 and L6 isolates. However, the reverse was observed in the urease activity for the lineages. All isolates tested were resistant to TCH except for one L6 isolate. Comparative genomic analyses revealed several mutations that might explain the diverse phenotypic profiles of these isolates. Our findings showed significant phenotypic diversity among the MTBC lineages used for this study.
Conflict of interest statement
The authors have declared that no competing interests exist.
Figures


References
-
- WHO. Global Tuberculosis report. 2020.
-
- Velayati AA, Farnia P. Chapter 1—The Species Concept. In: Velayati AA, Farnia P, editors. Atlas of Mycobacterium Tuberculosis. Boston: Academic Press; 2017. p. 1–16.
MeSH terms
Substances
Grants and funding
LinkOut - more resources
Full Text Sources
