. 2021 Oct 12;54(10):2288-2304.e7.
doi: 10.1016/j.immuni.2021.08.002. Epub 2021 Aug 25.

Fate mapping of single NK cells identifies a type 1 innate lymphoid-like lineage that bridges innate and adaptive recognition of viral infection

Affiliations

Fate mapping of single NK cells identifies a type 1 innate lymphoid-like lineage that bridges innate and adaptive recognition of viral infection

Sophie Flommersfeld et al. Immunity. .

Abstract

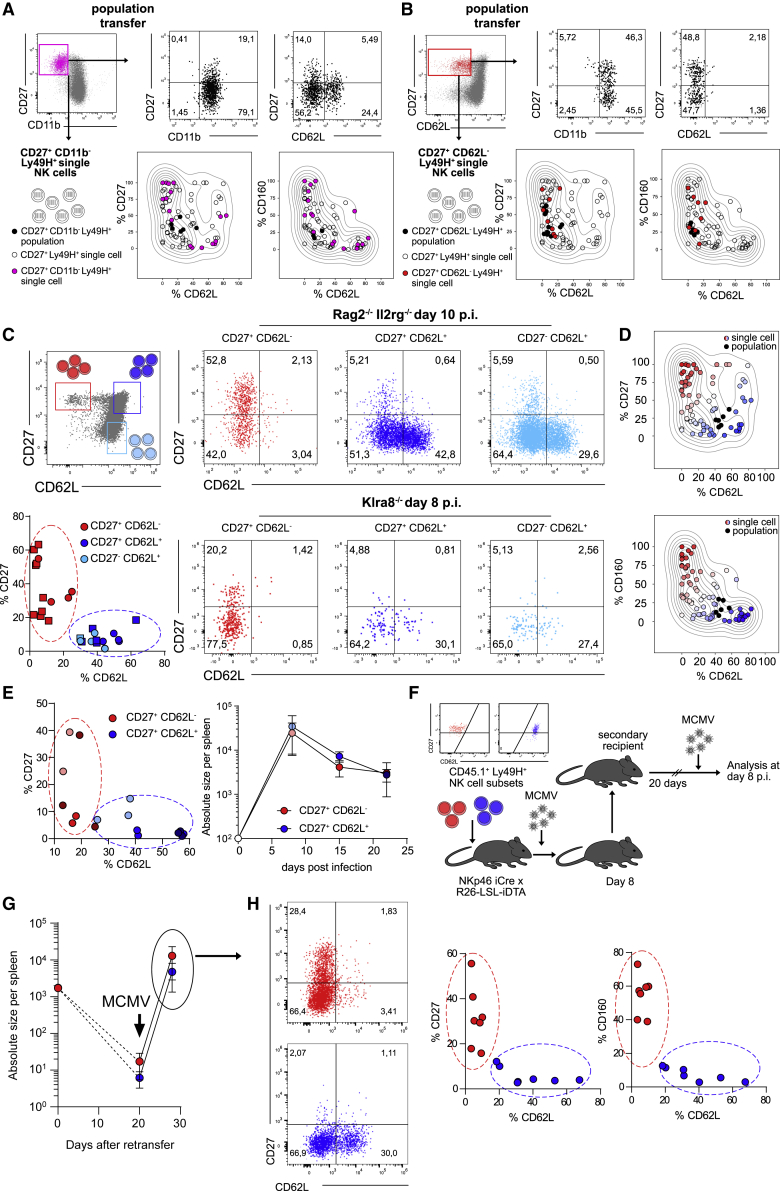
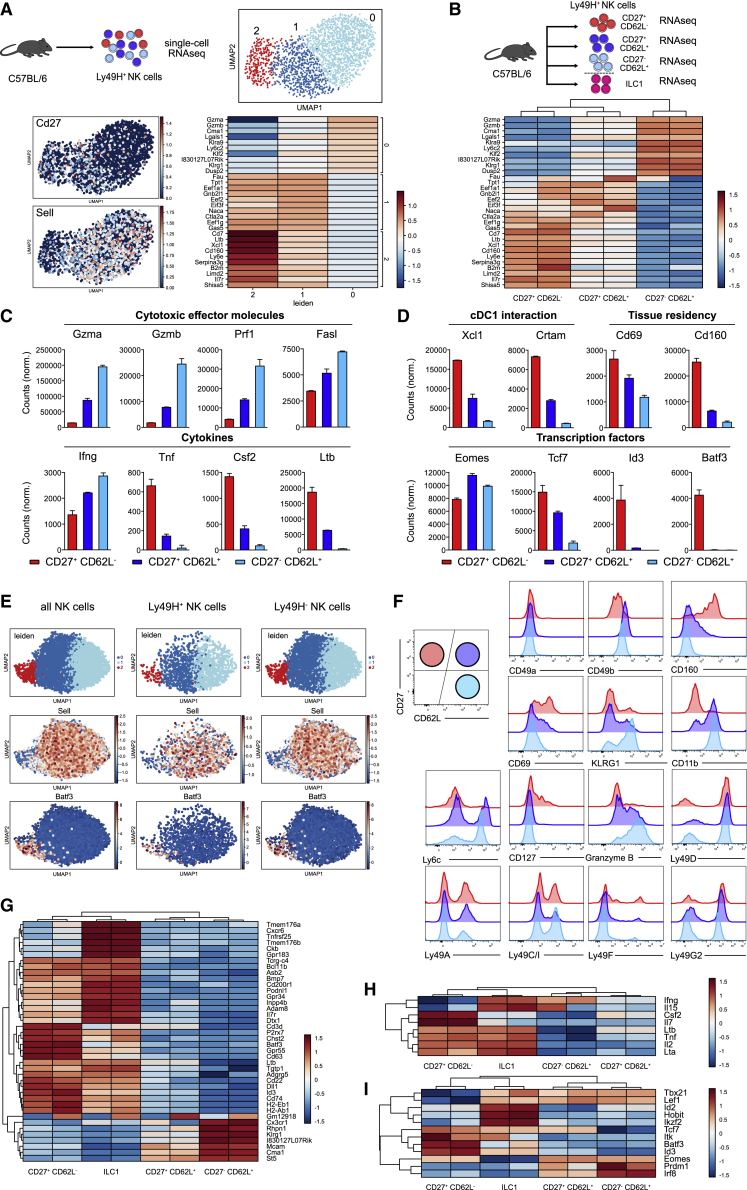
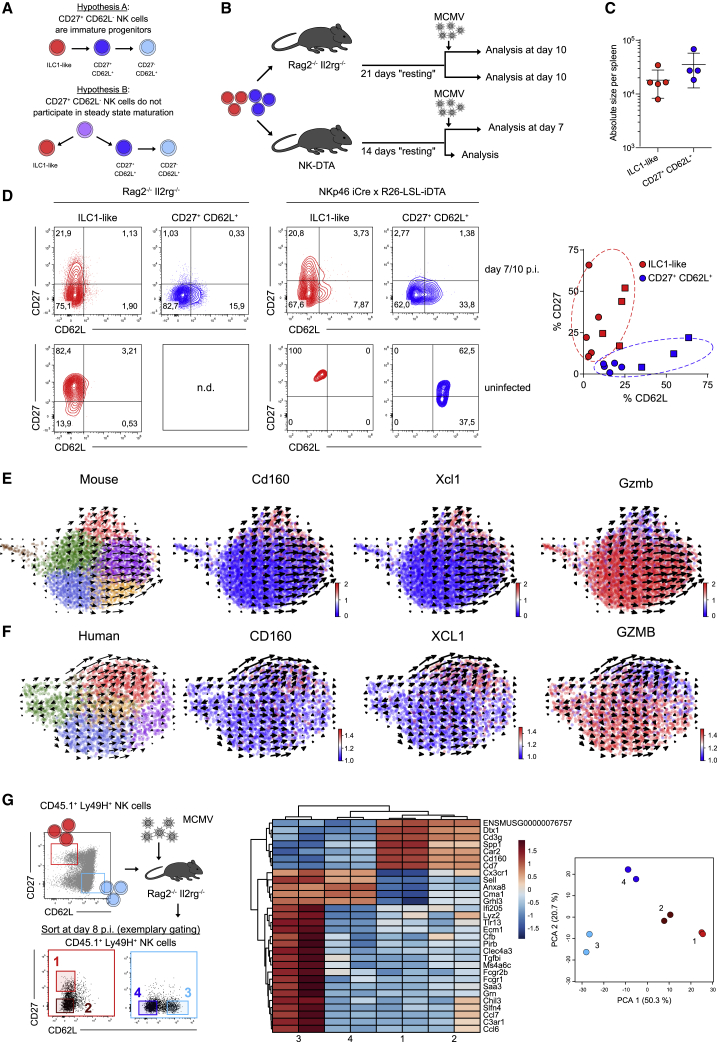
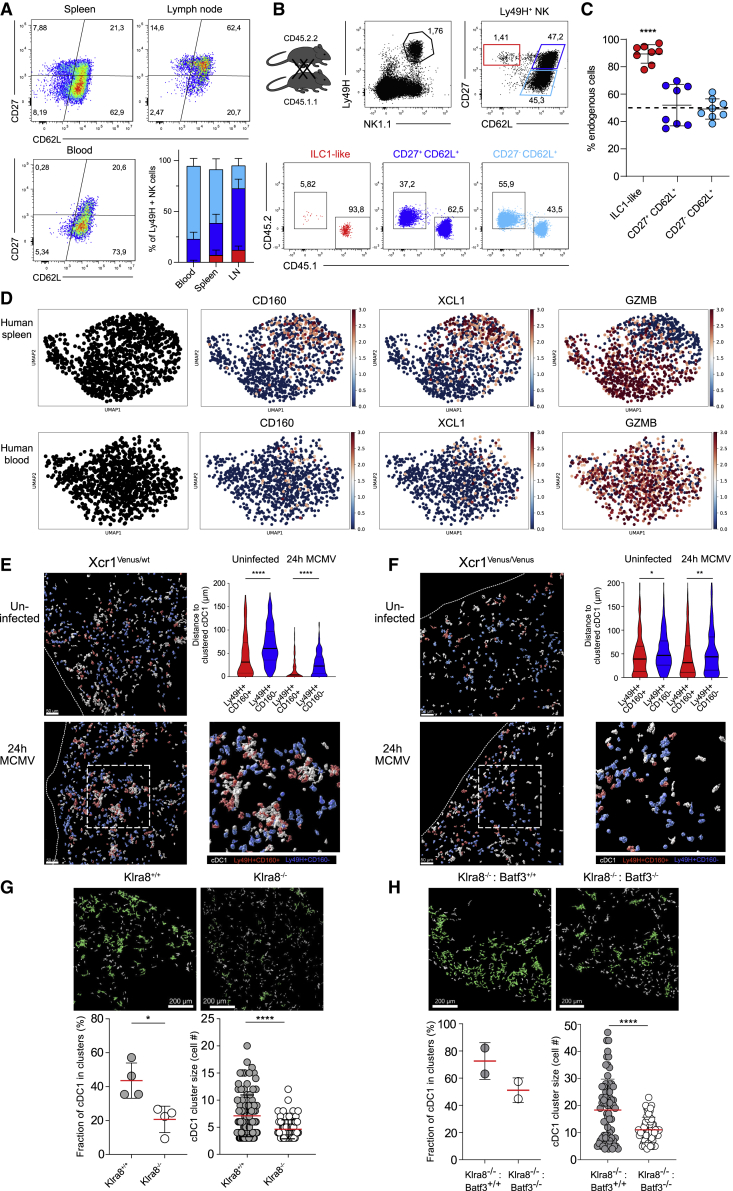
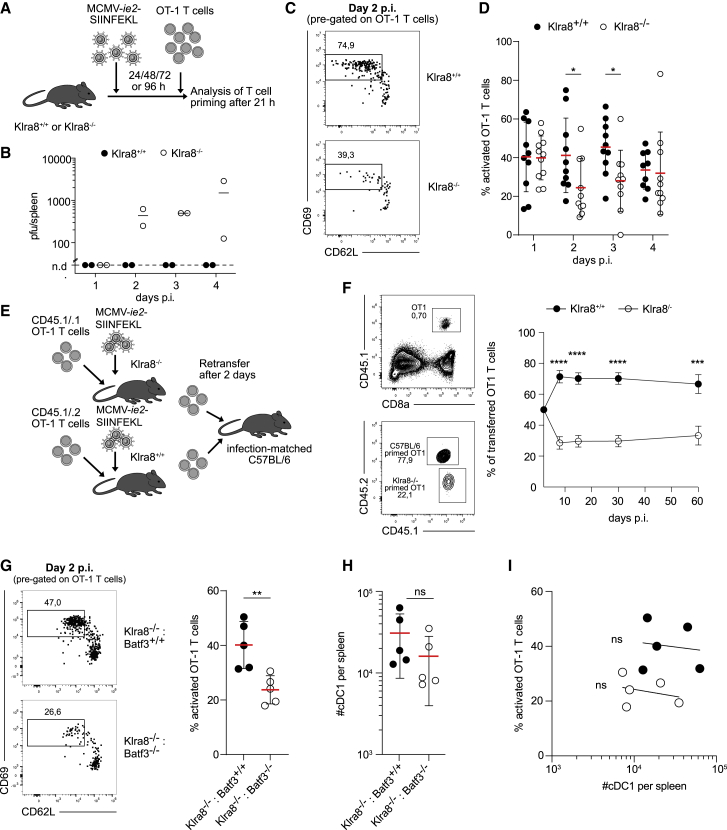
Upon viral infection, natural killer (NK) cells expressing certain germline-encoded receptors are selected, expanded, and maintained in an adaptive-like manner. Currently, these are thought to differentiate along a common pathway. However, by fate mapping of single NK cells upon murine cytomegalovirus (MCMV) infection, we identified two distinct NK cell lineages that contributed to adaptive-like responses. One was equivalent to conventional NK (cNK) cells while the other was transcriptionally similar to type 1 innate lymphoid cells (ILC1s). ILC1-like NK cells showed splenic residency and strong cytokine production but also recognized and killed MCMV-infected cells, guided by activating receptor Ly49H. Moreover, they induced clustering of conventional type 1 dendritic cells and facilitated antigen-specific T cell priming early during MCMV infection, which depended on Ly49H and the NK cell-intrinsic expression of transcription factor Batf3. Thereby, ILC1-like NK cells bridge innate and adaptive viral recognition and unite critical features of cNK cells and ILC1s.

Keywords: ILC1; ILC1-like NK cells; MCMV; NK cells; adaptive-like NK cell responses; single-cell fate mapping.


Conflict of interest statement

Declaration of interests The authors declare no competing interests.

Figures

None
Graphical abstract
Figure 1
Figure 1
Individual Ly49H+ NK cells follow two distinct paths of differentiation upon MCMV infection (A) 3 × 104 or 1 × 103 CD45.1+ Ly49H+ NK cells were adoptively transferred into Klra8–/– or Rag2–/– Il2rg–/– mice followed by infection of recipients with MCMV and analysis of expanded NK cell populations in spleen at day 7 or 8 post infection (p.i.), respectively. (B) Representative dot plots show marker expression by transferred Ly49H+ NK cells in Klra8–/– recipients at day 7 p.i. (C) As in (B) but in Rag2–/– Il2rg–/– recipients at day 8 p.i. (D) Representative dot plots show marker expression by transferred CD27+ Ly49H+ NK cells in Rag2–/– Il2rg–/– recipients at day 8 p.i. (E–G) Multiplexed adoptive transfer of single color-barcoded CD27+ Ly49H+ NK cells into Rag2–/– Il2rg–/– mice, followed by infection of recipients with MCMV and analysis of expanded NK cell clones in spleen at day 8 p.i. (E) Schematic depiction. (F) Absolute size of NK cell responses derived from single or 100 transferred cells. (G) Representative dot plots and histograms depicting marker expression of NK cell clones that either lacked (red) or contained (blue) CD62L expressing cells. Endogenous Ly49H+ NK cell population is shown in the gray histogram. Data in (B), (C), and (D) are representative of at least two independent, similar experiments. Data in (F) are pooled from seven independent, similar experiments. Lines indicate mean, and error bars represent SD. Data in (G) are representative of four independent experiments. In (B): n = 2–4, in (C), (D): n = 3 mice per group per experiment, in (F): n = 82 NK cell clones from 6–12 recipient mice per experiment, (G): n = 54 NK cell clones from 6–12 recipient mice per experiment. See also Figure S1.
Figure 2
Figure 2
CD62L NK cell clones originate from a defined NK cell subset (A) Adoptive transfer of Ly49H+CD27+CD11b NK cell populations or multiplexed adoptive transfer of single color-barcoded Ly49H+CD27+CD11b NK cells into Klra8–/– or Rag2–/– Il2rg–/– recipients followed by MCMV infection and analysis in spleen at day 7 or 8 p.i., respectively. Representative dot plots (upper panels) show phenotype of population-derived responses. Kernel density estimate (KDE) plots (lower panels) show percentage of CD27, CD62L, and CD160 expressing cells within population-derived responses (black dots) or within NK cell clones derived from all Ly49H+CD27+ single cells (circles) or specifically from Ly49H+CD27+CD11b single cells (filled pink circles). (B) As in (A) but adoptive transfer of Ly49H+CD27+CD62L NK cells. Of note: NK cell clones derived from Ly49H+CD27+CD62L single cells (filled red circles) uniformly lack CD62L expressing cells. (C) CD27+CD62L, CD27+CD62L+,and CD27CD62L+ populations of Ly49H+ NK cells were adoptively transferred into Klra8–/– or Rag2–/– Il2rg–/– recipients followed by MCMV infection and analysis in spleen at day 8 and 10 p.i., respectively. Schematic dot plot depicts sort gating (upper left panel). Dot plots depict marker expression within expanded NK cell populations (right panels). Scatterplot depicts frequency of CD27 and CD62L expressing cells within expanded populations at day 8/10 p.i. in Klra8–/– (squares) and Rag2–/– Il2rg–/– recipients (circles) (lower left panel). (D) KDE plots show expression of CD27, CD62L, and CD160 within NK cell responses derived from Ly49H+CD27+ populations (black dots) or from single cells sorted as Ly49H+CD27+, Ly49H+CD27+CD11b,or Ly49H+CD27+CD62L (circles). Red versus blue color coding delineates clones containing high versus low percentages of CD62L and low versus high percentages of CD27 and CD160 expressing cells. (E) CD27+CD62L and CD27+CD62L+ populations of Ly49H+ NK cells were sorted and adoptively transferred into NKp46 iCre x R26-LSL-iDTA recipients, followed by MCMV infection and analysis of expanded populations in spleen at day 8, 15, and 22 p.i. Scatterplot depicts frequency of CD27 and CD62L expressing cells within expanded populations at day 8 (light red/blue), 15 (bright red/blue), and 22 (dark red/blue) (left panel). Absolute size of expanded NK cell populations are depicted in the right panel. (F–H) CD27+CD62L and CD27+CD62L+ populations of Ly49H+ NK cells were sorted and adoptively transferred into NKp46 iCre x R26-LSL-iDTA recipients. At day 8 p.i. with MCMV 1,5–2 × 103 CD45.1+ Ly49H+ NK cells derived from either subset were sorted from spleens of primary recipients, re-transferred into uninfected Rag2–/–Il2rg–/– mice, rested for 20 days, and analyzed before or 8 days after secondary exposure to MCMV. (F) Initial sort purity and schematic depiction. (G) Absolute size of re-transferred NK cell populations at indicated time points. (H) Representative flow cytometry plots (left) and scatterplots depicting frequency of marker expressing cells within expanded populations at day 8 after recall infection (right). Population data in (A) and (B) are representative of at least two independent experiments. Single cell data in (A) and (B) are pooled from two to three independent experiments. Data in (C) are pooled from five, and data in (D) from seven independent experiments. Data in (E) are representative of three independent experiments. Data in (G) and (H) are pooled from two independent experiments. Dots represent mean, and error bars indicate SD. In (A–C), (E), (G),and (H) n = 3, 2–4, 2–4, 2–3, and 3–4 mice per population-based experiment. In (A), (B), and (D) n = 22, 8, and 76 NK cell clones from 6–12 recipient mice per experiment. See also Figure S2.
Figure 3
Figure 3
Steady-state CD27+CD62L NK cells show a distinct transcriptional profile that partially overlaps with that of ILC1s (A) During the steady state, splenic Ly49H+ NK cells were sorted for transcriptome analysis by single-cell RNA sequencing (scRNA-seq). UMAP-based Leiden clustering of scRNA-seq data is represented in the upper right panel. Relative expression of CD27 and CD62L in UMAP projection (lower left panel) and heatmap of top 10 genes defining each cluster are represented in the lower right panel. (B) CD27+CD62L, CD27+CD62L+, and CD27CD62L+ populations of Ly49H+ NK cells as well as ILC1s (defined as CD19/CD3/TCRα/β NK1.1+ CD27+ CD62L, Ly49A/CI/G2 negative) were sorted from spleens of C57BL/6 mice for bulk RNA-seq (upper panel). Expression of top 10 cluster defining genes from scRNA-seq in bulk RNA-seq data of sorted populations are represented in the lower panel. (C and D) Bar graphs depict mRNA normalized counts of indicated genes in sorted NK cell populations. (E) UMAP-based Leiden clustering of scRNA-seq transcriptomes and relative expression of Sell and Batf3 in UMAP projection for all, Ly49H+ and Ly49H NK cells sorted from Eomes-GFP reporter as CD19/CD3/TCRg/d NK1.1+ Eomes-GFP+ and identified via hashtag antibody staining. (F) Histograms show flow-cytometric detection of various markers in CD27+CD62L, CD27+CD62L+, and CD27CD62L+ subsets of Ly49H+ splenic NK cells. (G) Bulk RNA expression profile of NK cell subsets compared to ILC1s. Depicted are the 40 most variable genes. (H and I) As in (G) but comparing expression of selected (H) cytokines and (I) transcription factors. Data in (A)–(D) and (F)–(I) are representative of two independent experiments. See also Figures S3 and S4.
Figure 4
Figure 4
ILC1-like NK cells show enhanced cytokine production but also target-specific cytotoxicity (A) Ly49H+ NK cells were sorted into CD27+CD62L (ILC1-like), CD27+CD62L+, and CD27CD62L+ subsets and stimulated with PMA and ionomycin. Representative histograms show IFN-γ, TNF-α, and GM-CSF production of sorted NK cell subsets and unstimulated Ly49H+ NK cells as negative control. (B) Bar graph depicts subset-specific cytokine production normalized to that of stimulated bulk Ly49H+ NK cells within the same experiment. (C and D) C57BL/6 mice were infected with MCMV or left uninfected. Splenocytes were harvested 24 h later and stimulated with plate-bound aNK1.1 antibodies or left unstimulated. (C) Representative dot plots and (D) bar graph show IFN-ɣ production of Ly49H+ NK cell subsets. (E and F) Ly49H+ NK cells sorted into ILC1-like and CD27+CD62L+ populations and co-incubated for 24 h with Ba/F3 (WT) and Ba/F3-m157 cells. (E) Dot plots show sort purity, and histograms show Ly49H expression profile. (F) Bar graph depicts Ly49H geometric mean fluorescence intensity (MFI). (G) Color-barcode (left panel) and representative anti-Granzyme B staining (right panel) of Ly49H+ NK cell clones derived from a single ILC1-like (red) or a single CD27+CD62L+ NK cell (blue) detected in spleens of Rag2–/– Il2rg–/– recipients at day 8 p.i. with MCMV. (H) Bar graph depicts average geometric MFI of anti-granzyme B staining in NK cell clones derived from ILC1-like versus CD27+CD62L+ NK cells. (I) Ly49H+ ILC1-like (red) and Ly49H+ CD27+CD62L+ NK cells (blue) were sorted from the spleen of C57BL/6 mice 24 h p.i. with MCMV and incubated with equal numbers of GFP+ RMA and BFP+ RMA-S cells for 42 h. Bar graph depicts normalized counts of RMA and RMA-S cells in the absence of NK cells (gray) and after co-incubation with the respective subsets. Data in (A), (C)–(G), and (I) are representative of two to three independent experiments. Data in (B) and (H) are pooled from three independent experiments. Bars indicate mean. Error bars represent SD. Significances in (B), (F), and (I) are calculated using two-way ANOVA, followed by Tukey’s multiple comparisons test. Significances in (D) are calculated using multiple t tests. Significances in (H) are calculated using Mann-Whitney test. In (C) and (D): n = 2 mice per group per experiment, in (H): n = 18 NK cell clones (4 derived from single ILC1-like NK cells, 14 derived from single CD27+CD62L+ NK cells) from 10–12 recipient mice per experiment.
Figure 5
Figure 5
ILC1-like NK cells do not serve as precursors of CD62L+ NK cells (A) Schemes depict two possible scenarios of NK cell differentiation. ILC1-like NK cells represent a transient, immature differentiation state (hypothesis A) or a separate lineage that does not participate in steady-state maturation (hypothesis B). (B–D) Ly49H+ NK cells were sorted into ILC1-like and CD27+CD62L+ populations and adoptively transferred into NKp46 iCre x R26-LSL-iDTA or Rag2–/– Il2rg–/– mice that were infected with MCMV 14 or 21 days later and analyzed at 7 or 10 days p.i., respectively. Uninfected controls were analyzed 14 (14+0) or 31 (21+10) days after initial adoptive transfer. (B) Schematic representation. (C) Absolute size of expanded ILC1-like and CD27+CD62L+ NK cell populations in Rag2–/– Il2rg–/– mice at day 10 p.i. (D) Representative contour plots show CD27 and CD62L expression profiles of NK cell populations at day 7 or 10 p.i. or in uninfected controls. Scatterplot depicts frequency of CD27 and CD62L expressing cells within expanded NK cell populations in NKp46 iCre x R26-LSL-iDTA (squares) and Rag2–/– Il2rg–/– mice (circles). (E) RNA velocities in scRNA-seq data of splenic Ly49H+ NK cells derived from retrogenic chimeras 4 weeks after HSC transfer. Colors indicate Leiden clustering (left panel) or relative expression of indicated genes (right panels). (F) As in (E) but scRNA-seq data of one human donor (blood and spleen) from (Crinier et al., 2018). (G) Ly49H+ NK cells were sorted into ILC1-like (red) and CD27CD62L+ (blue) populations and adoptively transferred into Rag2–/– Il2rg–/– recipients, followed by MCMV infection. Sub-compartments 1–4 with indicated expression of CD27 and CD62L were sorted from the expanded populations (red or blue) detected in spleen at day 8 p.i. Representative dot plots show sorting strategy. Heatmap depicts 30 most variable genes. Principal component analysis of transcriptome data from sorted sub-compartments 1–4. Data in (C) and (D) are pooled from two and four independent experiments, respectively. Data in (E) are representative of two independent experiments. In (C), (D), and (G): n = 2–3, 1–3, and 2 mice per group per experiment, respectively. See also Figure S5.
Figure 6
Figure 6
ILC1-like NK cells are spleen-resident and share a functional niche with cDC1s (A) Representative pseudocolor plots and stacked bar graphs show frequency of ILC1-like, CD27+CD62L+, and CD27CD62L+ NK cells among Ly49H+ NK cells in spleen, lymph nodes, and blood. (B) Spleens of CD45.1 and CD45.2 parabionts were analyzed 4 weeks after surgery by flow cytometry. Representative dot plots show gating of ILC1-like, CD27+CD62L+, and CD27+CD62L Ly49H+ NK cells and frequency of CD45.1 and CD45.2 cells within each subset. (C) Frequency of endogenous cells among Ly49H+ NK cell subsets in each parabiont. (D) scRNA-seq data from one human donor from (Crinier et al., 2018) showing expression of key marker genes CD160, XCL1, and GZMB. (E) Visualization of cDC1s, Ly49H+CD160+ NK cells, and Ly49H+CD160 NK cells in spleens of MCMV-infected or uninfected Xcr1Venus/wt mice by confocal microscopy. Depicted are three-dimensional objects corresponding to individual cells identified via histo-cytometry. Staining for NK1.1, Ly49H, and CD160 was used to identify NK cell subsets, and anti-GFP (cross-reactive with Venus) was used to identify cDC1s. Violin plot shows quantification of distances between CD160+ or CD160 Ly49H+ NK cells and clustered cDC1 with and without MCMV infection. A cDC1 cluster was defined as at least three cDC1s within a distance of ≤5μm (see STAR Methods and Figure S7A). (F) As in (E) but using XCR1-deficient Xcr1Venus/Venus mice. (G) Visualization of cDC1s (identified by staining for XCR1) in spleens of Klra8+/+ and Klra8–/– littermates 24 h p.i. (number of cDC1 per mm2: 249.6 in Klra8+/+, 325.0 in Klra8–/–). Clustered cDC1s are indicated in green. Fraction of cDC1s in clusters (each dot represents data for one spleen section) and cDC1 cluster sizes in Klra8+/+ and Klra8–/– mice are shown. (H) As in (G) but for Klra8–/–: Batf3+/+ and Klra8–/–: Batf3–/– mixed bone marrow chimeras (number of cDC1 per mm2: 241.5 in Klra8–/–: Batf3+/+, 258.2 in Klra8–/–: Batf3–/–). Data in (B), (E), and (G) are representative of two independent experiments. Data in (C) are pooled from two independent experiments. Lines represent mean, and error bars indicate SD. Significances in (C) were calculated using one-sample t test (hypothetical value = 50). Significances in (E) and (F) were calculated using Kruskal-Wallis test, followed by Dunn’s multiple comparisons analysis. Significances in (G) and (H) are calculated using Mann-Whitney test. In (A): n = 8 mice, in (B) and (C): n = 4 mice per experiment, in (E)–(G): n = 2 mice per group per experiment, and in (H): n = 1–2 mice per group. See also Figures S6 and S7.
Figure 7
Figure 7
Optimal CD8+ T cell priming upon MCMV infection depends on Ly49H and expression of Batf3 in ILC1-like NK cells (A) Klra8+/+ and Klra8–/– mice were infected with MCMV-ie2-SIINFEKL. 1 × 106 OT-1 T cells were adoptively transferred at 24, 48, 72, and 96 h p.i. and priming determined in spleen 21 h later. (B) MCMV titers in Klra8+/+ and Klra8–/– mice at indicated time points p.i. (C and D) Frequency of activated OT-1 T cells (defined as CD69+ CD62L) in spleens of infected Klra8+/+ and Klra8–/– mice. (C) Representative flow cytometry data. (D) Summary statistics. (E) 1 × 106 CD45.1/.1 and CD45.1/.2 OT-1 T cells were adoptively transferred into Klra8–/– and Klra8+/+ littermates, respectively, and subsequently infected with MCMV-ie2-SIINFEKL. At day 2 p.i., 100 CD45.1/.1 and 100 CD45.1/.2 OT-1 T cells were co-transferred into secondary infection-matched C57BL/6 recipients. (F) Representative contour plots show frequency of all CD45.1+ and fraction of CD45.1/.1 and CD45.1/.2 OT-1 T cells in peripheral blood of secondary recipients at day 30 p.i. Dot plot shows frequency of CD45.1/.1 and CD45.1/.2 cells among transferred OT-1 T cells over time. (G) As in (A), (C), and (D) on day 2 but performed in Klra8–/–: Batf3+/+ or Klra8–/–: Batf3–/– mixed chimeras. (H) Quantification of cDC1s in spleens of Klra8–/–: Batf3+/+ and Klra8–/–: Batf3–/– mixed chimeras. (I) Scatterplot shows no correlation between percentage of primed OT-1 T cells and number of cDC1s per host. Data in (C) are representative of five independent experiments. Data in (D) are pooled from five independent experiments. Lines represent mean, and error bars indicate SD. Data in (F) are pooled from four independent experiments. Dots represent mean, and error bars indicate SEM. Data in (G)–(I) are pooled from two independent experiments. Lines represent mean, and error bars indicate SD. Significances in (D) were calculated by multiple Mann-Whitney tests for each individual time point. Significances in (F) were calculated using multiple t tests, and statistical significance was determined using the Holm-Sidak method, with alpha = 5.0%. Significances in (G) and (H) were calculated by Mann-Whitney test. Correlation in (I) was measured as Spearman correlation. Line indicates non-linear fit. In (B): n = 2 mice per group, in (C), (D), and (G–(I): n = 2–3, and in (F): n = 3–6 mice per group per experiment.

Comment in

References

    1. Adams N.M., Geary C.D., Santosa E.K., Lumaquin D., Le Luduec J.B., Sottile R., van der Ploeg K., Hsu J., Whitlock B.M., Jackson B.T. Cytomegalovirus Infection Drives Avidity Selection of Natural Killer Cells. Immunity. 2019;50:1381–1390. - PMC - PubMed
    1. Adams N.M., Grassmann S., Sun J.C. Clonal expansion of innate and adaptive lymphocytes. Nat. Rev. Immunol. 2020;20:694–707. - PubMed
    1. Andrews D.M., Scalzo A.A., Yokoyama W.M., Smyth M.J., Degli-Esposti M.A. Functional interactions between dendritic cells and NK cells during viral infection. Nat. Immunol. 2003;4:175–181. - PubMed
    1. Arase H., Mocarski E.S., Campbell A.E., Hill A.B., Lanier L.L. Direct recognition of cytomegalovirus by activating and inhibitory NK cell receptors. Science. 2002;296:1323–1326. - PubMed
    1. Babić M., Pyzik M., Zafirova B., Mitrović M., Butorac V., Lanier L.L., Krmpotić A., Vidal S.M., Jonjić S. Cytomegalovirus immunoevasin reveals the physiological role of “missing self” recognition in natural killer cell dependent virus control in vivo. J. Exp. Med. 2010;207:2663–2673. - PMC - PubMed

Publication types