Review
. 2021 Oct:78:105728.
doi: 10.1016/j.ultsonch.2021.105728. Epub 2021 Aug 18.

Numerical simulations for sonochemistry

Affiliations
Review

Numerical simulations for sonochemistry

Kyuichi Yasui. Ultrason Sonochem. 2021 Oct.

Abstract

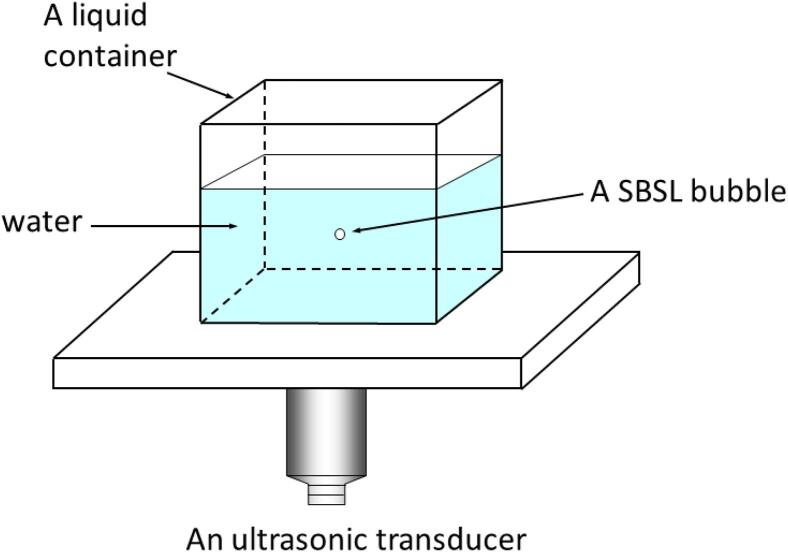
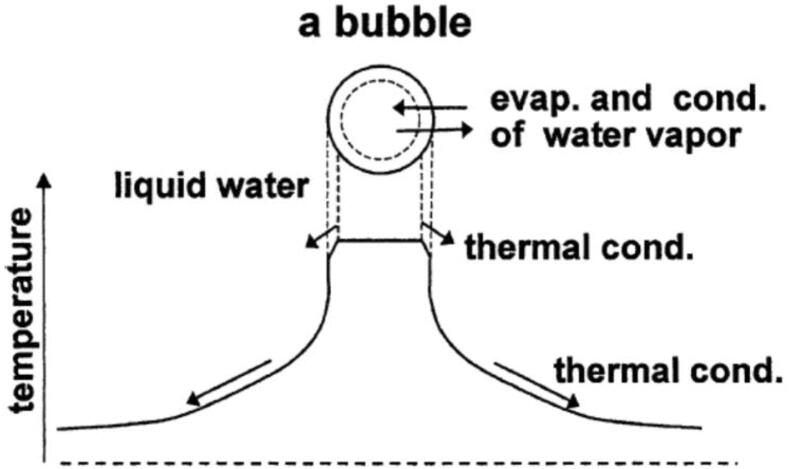
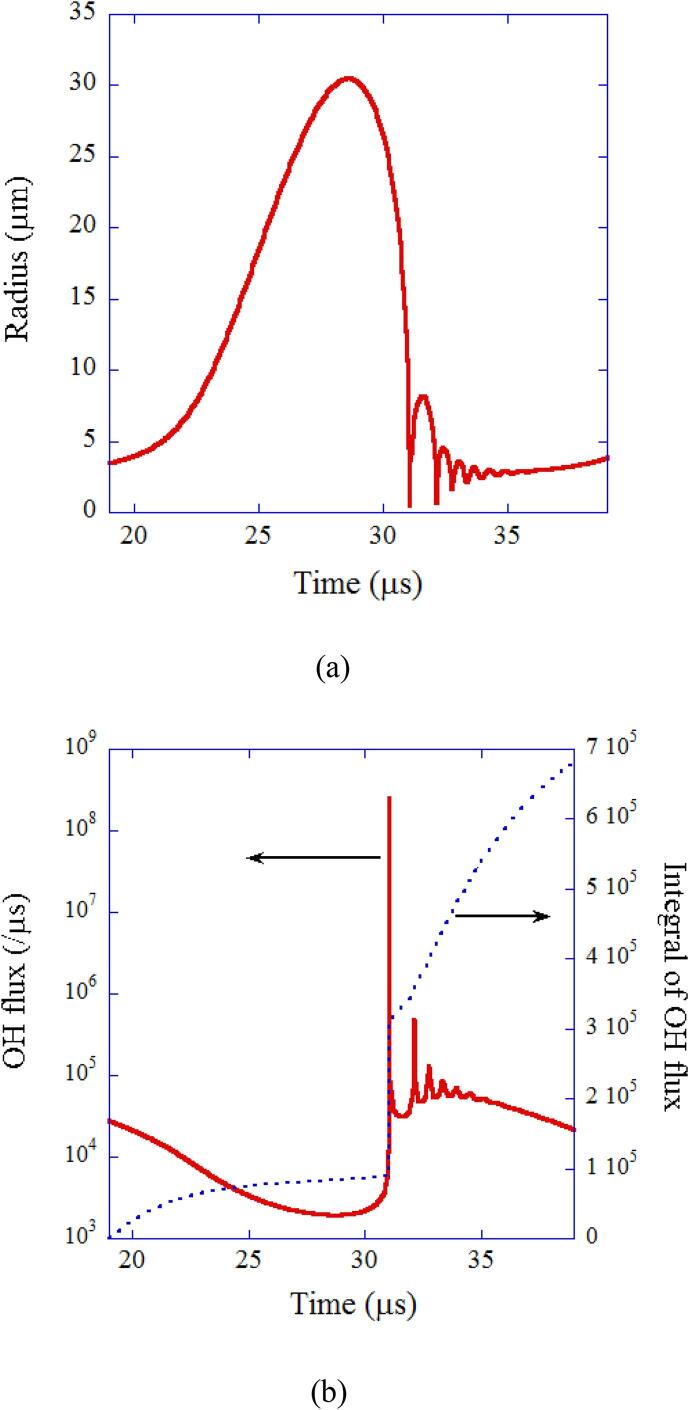
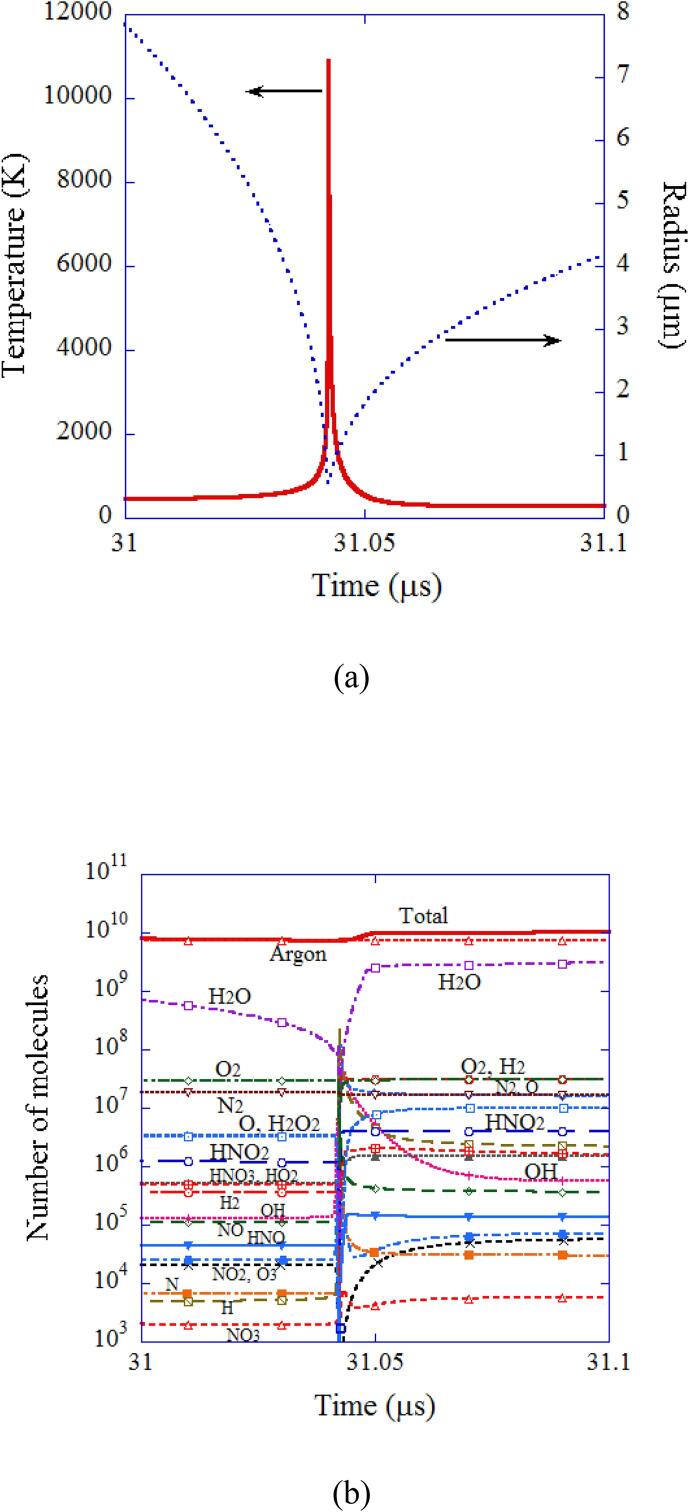
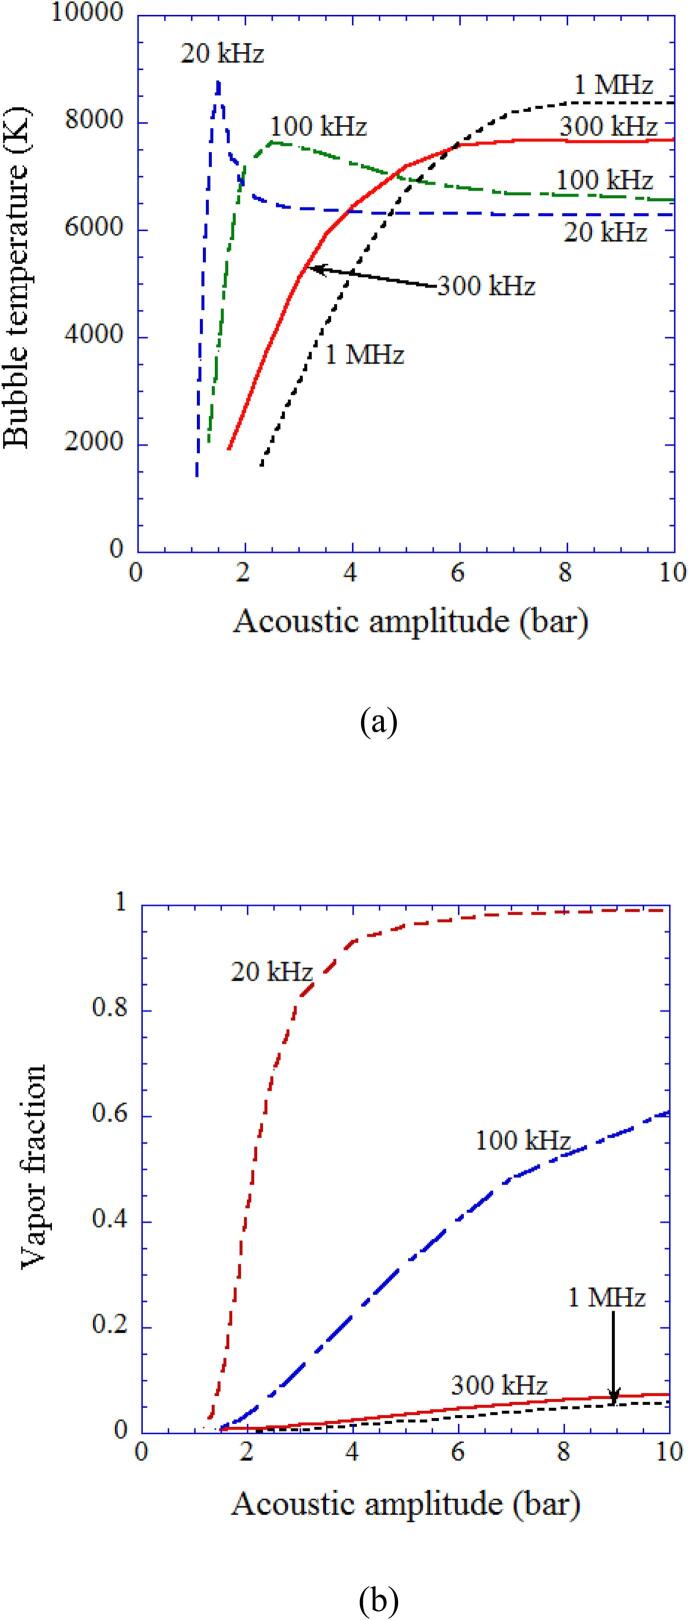
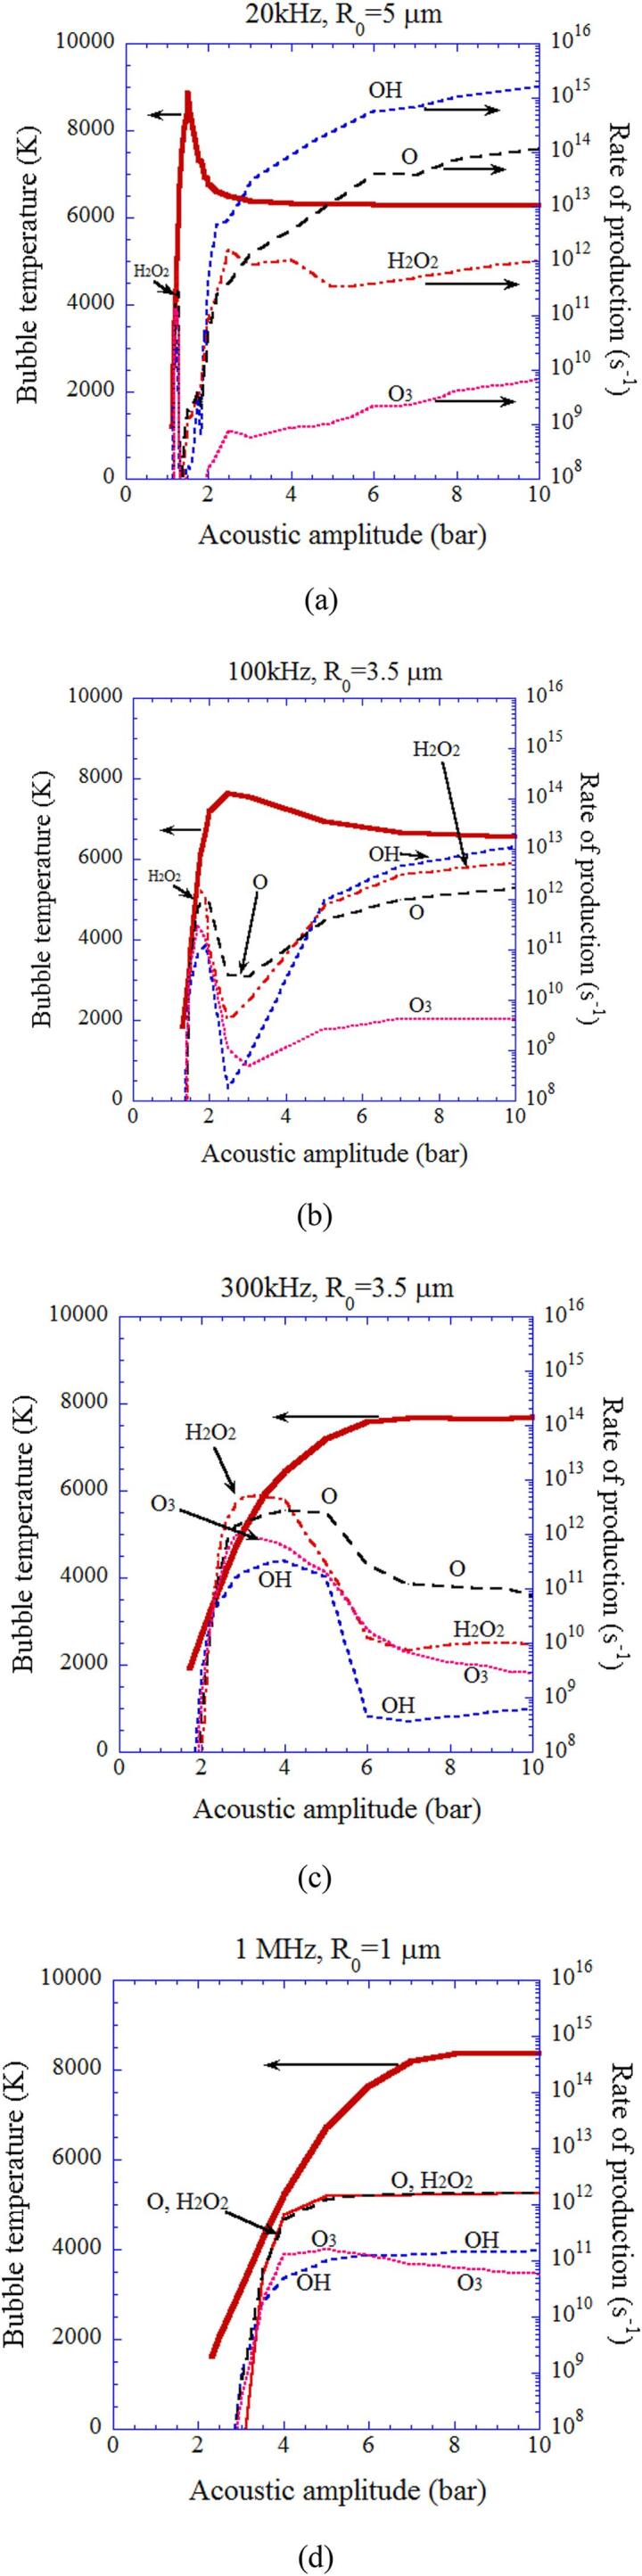
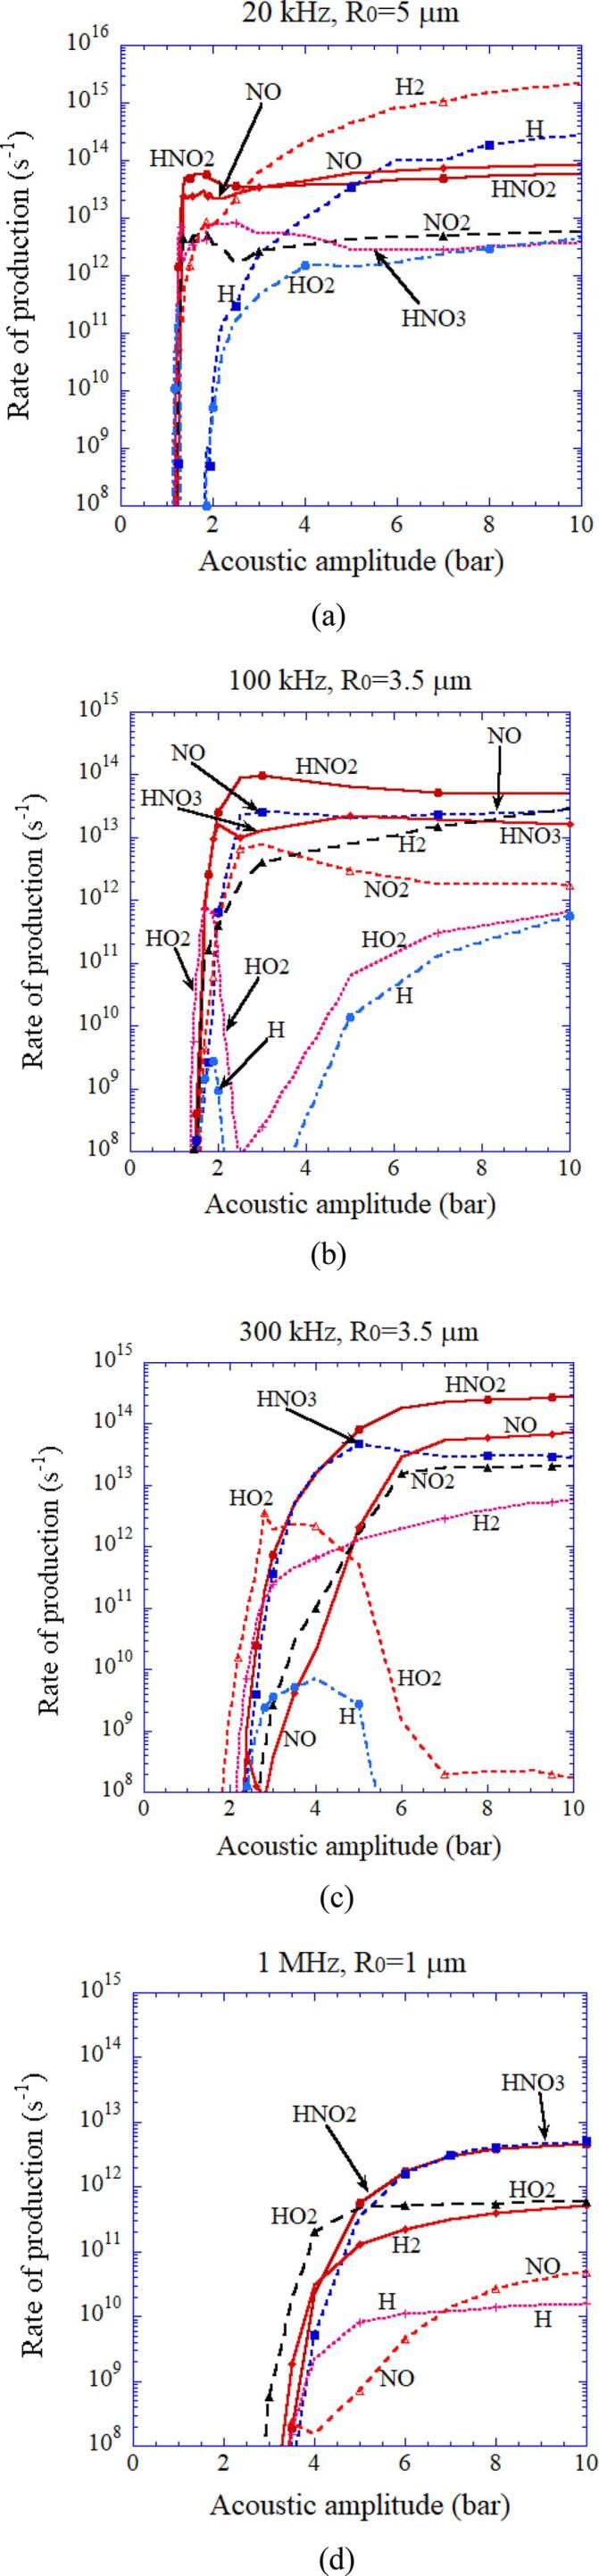
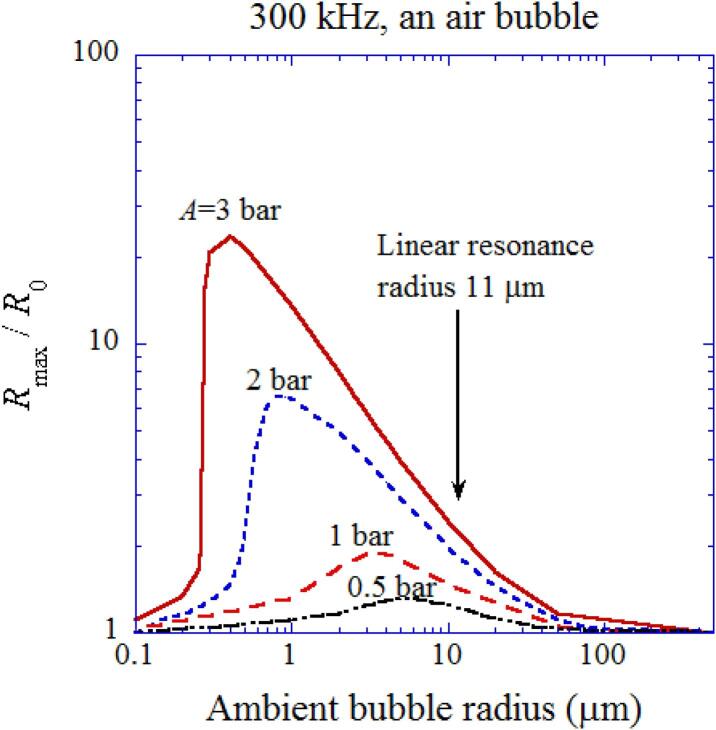
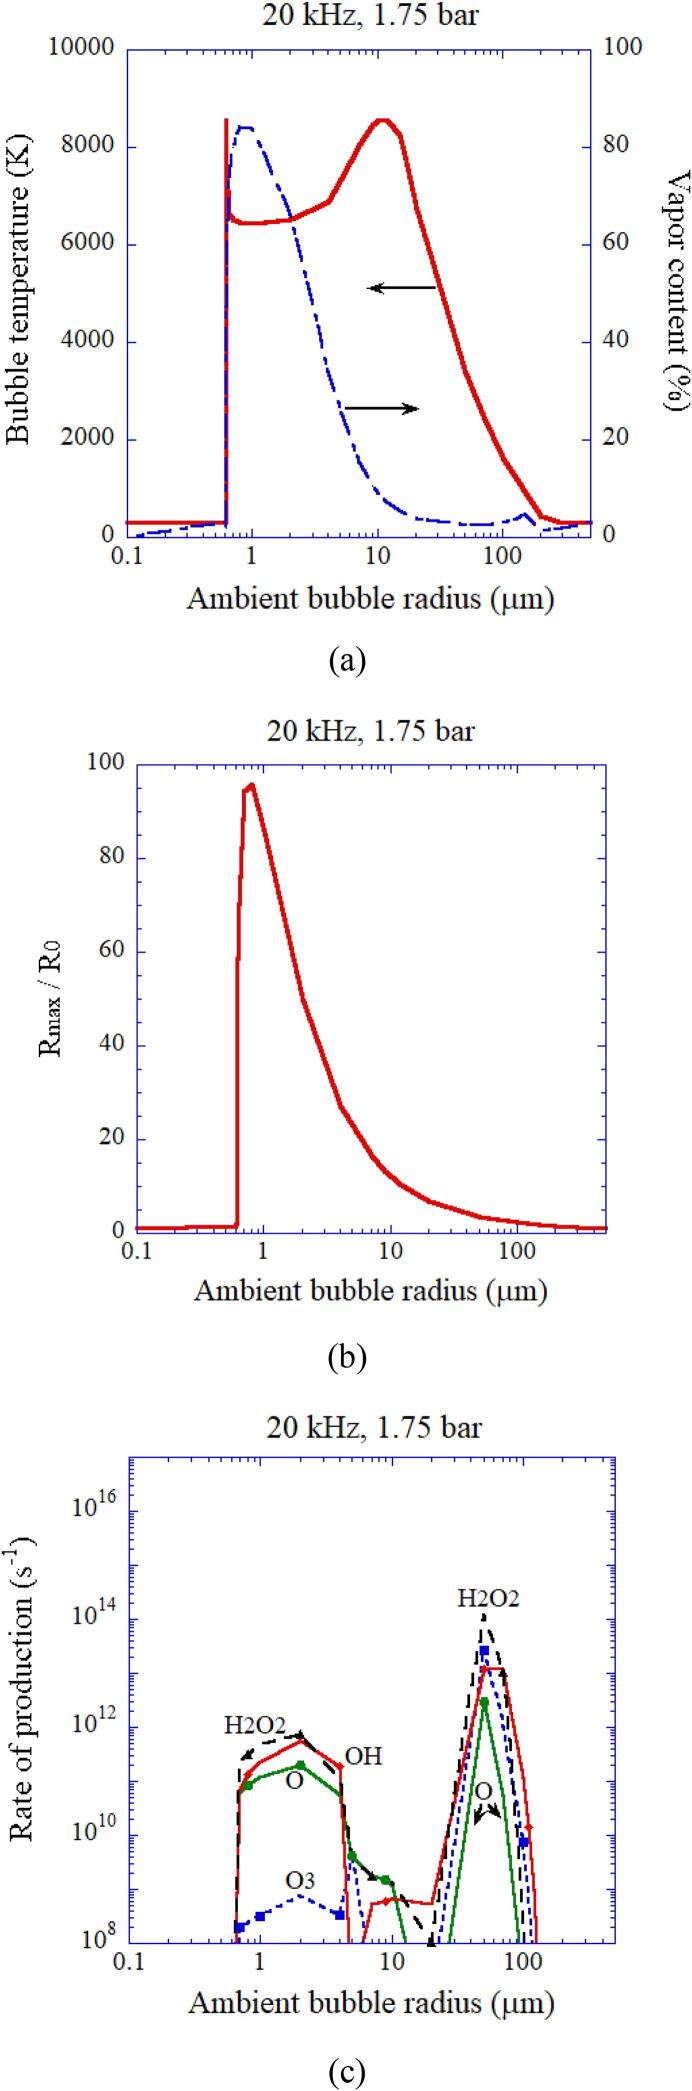
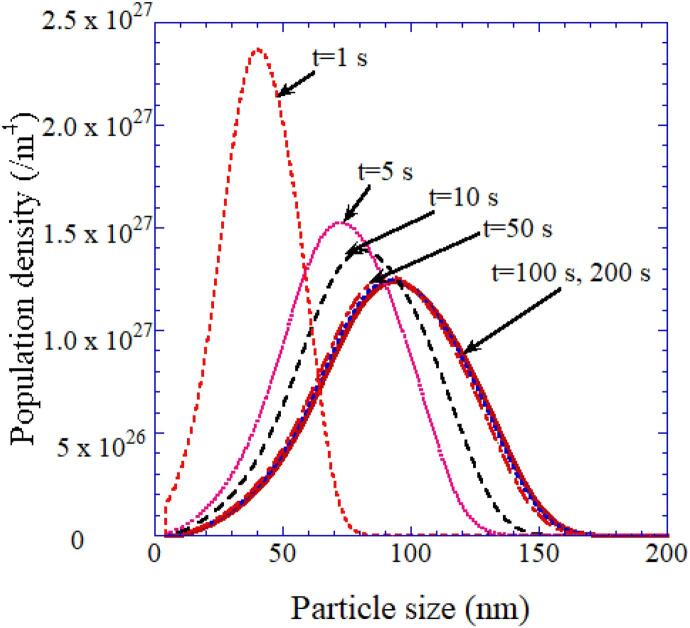
Numerical simulations for sonochemistry are reviewed including single-bubble sonochemistry, influence of ultrasonic frequency and bubble size, acoustic field, and sonochemical synthesis of nanoparticles. The theoretical model of bubble dynamics including the effect of non-equilibrium chemical reactions inside a bubble has been validated from the study of single-bubble sonochemistry. By the numerical simulations, it has been clarified that there is an optimum bubble temperature for the production of oxidants inside an air bubble such as OH radicals and H2O2 because at higher temperature oxidants are strongly consumed inside a bubble by oxidizing nitrogen. Unsolved problems are also discussed.

Keywords: Bubble dynamics model; Numerical simulation; OH radical; Optimum bubble temperature; Single-bubble sonochemistry; Sonochemical synthesis of nanoparticles.


Conflict of interest statement

The author declares that he has no known competing financial interests or personal relationships that could have appeared to influence the work reported in this paper.

Figures

Fig. 1
Fig. 1
An experimental apparatus for a single-bubble system . Copyright (2004), with permission from Taylor & Francis.
Fig. 2
Fig. 2
The bubble dynamics model . Reprinted from Ultrasonics, vol. 42, K. Yasui, T. Tuziuti, and Y. Iida, Optimum bubble temperature for the sonochemical production of oxidants, pp. 579–584, Copyright (2004), with permission from Elsevier.
Fig. 3
Fig. 3
The calculated results for one acoustic cycle when a SBSL bubble in a steady state in water at 3 °C is irradiated by an ultrasonic wave of 52 kHz and 1.52 bar in frequency and pressure amplitude, respectively . The ambient bubble radius is 3.6 μm. (a) The bubble radius. (b) The dissolution rate of OH radicals into the liquid from the interior of the bubble (solid line) and its time integrals (dotted line). Reprinted from J. Chem. Phys., vol. 122, K. Yasui, T. Tuziuti, M. Sivakumar, and Y. Iida, Theoretical study of single-bubble sonochemistry, 224706, Copyright (2005), with the permission of AIP Publishing.
Fig. 4
Fig. 4
The calculated results for a SBSL bubble in a steady state at around the end of the bubble collapse only for 0.1 μs . (a) The bubble radius and the temperature inside a bubble. (b) The number of molecules inside a bubble. Reprinted from J. Chem. Phys., vol. 122, K. Yasui, T. Tuziuti, M. Sivakumar, and Y. Iida, Theoretical study of single-bubble sonochemistry, 224706, Copyright (2005), with the permission of AIP Publishing.
Fig. 5
Fig. 5
The calculated result as a function of acoustic amplitude for various ultrasonic frequencies (20 kHz, 100 kHz, 300 kHz, and 1 MHz) for the first collapse of an isolated spherical air bubble . The ambient bubble radii are 5 μm for 20 kHz, 3.5 μm for 100 and 300 kHz, and 1 μm for 1 MHz. (a) The temperature inside a bubble at the final stage of the bubble collapse. (b) The molar fraction of water vapor inside a bubble at the end of the bubble collapse. Reprinted from J. Chem. Phys., vol. 127, K. Yasui, T.Tuziuti, T. Kozuka, A. Towata, and Y.Iida, Relationship between the bubble temperature and main oxidant created inside an air bubble under ultrasound, 154502, Copyright (2007), with the permission of AIP Publishing.
Fig. 6
Fig. 6
The rate of production of each oxidant inside an isolated spherical air bubble per second calculated by the first bubble collapse as a function of acoustic amplitude with the temperature inside a bubble at the end of the bubble collapse (the thick line): (a) 20 kHz and R0 = 5 μm. (b) 100 kHz and R0 = 3.5 μm. (c) 300 kHz and R0 = 3.5 μm. (d) 1 MHz and R0 = 1 μm . Reprinted from J. Chem. Phys., vol. 127, K. Yasui, T. Tuziuti, T. Kozuka, A. Towata, and Y.Iida, Relationship between the bubble temperature and main oxidant created inside an air bubble under ultrasound, 154502, Copyright (2007), with the permission of AIP Publishing.
Fig. 7
Fig. 7
The rate of production of other main chemical species inside an isolated spherical air bubble per second calculated by the first bubble collapse as a function of acoustic amplitude . (a) 20 kHz and R0 = 5 μm. (b) 100 kHz and R0 = 3.5 μm. (c) 300 kHz and R0 = 3.5 μm. (d) 1 MHz and R0 = 1 μm. Reprinted from J. Chem. Phys., vol. 127, K. Yasui, T. Tuziuti, T. Kozuka, A. Towata, and Y. Iida, Relationship between the bubble temperature and main oxidant created inside an air bubble under ultrasound, 154502, Copyright (2007), with the permission of AIP Publishing.
Fig. 8
Fig. 8
The calculated expansion ratio (Rmax/R0) as a function of ambient bubble radius for various acoustic amplitudes at 300 kHz . Both the horizontal and vertical axes are in logarithmic scale. Reprinted from J. Chem. Phys., vol. 128, K. Yasui, T. Tuziuti, J. Lee, T. Kozuka, A. Towata, and Y. Iida, The range of ambient radius for an active bubble in sonoluminescence and sonochemical reactions, 184705, Copyright (2008), with the permission of AIP Publishing.
Fig. 9
Fig. 9
The calculated result as a function of ambient bubble radius of an air bubble at 20 kHz and 1.75 bar in ultrasonic frequency and acoustic amplitude, respectively . The horizontal axis is in logarithmic scale. (a) The peak temperature (solid) and the molar fraction of water vapor (dash dotted) inside a bubble at the end of the bubble collapse. (b) The expansion ratio (Rmax/R0). (c) The rate of production of each oxidant with the logarithmic vertical axis. Reprinted from J. Chem. Phys., vol. 128, K. Yasui, T. Tuziuti, J. Lee, T. Kozuka, A. Towata, and Y. Iida, The range of ambient radius for an active bubble in sonoluminescence and sonochemical reactions, 184705, Copyright (2008), with the permission of AIP Publishing.
Fig. 10
Fig. 10
The calculated spatial distribution of the acoustic amplitude for glass wall (7 mm in thickness) for various attenuation coefficients of ultrasound . The photograph of sonochemiluminescence from an aqueous luminol solution has been also shown for the corresponding half plane. Reprinted from Ultrason. Sonochem., vol. 14, K. Yasui, T. Kozuka, T. Tuziuti, A. Towata, Y. Iida, J. King, and P. Macey, FEM calculation of an acoustic field in a sonochemical reactor, pp. 605–614, Copyright (2007), with permission from Elsevier.
Fig. 11
Fig. 11
The calculated spatial distribution of the acoustic amplitude for glass wall with internal friction (2 mm in thickness) . The attenuation coefficient is 5 m−1. Reprinted from Ultrason. Sonochem., vol. 14, K. Yasui, T. Kozuka, T. Tuziuti, A. Towata, Y. Iida, J. King, and P. Macey, FEM calculation of an acoustic field in a sonochemical reactor, pp. 605–614, Copyright (2007), with permission from Elsevier.
Fig. 12
Fig. 12
The calculated results on temporal development of sonochemically synthesized BaTiO3 particle (aggregate) size-distribution when the initial concentration of BaCl2 and TiCl4 is 0.4 mol/L . Reprinted from Ultrason. Sonochem., vol. 18, K. Yasui, T. Tuziuti, and K. Kato, Numerical simulations of sonochemical production of BaTiO3 nanoparticles, pp. 1211–1217, Copyright (2011), with permission from Elsevier.
Fig. 13
Fig. 13
Configuration of a collision between two particles . Reprinted with permission from J. Phys. Chem. C, vol. 116, K. Yasui and K. Kato, Dipole-dipole interaction model for oriented attachment of BaTiO3 nanocrystals: a route to mesocrystal formation, pp. 319–324, Copyright (2012), American Chemical Society.
Fig. 14
Fig. 14
The result of the numerical simulation on the collision between a primary particle (n = 1, d = 10 nm) and an aggregate (n = 20, d = 34 nm) consisting of 20 primary particles of 10 nm in diameter in aqueous solution at pH 14 as a function of time for 15 μs . (a) The position of each particle. (b) The relative angle of the two dipoles. (c) The potential energy. Reprinted from Ultrason. Sonochem., vol. 35, K. Yasui and K. Kato, Numerical simulations of sonochemical production and oriented aggregation of BaTiO3 nanocrystals, pp. 673–680, Copyright (2017), with permission from Elsevier.
Fig. 15
Fig. 15
The result of the numerical simulation on the collision between two aggregates (n = 20, d = 34 nm) consisting of primary particles of 10 nm in diameter . (a) The position of each particle. (b) The relative angle of the two dipoles. Reprinted from Ultrason. Sonochem., vol. 35, K. Yasui and K. Kato, Numerical simulations of sonochemical production and oriented aggregation of BaTiO3 nanocrystals, pp. 673–680, Copyright (2017), with permission from Elsevier.

References

    1. H. Nomura, S. Koda, What is sonochemistry?, in: F.Grieser, P.Choi, N. Enomoto, H. Harada, K. Okitsu, K. Yasui (Eds.), Sonochemistry and the Acoustic Bubble, Elsevier, Amsterdam, 2015, pp. 1-9, 10.1016/B978-0-12-801530-8.00001-3.
    1. D.F. Gaitan, L.A. Crum, Observation of sonoluminescence from a single, stable cavitation bubble in a water glycerin mixture, in: M.F. Hamilton, D.T.Blackstock (Eds.), Frontiers of Nonlinear Acoustics, Proc. 12th ISNA, Elsevier Appl. Sci. Pub., 1990, pp. 459-463.
    1. Yasui K., Tuziuti T., Sivakumar M., Iida Y. Sonoluminescence. Appl. Spectrosc. Rev. 2004;39(3):399–436. doi: 10.1081/ASR-200030202. - DOI
    1. Brenner M.P., Hilgenfeldt S., Lohse D. Single-bubble sonoluminescence. Rev. Mod. Phys. 2002;74(2):425–484. doi: 10.1103/RevModPhys.74.425. - DOI - PubMed
    1. Young F.R. CRC Press; Boca Raton: 2005. Sonoluminescence.

LinkOut - more resources