. 2021 Aug 5;13(16):3965.
doi: 10.3390/cancers13163965.

Multicenter DSC-MRI-Based Radiomics Predict IDH Mutation in Gliomas

Affiliations

Multicenter DSC-MRI-Based Radiomics Predict IDH Mutation in Gliomas

Georgios C Manikis et al. Cancers (Basel). .

Abstract

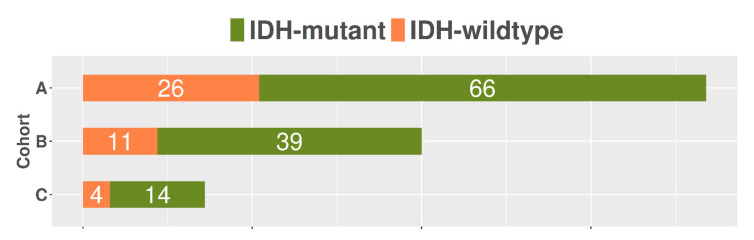
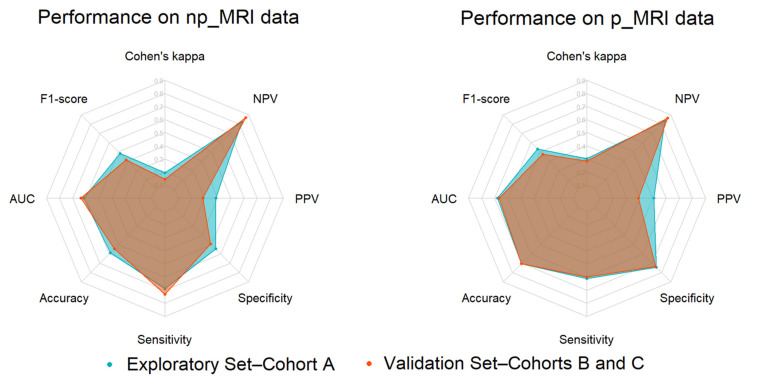
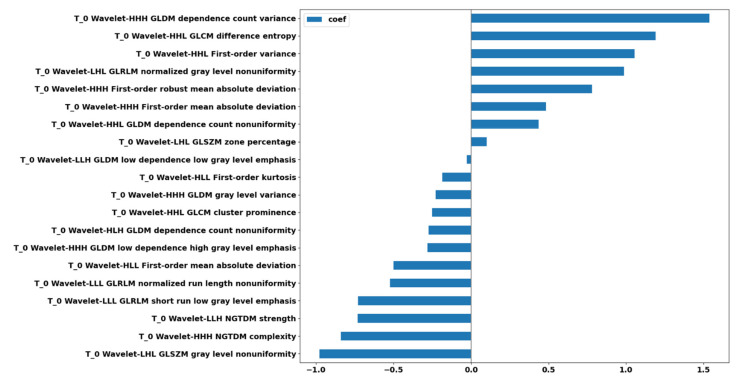
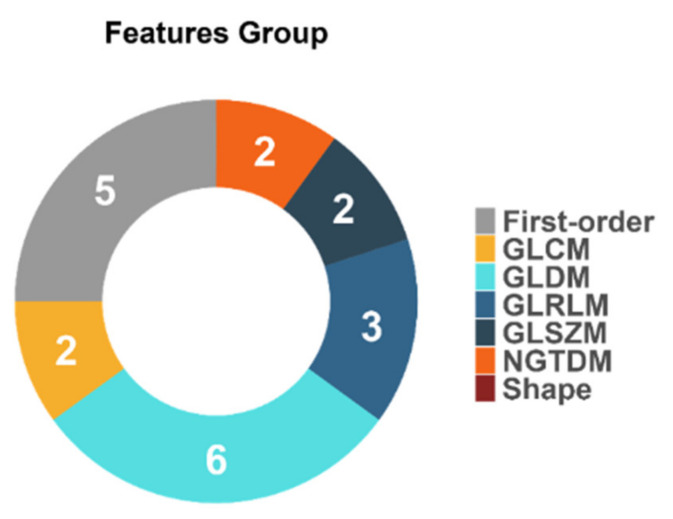
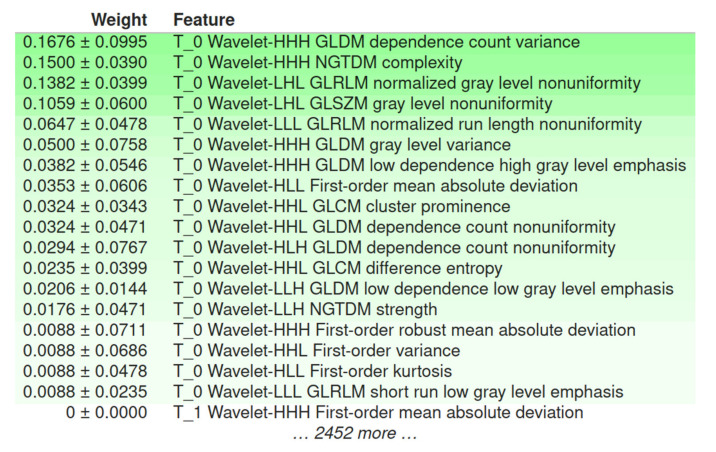
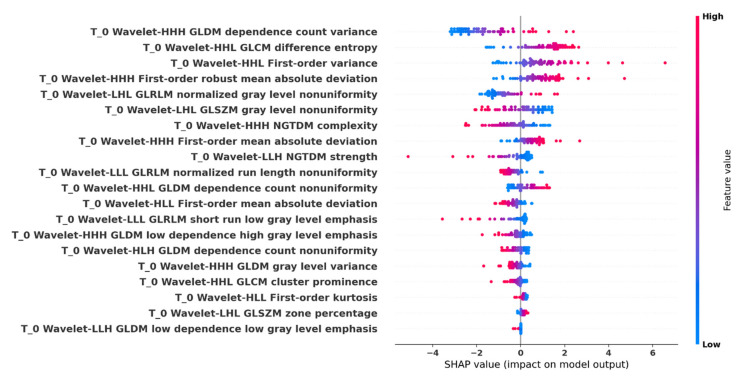
To address the current lack of dynamic susceptibility contrast magnetic resonance imaging (DSC-MRI)-based radiomics to predict isocitrate dehydrogenase (IDH) mutations in gliomas, we present a multicenter study that featured an independent exploratory set for radiomics model development and external validation using two independent cohorts. The maximum performance of the IDH mutation status prediction on the validation set had an accuracy of 0.544 (Cohen's kappa: 0.145, F1-score: 0.415, area under the curve-AUC: 0.639, sensitivity: 0.733, specificity: 0.491), which significantly improved to an accuracy of 0.706 (Cohen's kappa: 0.282, F1-score: 0.474, AUC: 0.667, sensitivity: 0.6, specificity: 0.736) when dynamic-based standardization of the images was performed prior to the radiomics. Model explainability using local interpretable model-agnostic explanations (LIME) and Shapley additive explanations (SHAP) revealed potential intuitive correlations between the IDH-wildtype increased heterogeneity and the texture complexity. These results strengthened our hypothesis that DSC-MRI radiogenomics in gliomas hold the potential to provide increased predictive performance from models that generalize well and provide understandable patterns between IDH mutation status and the extracted features toward enabling the clinical translation of radiogenomics in neuro-oncology.

Keywords: IDH mutation; dynamic susceptibility contrast MRI; explainability; external validation; generalizability; gliomas; radiomics.


Conflict of interest statement

The authors declare no conflict of interest.

Figures

Figure 1
Figure 1
Time points of interest of a T2 mean signal intensity curve.
Figure 2
Figure 2
Schematic representation of the normalization process. (a) Dynamic susceptibility contrast (DSC) perfusion curves from the 3 tertiary centers. (b) ΔR2t curves after normalization using equation (1). (c) Center-specific probability density functions of the raw signal intensities within the voxels of interest (VOIs) at time point T_max. (d) Center-specific probability density functions of the normalized signal intensities within the VOIs at time point T_max.
Figure 3
Figure 3
An illustrative representation of the proposed radiomics analysis workflow.
Figure 4
Figure 4
A schematic diagram summarizing the proposed radiomics analysis workflow steps.
Figure 5
Figure 5
Distribution of the isocitrate dehydrogenase (IDH) status across the three examined centers. Numbers of total IDH-mutant and IDH-wildtype statuses from each clinical center are shown in white.
Figure 6
Figure 6
From left to right: Radar plots illustrating the IDH mutation status prediction performance during the model development (internal validation using the exploratory set) and validation (external validation set) phases from np_MRI and p_MRI data.
Figure 7
Figure 7
Feature ranking of the 20 selected radiomics features after feature reduction based on the regression coefficient profiles.
Figure 8
Figure 8
Feature distributions according to the group of the calculated radiomics features.
Figure 9
Figure 9
A top-down radiomics feature order in decreasing importance using local interpretable model-agnostic explanations (LIME). All radiomics features were shuffled individually and the permutation importance (reported as mean ± SD) was computed on the external validation set.
Figure 10
Figure 10
Shapley additive explanations (SHAP) summary plot. All important radiomics feature values are displayed as dots using a pseudocoloring (blue to red), low or zero contributors are near a SHAP value of zero, a long distance from zero denotes a higher influence of a specific feature in the prediction performance, where decreased or increased values favored the negative (IDH-mutant) or positive (IDH-wildtype) classes, respectively.

References

    1. Ostrom Q.T., Cioffi G., Gittleman H., Patil N., Waite K., Kruchko C., Barnholtz-Sloan J.S. CBTRUS Statistical Report: Primary Brain and Other Central Nervous System Tumors Diagnosed in the United States in 2012–2016. Neuro. Oncol. 2019;21:v1–v100. doi: 10.1093/neuonc/noz150. - DOI - PMC - PubMed
    1. The Cancer Genome Atlas Research Network Comprehensive, Integrative Genomic Analysis of Diffuse Lower-Grade Gliomas. New Engl. J. Med. 2015;372:2481–2498. doi: 10.1056/NEJMoa1402121. - DOI - PMC - PubMed
    1. Louis D.N., Perry A., Reifenberger G., von Deimling A., Figarella-Branger D., Cavenee W.K., Ohgaki H., Wiestler O.D., Kleihues P., Ellison D.W. The 2016 World Health Organization Classification of Tumors of the Central Nervous System: A summary. Acta Neuropathol. 2016;131:803–820. doi: 10.1007/s00401-016-1545-1. - DOI - PubMed
    1. Stupp R., Mason W.P., van den Bent M.J., Weller M., Fisher B., Taphoorn M.J.B., Belanger K., Brandes A.A., Marosi C., Bogdahn U., et al. Radiotherapy plus Concomitant and Adjuvant Temozolomide for Glioblastoma. New Engl. J. Med. 2005;352:987–996. doi: 10.1056/NEJMoa043330. - DOI - PubMed
    1. Lu V.M., O’Connor K.P., Shah A.H., Eichberg D.G., Luther E.M., Komotar R.J., Ivan M.E. The prognostic significance of CDKN2A homozygous deletion in IDH-mutant lower-grade glioma and glioblastoma: A systematic review of the contemporary literature. J. Neurooncol. 2020;148:221–229. doi: 10.1007/s11060-020-03528-2. - DOI - PubMed