. 2021 Jul 29;10(8):1225.
doi: 10.3390/antiox10081225.

Discovering the Protective Effects of Resveratrol on Aflatoxin B1-Induced Toxicity: A Whole Transcriptomic Study in a Bovine Hepatocyte Cell Line

Affiliations

Discovering the Protective Effects of Resveratrol on Aflatoxin B1-Induced Toxicity: A Whole Transcriptomic Study in a Bovine Hepatocyte Cell Line

Marianna Pauletto et al. Antioxidants (Basel). .

Abstract

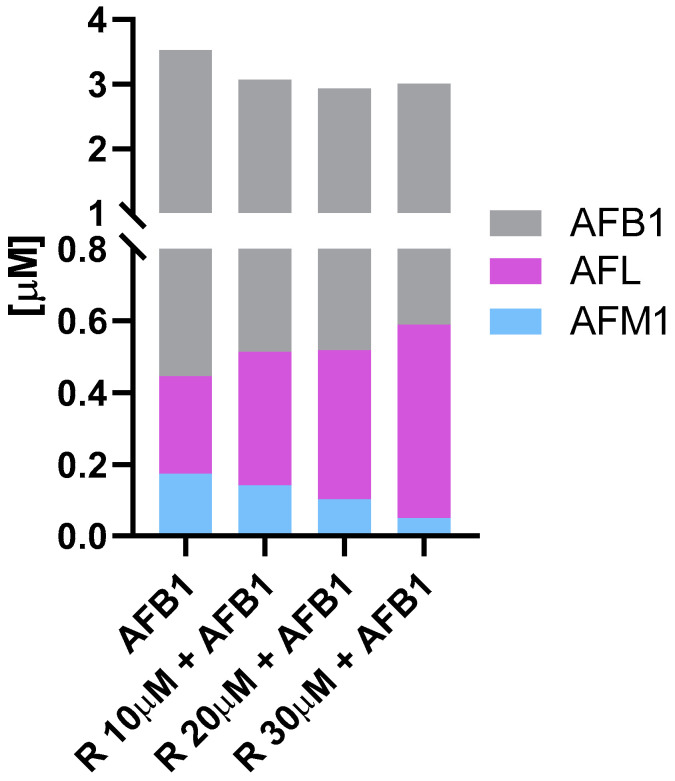
Aflatoxin B1 (AFB1) is a natural feed and food contaminant classified as a group I carcinogen for humans. In the dairy industry, AFB1 and its derivative, AFM1, are of concern for the related economic losses and their possible presence in milk and dairy food products. Among its toxic effects, AFB1 can cause oxidative stress. Thus, dietary supplementation with natural antioxidants has been considered among the strategies to mitigate AFB1 presence and its toxicity. Here, the protective role of resveratrol (R) has been investigated in a foetal bovine hepatocyte cell line (BFH12) exposed to AFB1, by measuring cytotoxicity, transcriptional changes (RNA sequencing), and targeted post-transcriptional modifications (lipid peroxidation, NQO1 and CYP3A enzymatic activity). Resveratrol reversed the AFB1-dependent cytotoxicity. As for gene expression, when administered alone, R induced neglectable changes in BFH12 cells. Conversely, when comparing AFB1-exposed cells with those co-incubated with R+AFB1, greater transcriptional variations were observed (i.e., 840 DEGs). Functional analyses revealed that several significant genes were involved in lipid biosynthesis, response to external stimulus, drug metabolism, and inflammatory response. As for NQO1 and CYP3A activities and lipid peroxidation, R significantly reverted variations induced by AFB1, mostly corroborating and/or completing transcriptional data. Outcomes of the present study provide new knowledge about key molecular mechanisms involved in R antioxidant-mediated protection against AFB1 toxicity.

Keywords: RNAseq; aflatoxicosis; aflatoxin B1; antioxidants; cancer; cattle; liver; mycotoxins; resveratrol; transcriptome.


Conflict of interest statement

The authors declare no conflict of interest.

Figures

Figure 1
Figure 1
Cytotoxicity. (a) Resveratrol dose–response curve in BFH12 cells (64 h), based on three independent cell culture experiments, each one run in sextuplicate. Data are expressed in mean cytotoxicity rate ± standard error of the mean (SEM). IC50 and R2 are also reported. (b) AFB1 cytotoxicity in presence of R (16 + 48 h). The box and whiskers plots report the viability of BFH12 cells pre-treated with R increasing concentrations (10, 20, and 30 μM) and exposed for 48 h to a combination of AFB1 3.6 μM and R (same concentration reported above). ** p ≤ 0.01, * p ≤ 0.05 (Kruskal–Wallis and Dunn’s multicomparisons tests; the mean of each condition was compared with the mean of the AFB1 condition). Graphs were obtained by means of GraphPad prism software. R = resveratrol; A = AFB1.
Figure 2
Figure 2
AFB1 biotransformation. The cumulative bar chart reports the micromolar (μM) amount of AFB1, AFM1, and AFL detected in the medium of BFH12 cells exposed to AFB1 alone or in combination with 10, 20, or 30 μM of R. R = resveratrol.3.3. Target gene expression analysis.
Figure 3
Figure 3
Heatmap of top-10 up- and downregulated genes by R+AFB1 co-treatment (vs. AFB1). The graph was constructed in R environment using the pheatmap package and using as input the normalized log10CPM (Counts Per Million). R = resveratrol; A = AFB1.
Figure 4
Figure 4
Functional enrichment of genes regulated by R+AFB1 co-treatment (vs. AFB1). Dot plots representing enriched BPs (a) and KEGG pathways (b). Dot size reflects the number of DEGs in each enriched term. The colour gradient reflects the significance level of each term. p-values were adjusted using the Benjamini-Hochberg method.
Figure 5
Figure 5
Gene Set Enrichment Analysis: R+AFB1 vs. AFB1. The ridgeplot visualizes the expression distributions of core enriched genes for GSEA enriched KEGG pathways. Gradient colour reflects the adjusted p-values (Benjamini–Hochberg method).
Figure 6
Figure 6
Lipid peroxidation. Box and whiskers plot reports the MDA content in the four different experimental conditions. The statistical comparisons were established between the median MDA concentration in cells exposed to AFB1 and the median MDA concentration observed in all other experimental conditions. Data are expressed as median concentration and data distribution (i.e., quartiles). For each experimental condition, six independent cell culture experiments were performed. CTRL condition corresponds to cells exposed to PCB126 only. R = resveratrol; A = AFB1. *** p < 0.001 (one-way ANOVA, followed by Dunnett’s multi-comparisons test).
Figure 7
Figure 7
NQO1 enzyme activity. Box and whiskers plot reports the diaphorase activity in different experimental conditions. The statistical comparisons were established between the median NQO1 activity in cells exposed to AFB1 and the median NQO1 activity observed in the other experimental conditions. For each experimental condition, six independent cell culture experiments were performed. Data are expressed as median optical density (OD) observed per min per mg of total protein. CTRL condition corresponds to cells exposed to PCB126 only. R = resveratrol; A = AFB1. *** p < 0.001 (one-way ANOVA, followed by Dunnett’s multi-comparisons test).
Figure 8
Figure 8
CYP3A enzyme activity. Box and whiskers plot reports the CYP3A activity in different experimental conditions. The statistical comparisons were established between the median CYP3A activity in cells exposed to AFB1 and the CYP3A activity observed in the other experimental conditions. For each experimental condition, seven independent cell culture experiments were performed. Data are expressed as relative luminescence units (RLU) normalized to the total number of alive cells. CTRL condition corresponds to cells exposed to PCB126 only. R = resveratrol; A = AFB1. *** p < 0.001 (one-way ANOVA, followed by Dunnett’s multi-comparisons test).

References

    1. Monbaliu S., Van Poucke C., Detavernier C., Dumoulin F., Van De Velde M., Schoeters E., Van Dyck S., Averkieva O., Van Peteghem C., De Saeger S. Occurrence of Mycotoxins in Feed as Analyzed by a Multi-Mycotoxin LC-MS/MS Method. J. Agric. Food Chem. 2010;58:66–71. doi: 10.1021/jf903859z. - DOI - PubMed
    1. Streit E., Schatzmayr G., Tassis P., Tzika E., Marin D., Taranu I., Tabuc C., Nicolau A., Aprodu I., Puel O., et al. Current Situation of Mycotoxin Contamination and Co-Occurrence in Animal Feed—Focus on Europe. Toxins. 2012;4:788–809. doi: 10.3390/toxins4100788. - DOI - PMC - PubMed
    1. Monson M.S., Settlage R.E., McMahon K.W., Mendoza K.M., Rawal S., El-Nezami H.S., Coulombe R.A., Reed K.M. Response of the Hepatic Transcriptome to Aflatoxin B1in Domestic Turkey (Meleagris Gallopavo) PLoS ONE. 2014 doi: 10.1371/journal.pone.0100930. - DOI - PMC - PubMed
    1. Rustemeyer S.M., Lamberson W.R., Ledoux D.R., Wells K., Austin K.J., Cammack K.M. Effects of Dietary Aflatoxin on the Hepatic Expression of Apoptosis Genes in Growing Barrows. J. Anim. Sci. 2011 doi: 10.2527/jas.2010-3473. - DOI - PubMed
    1. Shi F., Seng X., Tang H., Zhao S., Deng Y., Jin R., Li Y. Effect of Low Levels of Aflatoxin B1 on Performance, Serum Biochemistry, Hepatocyte Apoptosis and Liver Histopathological Changes of Cherry Valley Ducks. J. Anim. Vet. Adv. 2013;12:1126–1130. doi: 10.3923/javaa.2013.1126.1130. - DOI