. 2021 Aug 3;11(8):1148.
doi: 10.3390/biom11081148.

Vitamin C Enhances Antiviral Functions of Lung Epithelial Cells

Affiliations

Vitamin C Enhances Antiviral Functions of Lung Epithelial Cells

Trevor Teafatiller et al. Biomolecules. .

Abstract

Vitamin C is well documented to have antiviral functions; however, there is limited information about its effect on airway epithelial cells-the first cells to encounter infections. Here, we examined the effect of vitamin C on human bronchial epithelium transformed with Ad12-SV40 2B (BEAS-2B) cells, and observed that sodium-dependent vitamin C transporter 2 (SVCT2) was the primary vitamin C transporter. Transcriptomic analysis revealed that treating BEAS-2B cells with vitamin C led to a significant upregulation of several metabolic pathways and interferon-stimulated genes (ISGs) along with a downregulation of pathways involved in lung injury and inflammation. Remarkably, vitamin C also enhanced the expression of the viral-sensing receptors retinoic acid-inducible gene 1 (RIG-1) and melanoma differentiation-associated protein 5 (MDA-5), which was confirmed at the protein and functional levels. In addition, the lungs of l-gulono-γ-lactone oxidase knockout (GULO-KO) mice also displayed a marked decrease in these genes compared to wild-type controls. Collectively, our findings indicate that vitamin C acts at multiple levels to exert its antiviral and protective functions in the lungs.

Keywords: GULO-KO mice; ISGs; airway epithelial cells; antiviral responses; vitamin C; vitamin C transporters.


Conflict of interest statement

The authors declare no conflict of interest. The funding sponsors had no role in the design of the study, in the collection, analyses, or interpretation of data, in the writing of the manuscript, or in the decision to publish the results.

Figures

Figure 1
Figure 1
Vitamin C transporter expression and function in the lungs. The expression of the vitamin C transporters SVCT1 and SVCT2 was determined using RT-qPCR in (A) human primary bronchial epithelial cells; (B) BEAS-2B cells; and (C) native wild-type mouse lungs. (D) To determine the effect of vitamin C/ascorbic acid (AA) treatment on 14C-AA uptake and SVCT2 expression levels, the BEAS-2B cells were exposed to vitamin C (100 μM, 24 h) and carrier-mediated 14C-AA uptake was performed. Expression of (E) SVCT2 mRNA and (F) protein levels were determined for isolated mRNA and proteins by RT-qPCR and Western blot analysis, respectively. Data are means ± SE of at least 3–4 independent sample preparations.
Figure 1
Figure 1
Vitamin C transporter expression and function in the lungs. The expression of the vitamin C transporters SVCT1 and SVCT2 was determined using RT-qPCR in (A) human primary bronchial epithelial cells; (B) BEAS-2B cells; and (C) native wild-type mouse lungs. (D) To determine the effect of vitamin C/ascorbic acid (AA) treatment on 14C-AA uptake and SVCT2 expression levels, the BEAS-2B cells were exposed to vitamin C (100 μM, 24 h) and carrier-mediated 14C-AA uptake was performed. Expression of (E) SVCT2 mRNA and (F) protein levels were determined for isolated mRNA and proteins by RT-qPCR and Western blot analysis, respectively. Data are means ± SE of at least 3–4 independent sample preparations.
Figure 2
Figure 2
Transcriptomic changes in BEAS-2B cells after treatment with vitamin C. RNA-sequencing was performed on vitamin-C-treated and untreated BEAS-2B cells. (A) Selected canonical pathways of upregulated and downregulated differentially transcribed genes in control (n = 3) and vitamin-C-treated (n = 3) cells after Ingenuity Pathway Analysis (−log10 p value ≥ 1.30). (B) Gene network analysis of up- and downregulated genes in control (n = 3) and vitamin-C-treated (n = 3) cells. The networks shown are among those with the highest significance of connections between molecules in the network, as indicated by their score. Blue nodes indicate downregulated and red nodes indicate upregulated gene expression in vitC-treated vs. control cells. Darker shades of the nodes indicate larger differential expression ratios. Dotted lines represent indirect interactions, while solid lines represent direct interactions. (C) RNA expression of ISGs as determined by the Interferome database. Based on the Interferome database of more than 25,000 ISGs, 7838 differentially expressed genes were identified in vitC-treated vs. control cells, 4313 of which were ISGs. These ISGs were expressed at statistically lower levels (t-test p-value < 0.0001) in control cells (n = 3) compared to vitC-treated cells (n = 3).
Figure 2
Figure 2
Transcriptomic changes in BEAS-2B cells after treatment with vitamin C. RNA-sequencing was performed on vitamin-C-treated and untreated BEAS-2B cells. (A) Selected canonical pathways of upregulated and downregulated differentially transcribed genes in control (n = 3) and vitamin-C-treated (n = 3) cells after Ingenuity Pathway Analysis (−log10 p value ≥ 1.30). (B) Gene network analysis of up- and downregulated genes in control (n = 3) and vitamin-C-treated (n = 3) cells. The networks shown are among those with the highest significance of connections between molecules in the network, as indicated by their score. Blue nodes indicate downregulated and red nodes indicate upregulated gene expression in vitC-treated vs. control cells. Darker shades of the nodes indicate larger differential expression ratios. Dotted lines represent indirect interactions, while solid lines represent direct interactions. (C) RNA expression of ISGs as determined by the Interferome database. Based on the Interferome database of more than 25,000 ISGs, 7838 differentially expressed genes were identified in vitC-treated vs. control cells, 4313 of which were ISGs. These ISGs were expressed at statistically lower levels (t-test p-value < 0.0001) in control cells (n = 3) compared to vitC-treated cells (n = 3).
Figure 3
Figure 3
Effect of vitamin C on antiviral gene expression in in vitro and in vivo model systems. RT-qPCR was performed on BEAS-2B cells in the presence and absence of vitamin C/AA. (A) Bar graphs depict the expression of RIG-1, IFIH1/MDA-5, and MX1. Data are means ± SE of at least 4 experiments performed on separately isolated samples. (B) Histograms depict the expression of these molecules at the protein level using flow cytometry. (C) Bar graphs depict the effect of vitamin C deficiency on the expression of murine RIG-1, IFIH1/MDA-5, and MX1 mRNA in the lungs of GULO-KO mice, as determined by RT-qPCR. Data are means ± SE of at least 4–5 sets of mice.
Figure 4
Figure 4
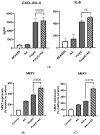
Vitamin C treatment enhances the response of BEAS-2B cells to the antiviral ligand poly I:C. (A) Bar graphs depict the levels of CXCL-8/IL-8 and IL-6 as determined by ELISA. (B) BEAS-2B cells were stimulated with poly I:C in the presence or absence of vitamin C for 24 h. Bar graph depicts the expression of the MX dynamin like GTPase 1 (MX1) gene. (C) BEAS-2B cells were stimulated with IFN-α in the presence or absence of vitamin C for 24 h. Bar graph depicts the expression of the MX1 gene. Data are means ± SE of at least 4 separate experiments.

References

    1. Daruwala R., Song J., Koh W.S., Rumsey S.C., Levine M. Cloning and functional characterization of the human sodium-dependent vitamin C transporters hSVCT1 and hSVCT2. FEBS Lett. 1999;460:480–484. doi: 10.1016/S0014-5793(99)01393-9. - DOI - PubMed
    1. Rajan D.P., Huang W., Dutta B., Devoe L.D., Leibach F.H., Ganapathy V., Prasad P.D. Human placental sodium-dependent vitamin C transporter (SVCT2): Molecular cloning and transport function. Biochem. Biophys. Res. Commun. 1999;262:762–768. doi: 10.1006/bbrc.1999.1272. - DOI - PubMed
    1. Wang Y., Mackenzie B., Tsukaguchi H., Weremowicz S., Morton C.C., Hediger M.A. Human vitamin C (L-ascorbic acid) transporter SVCT1. Biochem. Biophys. Res. Commun. 2000;267:488–494. doi: 10.1006/bbrc.1999.1929. - DOI - PubMed
    1. Maulén N.P., Henríquez E.A., Kempe S., Cárcamo J.G., Schmid-Kotsas A., Bachem M., Grünert A., Bustamante M.E., Nualart F., Vera J.C. Up-regulation and polarized expression of the sodium-ascorbic acid transporter SVCT1 in post-confluent differentiated CaCo-2 cells. J. Biol. Chem. 2003;278:9035–9041. doi: 10.1074/jbc.M205119200. - DOI - PubMed
    1. Boyer J.C., Campbell C.E., Sigurdson W.J., Kuo S.M. Polarized localization of vitamin C transporters, SVCT1 and SVCT2, in epithelial cells. Biochem. Biophys. Res. Commun. 2005;334:150–156. doi: 10.1016/j.bbrc.2005.06.069. - DOI - PubMed

Publication types

MeSH terms

Substances