. 2021 Aug 7;11(8):1169.
doi: 10.3390/biom11081169.

Native Low-Density Lipoproteins Act in Synergy with Lipopolysaccharide to Alter the Balance of Human Monocyte Subsets and Their Ability to Produce IL-1 Beta, CCR2, and CX3CR1 In Vitro and In Vivo: Implications in Atherogenesis

Affiliations

Native Low-Density Lipoproteins Act in Synergy with Lipopolysaccharide to Alter the Balance of Human Monocyte Subsets and Their Ability to Produce IL-1 Beta, CCR2, and CX3CR1 In Vitro and In Vivo: Implications in Atherogenesis

Aarón N Manjarrez-Reyna et al. Biomolecules. .

Abstract

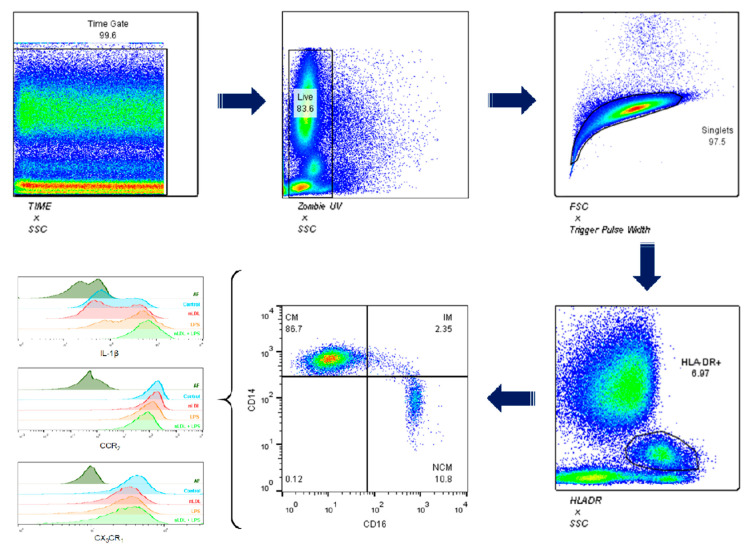
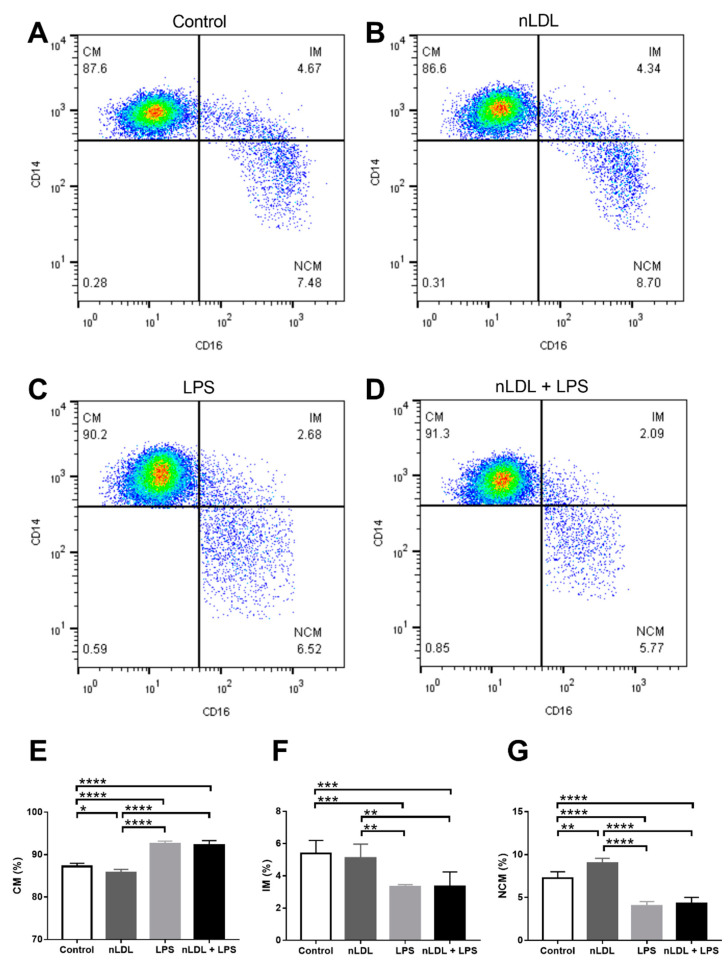
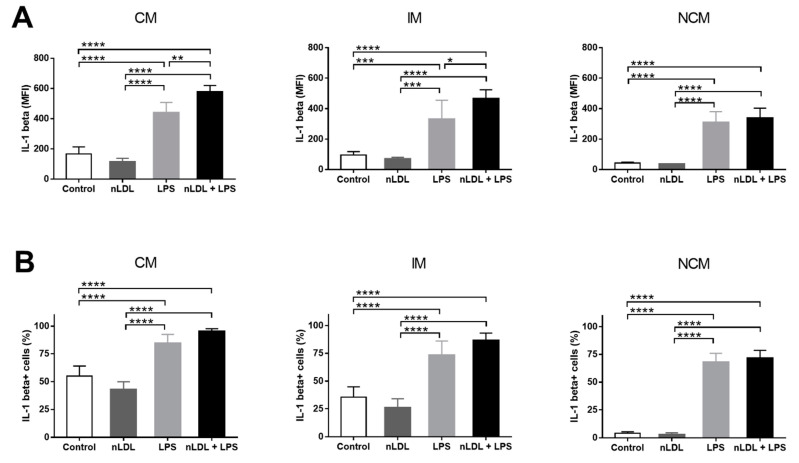
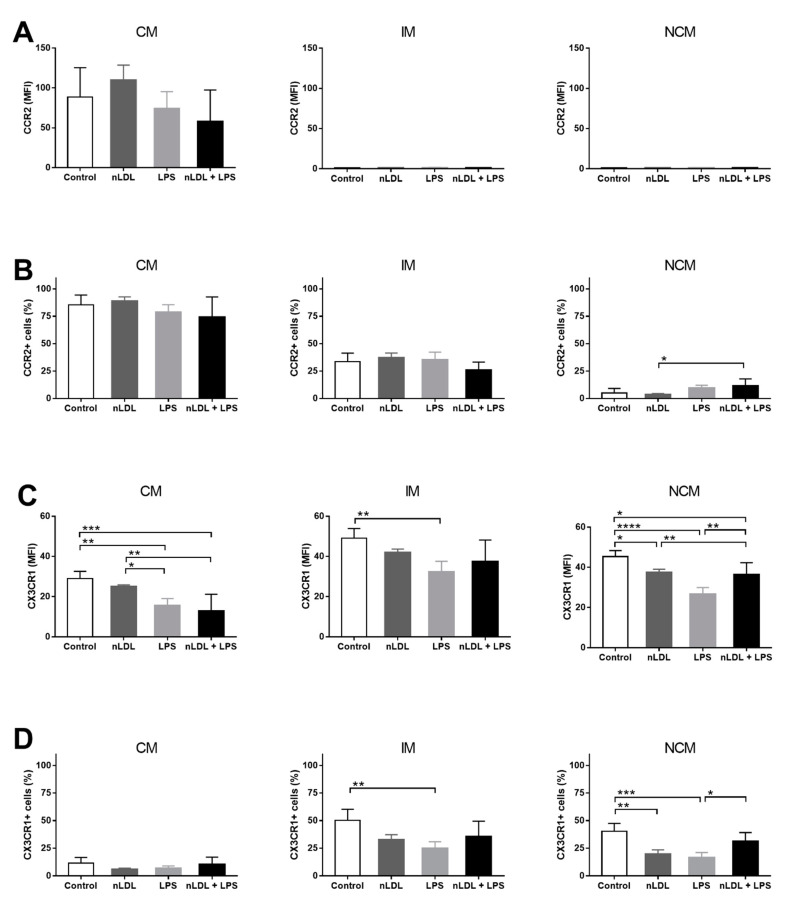
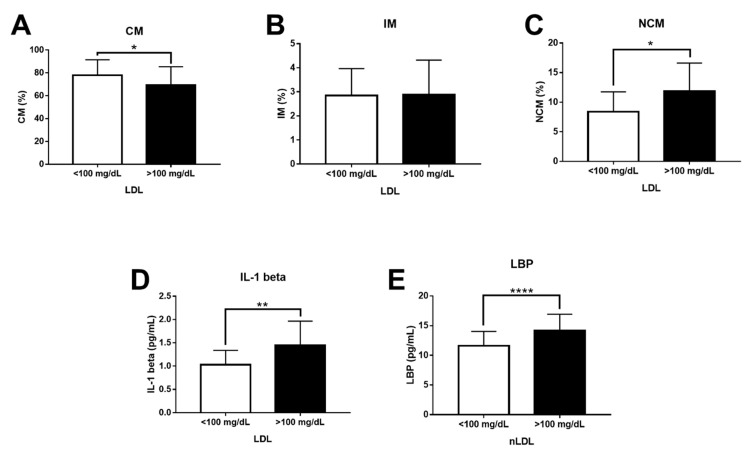
Increasing evidence has demonstrated that oxidized low-density lipoproteins (oxLDL) and lipopolysaccharide (LPS) enhance accumulation of interleukin (IL)-1 beta-producing macrophages in atherosclerotic lesions. However, the potential synergistic effect of native LDL (nLDL) and LPS on the inflammatory ability and migration pattern of monocyte subpopulations remains elusive and is examined here. In vitro, whole blood cells from healthy donors (n = 20) were incubated with 100 μg/mL nLDL, 10 ng/mL LPS, or nLDL + LPS for 9 h. Flow cytometry assays revealed that nLDL significantly decreases the classical monocyte (CM) percentage and increases the non-classical monocyte (NCM) subset. While nLDL + LPS significantly increased the number of NCMs expressing IL-1 beta and the C-C chemokine receptor type 2 (CCR2), the amount of NCMs expressing the CX3C chemokine receptor 1 (CX3CR1) decreased. In vivo, patients (n = 85) with serum LDL-cholesterol (LDL-C) >100 mg/dL showed an increase in NCM, IL-1 beta, LPS-binding protein (LBP), and Castelli's atherogenic risk index as compared to controls (n = 65) with optimal LDL-C concentrations (≤100 mg/dL). This work demonstrates for the first time that nLDL acts in synergy with LPS to alter the balance of human monocyte subsets and their ability to produce inflammatory cytokines and chemokine receptors with prominent roles in atherogenesis.

Keywords: CCR2; CX3CR1; IL-1 beta; LBP; LPS; atherogenesis; monocyte subpopulations; native LDL.


Conflict of interest statement

The authors declare no conflict of interest regarding the publication of this article.

Figures

Figure 1
Figure 1
Gating strategy for characterizing human monocyte subsets. White blood cells were first gated on a time/side scatter (SS) density plot, and then gated on the Zombie UV negative cell population for detection of living cells. Afterwards, living cells were gated for singlets on a forward scatter (FS)/Trigger Pulse Width density plot. Monocytes were recognized on the HLA-DR gating. Then, monocytes were gated on the CD14+/CD16+ population for identification of CMs (CD14++CD16−), IMs (CD14++CD16+), and NCMs (CD14+CD16+). Expression of IL-1 beta, CCR2, and CX3CR1 was measured in all monocyte subsets. SSC, side scatter; FSC, forward scatter; HLA-DR, human leukocyte antigen-DR isotype; CM, classical monocytes; IM, intermediate monocytes; NCM, non-classical monocytes; IL-1 beta, interleukin 1 beta; CCR2, C-C chemokine receptor type 2; CX3CR1, CX3C chemokine receptor 1.
Figure 2
Figure 2
Effects of nLDL and LPS on the dynamics of human monocyte subpopulations. Representative plots showing the percentages of CMs, IMs, and NCMs in response to control conditions (A), nLDL (B), LPS (C), or a combination of nLDL + LPS (D). nLDL significantly decreased the CM percentage and increased the amount of NCMs as compared to control cells (E,G, respectively). LPS, alone or in combination with nLDL, significantly increased the CM percentage and decreased the amount of IMs and NCMs (EG, respectively). Cells were incubated in the presence or absence of 100 μg/mL nLDL and/or 10 ng/mL LPS for 9 h. Data are expressed as mean ± standard deviation. Data were compared using one-way ANOVA followed by the post-hoc Tukey test. Differences were considered significant when p < 0.05. * = p < 0.05; ** = p < 0.01; *** = p < 0.001; **** = p < 0.0001. CM, classical monocytes; IM, intermediate monocytes; NCM, non-classical monocytes; nLDL, native low-density lipoproteins; LPS, lipopolysaccharide.
Figure 3
Figure 3
Effects of nLDL and LPS on IL-1 beta production in human monocyte subpopulations. Although no significant differences were found, nLDL tended to decrease IL-1 beta production in CMs, IMs, and NCMs (A, left, middle, and right panels, respectively). LPS, alone or in combination with nLDL, significantly increased IL-1 beta expression in CMs, IMs, and NCMs (A, left, middle, and right panels, respectively). Although no significant differences were found, nLDL tended to decrease the percentages of IL-1 beta+ cells in all monocyte subsets (B, left, middle, and right panels, respectively). LPS, alone or in combination with nLDL, significantly increased the amount of IL-1 beta+ cells in all monocyte subpopulations (B, left, middle, and right panels, respectively). Cells were incubated in the presence or absence of 100 μg/mL nLDL and/or 10 ng/mL LPS for 9 h. Data are expressed as mean ± standard deviation. Data were compared using one-way ANOVA followed by the post-hoc Tukey test. Differences were considered significant when p < 0.05. * = p < 0.05; ** = p < 0.01; *** = p < 0.001; **** = p < 0.0001. CM, classical monocytes; IM, intermediate monocytes; NCM, non-classical monocytes; nLDL, native low-density lipoproteins; LPS, lipopolysaccharide; IL-1 beta, interleukin 1 beta; MFI, median fluorescence intensity.
Figure 4
Figure 4
Effects of nLDL and LPS on CCR2 and CX3CR1 expression in human monocyte subpopulations. Although no significant differences were found, CCR2 expression was clearly higher in CMs than in IMs and NCMs (A, left, middle, and right panels, respectively). The number of CCR2+ cells increased in the CM subset as compared to IM and NCM subpopulations (B, left, middle, and right panels, respectively). In the NCM subset, LPS acted in synergy with nLDL to increase the amount of CCR2+ cells as compared to that found in cells only treated with nLDL (B, right panel). Expression of CX3CR1 increased in IMs and NCMs as compared to CMs (C, left, middle, and right panels, respectively). In NCMs, nLDL significantly decreased CX3CR1 expression as compared to control cells (C, right panel). LPS, alone or in combination with nLDL, decreased CX3CR1 expression in CMs, IMs, and NCMs (C, left, middle, and right panels, respectively). In IMs, LPS decreased the percentage of CX3CR1+ cells as compared to control cells (D, middle panel). In NCMs, nLDL significantly decreased the amount of CX3CR1+ cells as compared to control cells (D, right panel). Cells were incubated in the presence or absence of 100 μg/mL nLDL and/or 10 ng/mL LPS for 9 h. Data are expressed as mean ± standard deviation. Data were compared using one-way ANOVA followed by the post-hoc Tukey test. Differences were considered significant when p < 0.05. * = p < 0.05; ** = p < 0.01; *** = p < 0.001; **** = p < 0.0001. CM, classical monocytes; IM, intermediate monocytes; NCM, non-classical monocytes; nLDL, native low-density lipoproteins; LPS, lipopolysaccharide; CCR2, C-C chemokine receptor type 2; CX3CR1, CX3C chemokine receptor 1; MFI, median fluorescence intensity.
Figure 5
Figure 5
Levels of CMs, IMs, NCMs, IL-1 beta, and LBP in subjects with optimal and high serum levels of LDL-C. (A) The CM percentage significantly decreased in patients with serum LDL-C > 100 mg/dL (n = 85) as compared to controls (n = 65). (B) There were no significant changes between subjects with optimal and high LDL-C concentration for the IM percentage. (C) The NCM percentage significantly increased in patients with serum LDL-C > 100 mg/dL as compared to controls. (D) IL-1 beta serum levels significantly increased in patients with serum LDL-C > 100 mg/dL as compared to controls. (E) LBP serum levels significantly increased in patients with serum LDL-C > 100 mg/dL as compared to controls. Data are expressed as mean ± standard deviation. Data were compared using the unpaired Student’s t-test. Differences were considered significant when p < 0.05. * = p < 0.05; ** = p < 0.01; **** = p < 0.0001. CM, classical monocytes; IM, intermediate monocytes; NCM, non-classical monocytes; IL-1 beta, interleukin 1 beta; LBP, LPS-binding protein; LDL-C, low-density lipoproteins.

References

    1. Song P., Fang Z., Wang H., Cai Y., Rahimi K., Zhu Y., Fowkes F.G.R., Fowkes F.J.I., Rudan I. Global and regional prevalence, burden, and risk factors for carotid atherosclerosis: A systematic review, meta-analysis, and modelling study. Lancet Glob. Health. 2020;8:e721–e729. doi: 10.1016/S2214-109X(20)30117-0. - DOI - PubMed
    1. Markin A., Sobenin I.A., Grechko A.V., Zhang D., Orekhov A.N. Cellular Mechanisms of Human Atherogenesis: Focus on Chronification of Inflammation and Mitochondrial Mutations. Front. Pharmacol. 2020;11:642. doi: 10.3389/fphar.2020.00642. - DOI - PMC - PubMed
    1. Kloc M., Uosef A., Villagran M., Zdanowski R., Kubiak J., Wosik J., Ghobrial R. RhoA- and Actin-Dependent Functions of Macrophages from the Rodent Cardiac Transplantation Model Perspective—Timing Is the Essence. Biology. 2021;10:70. doi: 10.3390/biology10020070. - DOI - PMC - PubMed
    1. Ganesan R., Henkels K.M., Wrenshall L.E., Kanaho Y., Di Paolo G., Frohman M.A., Gomez-Cambronero J. Oxidized LDL phagocytosis during foam cell formation in atherosclerotic plaques relies on a PLD2-CD36 functional interdependence. J. Leukoc. Biol. 2018;103:867–883. doi: 10.1002/JLB.2A1017-407RR. - DOI - PMC - PubMed
    1. Chen C., Khismatullin D.B. Oxidized Low-Density Lipoprotein Contributes to Atherogenesis via Co-activation of Macrophages and Mast Cells. PLoS ONE. 2015;10:e0123088. doi: 10.1371/journal.pone.0123088. - DOI - PMC - PubMed

Publication types

MeSH terms