. 2021 Jul 21;9(8):853.
doi: 10.3390/biomedicines9080853.

Local Delivery of Pirfenidone by PLA Implants Modifies Foreign Body Reaction and Prevents Fibrosis

Affiliations

Local Delivery of Pirfenidone by PLA Implants Modifies Foreign Body Reaction and Prevents Fibrosis

Alexey Fayzullin et al. Biomedicines. .

Abstract

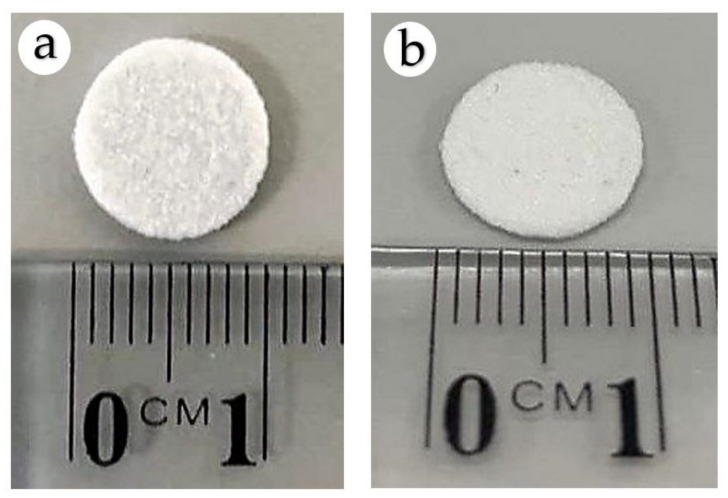
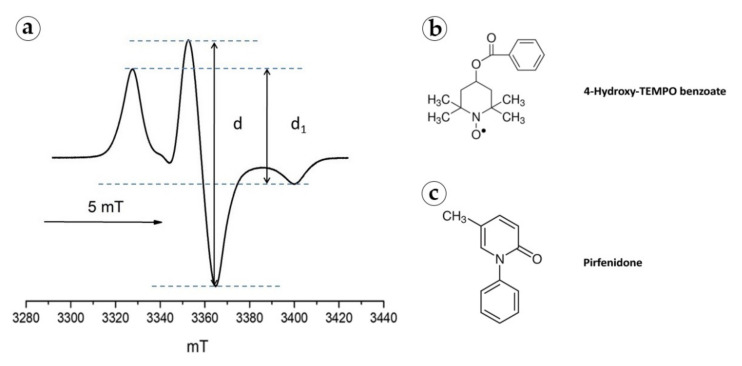
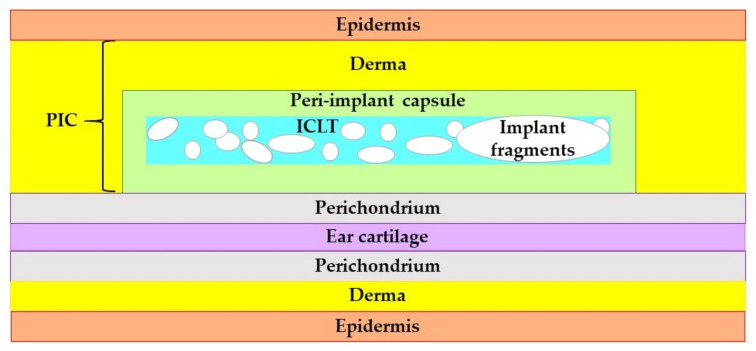
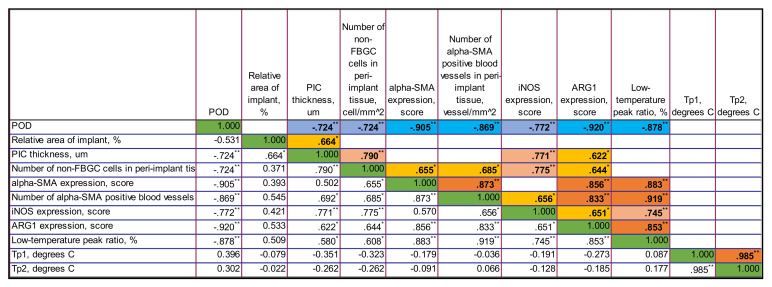
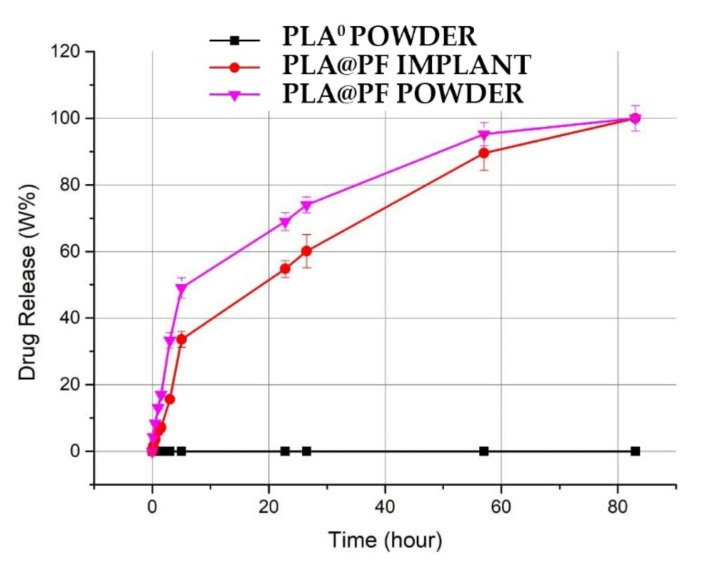
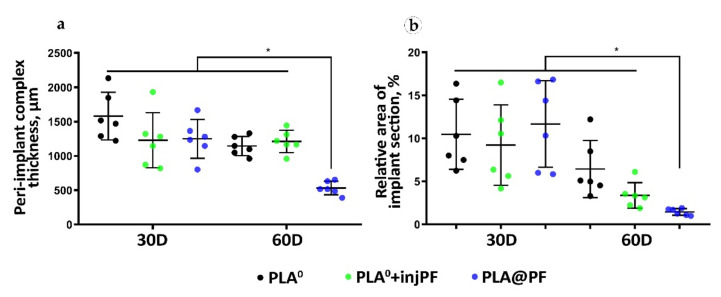
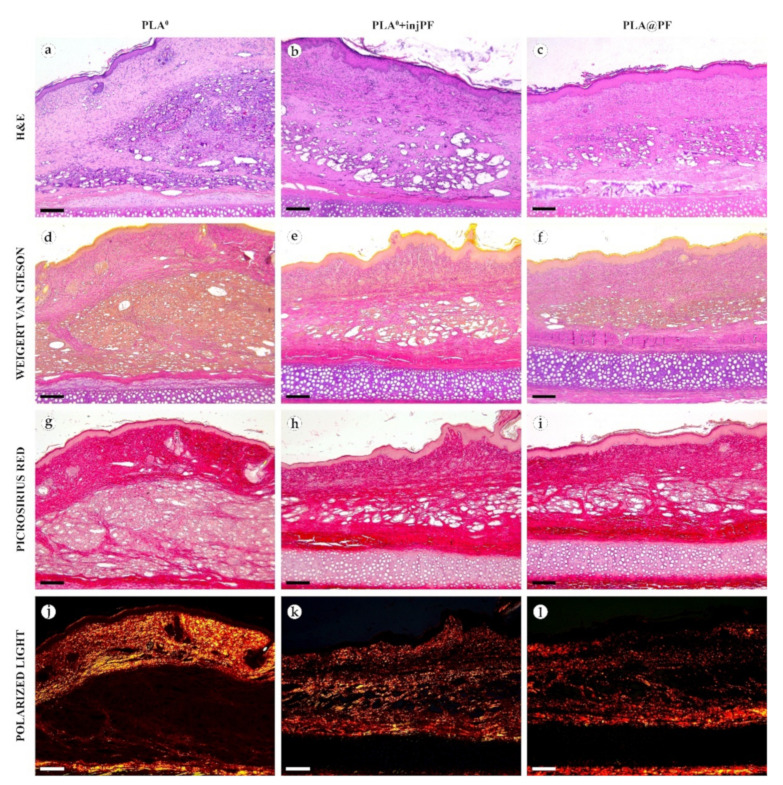
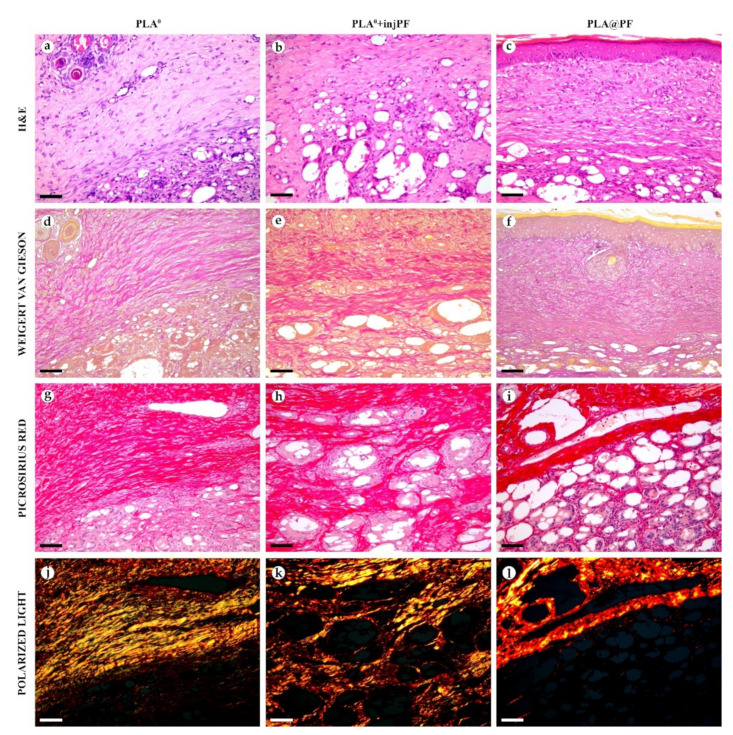
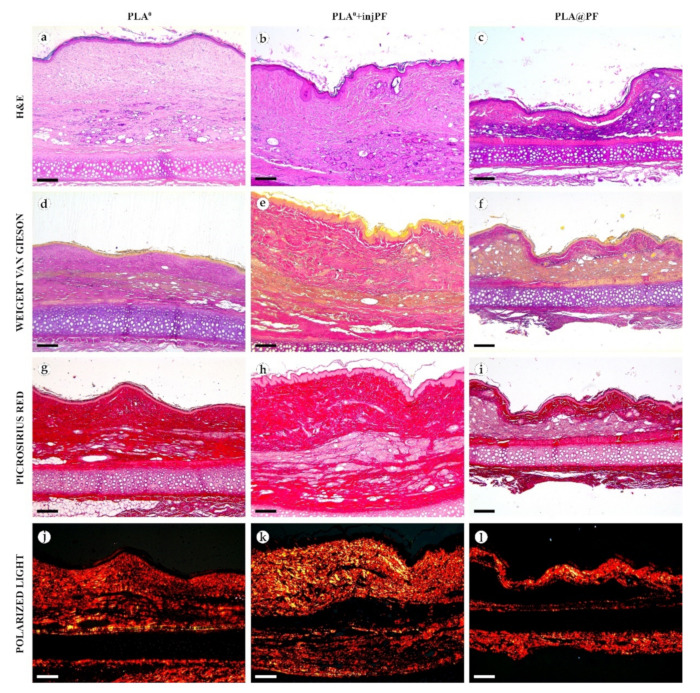
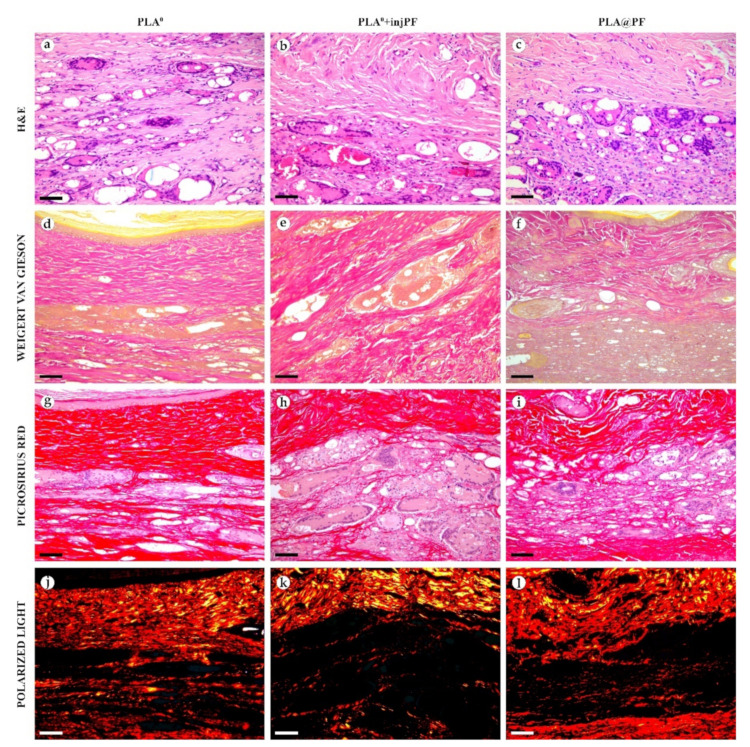
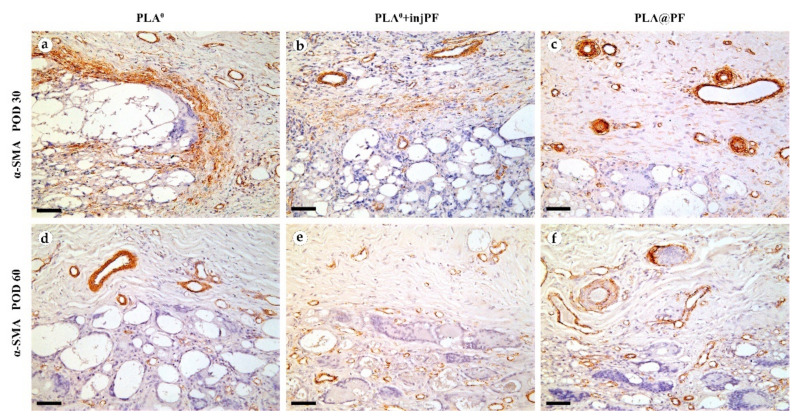
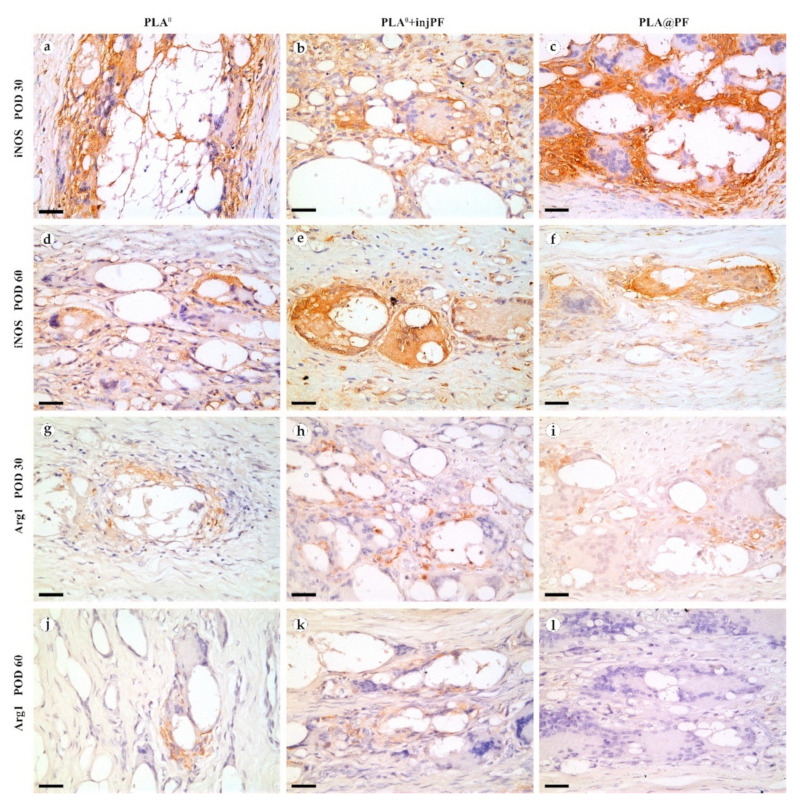
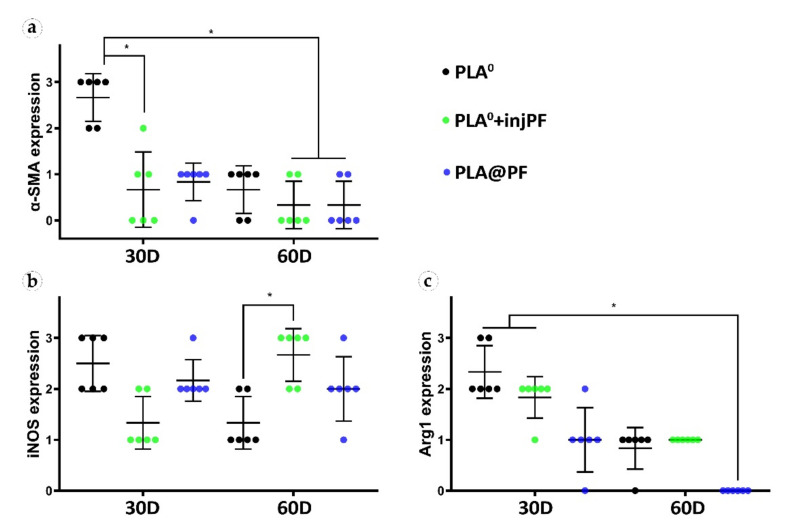
Peri-implant fibrosis (PIF) increases the postsurgical risks after implantation and limits the efficacy of the implantable drug delivery systems (IDDS). Pirfenidone (PF) is an oral anti-fibrotic drug with a short (<3 h) circulation half-life and strong adverse side effects. In the current study, disk-shaped IDDS prototype combining polylactic acid (PLA) and PF, PLA@PF, with prolonged (~3 days) PF release (in vitro) was prepared. The effects of the PLA@PF implants on PIF were examined in the rabbit ear skin pocket model on postoperative days (POD) 30 and 60. Matching blank PLA implants (PLA0) and PLA0 with an equivalent single-dose PF injection performed on POD0 (PLA0+injPF) served as control. On POD30, the intergroup differences were observed in α-SMA, iNOS and arginase-1 expressions in PLA@PF and PLA0+injPF groups vs. PLA0. On POD60, PIF was significantly reduced in PLA@PF group. The peri-implant tissue thickness decreased (532 ± 98 μm vs. >1100 μm in control groups) approaching the intact derma thickness value (302 ± 15 μm). In PLA@PF group, the implant biodegradation developed faster, while arginase-1 expression was suppressed in comparison with other groups. This study proves the feasibility of the local control of fibrotic response on implants via modulation of foreign body reaction with slowly biodegradable PF-loaded IDDS.

Keywords: anti-fibrotic therapy; collagen; fibrosis; foreign body reaction; implantable drug delivery systems; peri-implant fibrosis; pirfenidone; polylactic acid; polymer implants; quantitative histopathology.


Conflict of interest statement

The authors declare no conflict of interests.

Figures

Figure A1
Figure A1
Optical image of PLA0 (a) and PLA@PF (b) implants.
Figure A2
Figure A2
(a) EPR spectrum of 4-Hydroxy-TEMPO benzoate in a PLA implant at 90 K. Structural formulas of 4-Hydroxy-TEMPO benzoate (b) and PF (c).
Figure A3
Figure A3
The schematic representation of the structure and positioning of the PIC in the rabbit ear skin pocket. Unscaled.
Figure A4
Figure A4
The correlation matrix for PLA0 group. Only statistically significant values of Rs are shown in the upper part of the matrix. The color highlights indicate the sign and the strength of the correlation. The tones of blue color show negative correlation, and the ones of orange show the positive correlations. The intensity of the tone reflects the strength of the correlation. The diagonal series of green cells indicates the self-correlation of the same-named variables. ** Correlation is significant at the 0.01 level (2-tailed). * Correlation is significant at the 0.05 level (2-tailed).
Figure A5
Figure A5
The correlation matrix for PLA0+injPF group. Only statistically significant values of Rs are shown in the upper part of the matrix. The color highlights indicate the sign and the strength of the correlation. The tones of blue color show negative correlation, and the ones of orange show the positive correlations. The intensity of the tone reflects the strength of the correlation. The diagonal series of green cells indicates the self-correlation of the same-named variables. ** Correlation is significant at the 0.01 level (2-tailed). * Correlation is significant at the 0.05 level (2-tailed).
Figure A6
Figure A6
The correlation matrix for PLA@PF group. Only statistically significant values of Rs are shown in the upper part of the matrix. The color highlights indicate the sign and the strength of the correlation. The tones of blue color show negative correlation, and the ones of orange show the positive correlations. The intensity of the tone reflects the strength of the correlation. The diagonal series of green cells indicates the self-correlation of the same-named variables. ** Correlation is significant at the 0.01 level (2-tailed). * Correlation is significant at the 0.05 level (2-tailed).
Figure 1
Figure 1
(a,b) SEM of the surface texture of PLA0 (a) and PLA@PF (b) implants. Scale bars 100 μm. (c,d) The histograms of the size distribution of 1500 randomly measured particles and measurements of the contact angles (inserts) of the PLA0 (c) and PLA@PF (d) implants.
Figure 2
Figure 2
Spectrophotometric kinetics of cumulative amount PF release into PBS solution from the PLA@PF powder and PLA@PF laser-sintered implants (n = 3 per group) at 37 °C.
Figure 3
Figure 3
Morphometry of the PIC structure. (a) The total thickness of the PIC, μm. (b) Relative section area of the residual implant materials in the histological specimens, %. Mean ± SD, * p ≤ 0.05.
Figure 4
Figure 4
Histological examination of the peri-implant tissues on POD30, overview of the structure at a low magnification: H&E (ac), VG (df) and PSR (gl) staining, scale bar—200 μm, bright field (ai) and polarized light (jl) microscopies. The images of PSR stained samples taken by bright field and polarized light microscopy are location-matching. Columns depict the studied groups (PLA0, PLA0+injPF and PLA@PF implants).
Figure 5
Figure 5
Histological examination of the peri-implant tissues on POD30, overview of the structure at a high magnification: H&E (ac), VG (df) and PSR (gl) staining, scale bar—50 μm, bright field (ai) and polarized light (jl) microscopies. The images of PSR stained samples taken by bright field and polarized light microscopy are location-matching. Columns depict the studied groups (PLA0, PLA0+injPF and PLA@PF implants).
Figure 6
Figure 6
Histological examination of the peri-implant tissues on POD60, overview of the structure at a low magnification: H&E (ac), VG (df) and PSR (gl) staining, scale bar—200 μm, bright field (ai) and polarized light (jl) microscopies. The images of PSR stained samples taken by bright field and polarized light microscopy are location-matching. Columns depict the studied groups (PLA0, PLA0+injPF and PLA@PF implants).
Figure 7
Figure 7
Histological examination of the peri-implant tissues on POD60, overview of the structure at a high magnification: H&E (ac), VG (df) and PSR (gl) staining, scale bar—50 μm, bright field (ai) and polarized light (jl) microscopies. The images of PSR stained samples taken by bright field and polarized light microscopy are location-matching. Columns depict the studied groups (PLA0, PLA0+injPF and PLA@PF implants).
Figure 8
Figure 8
Expression of α-SMA expression in the PIC on POD30 (ac) and POD60 (df). Scale bar—50 μm, bright field microscopy. Positive staining is reflected by brown color of DAB, counterstaining with hematoxylin. Columns depict the studied groups (PLA0, PLA0+injPF and PLA@PF implants).
Figure 9
Figure 9
iNOS (af) and Arg1 (gl) expression in the PIC on POD30 (a–c) and (gi) and POD60 (df) and (jl). Scale bar—25 μm, bright field microscopy. Positive staining is reflected by brown color of DAB, counterstaining with hematoxylin. Columns depict the studied groups (PLA0, PLA0+injPF and PLA@PF implants).
Figure 10
Figure 10
Semi-quantitative scoring analysis of the expression of immunohistochemical markers in PIC examined by the intensity of staining (see Table 1 for the criteria): (a) α-SMA, (b) iNOS, and (c) Arg1. The results are presented as scatterplots, Mean ± SD, * p ≤ 0.05.
Figure 11
Figure 11
Thermography of peri-implant tissues around PLA0 (black), PLA0+injPF (red) and PLA@PF (blue) implants on POD 30 (a) and POD60 (b). The thermogram of intact ear derma tissue is shown by purple color.

References

    1. Kleiner L.W., Wright J.C., Wang Y. Evolution of implantable and insertable drug delivery systems. J. Control. Release. 2014;181:1–10. doi: 10.1016/j.jconrel.2014.02.006. - DOI - PubMed
    1. Coleman D.L., King R.N., Andrade J.D. The foreign body reaction: A chronic inflammatory response. J. Biomed. Mater. Res. 1974;8:199–211. doi: 10.1002/jbm.820080503. - DOI - PubMed
    1. Anderson J.M., Rodriguez A., Chang D.T. Foreign body reaction to biomaterials. Semin. Immunol. 2008;20:86–100. doi: 10.1016/j.smim.2007.11.004. - DOI - PMC - PubMed
    1. Klopfleisch R., Jung F. The pathology of the foreign body reaction against biomaterials. J. Biomed. Mater. Res. Part A. 2017;105:927–940. doi: 10.1002/jbm.a.35958. - DOI - PubMed
    1. Mariani E., Lisignoli G., Borzi R.M., Pulsatelli L. Biomaterials: Foreign Bodies or Tuners for the Immune Response? Int. J. Mol. Sci. 2019;20:636. doi: 10.3390/ijms20030636. - DOI - PMC - PubMed