. 2021 Jul 29;9(8):912.
doi: 10.3390/biomedicines9080912.

IGF1R as a Potential Pharmacological Target in Allergic Asthma

Affiliations

IGF1R as a Potential Pharmacological Target in Allergic Asthma

Elvira Alfaro-Arnedo et al. Biomedicines. .

Erratum in

Abstract

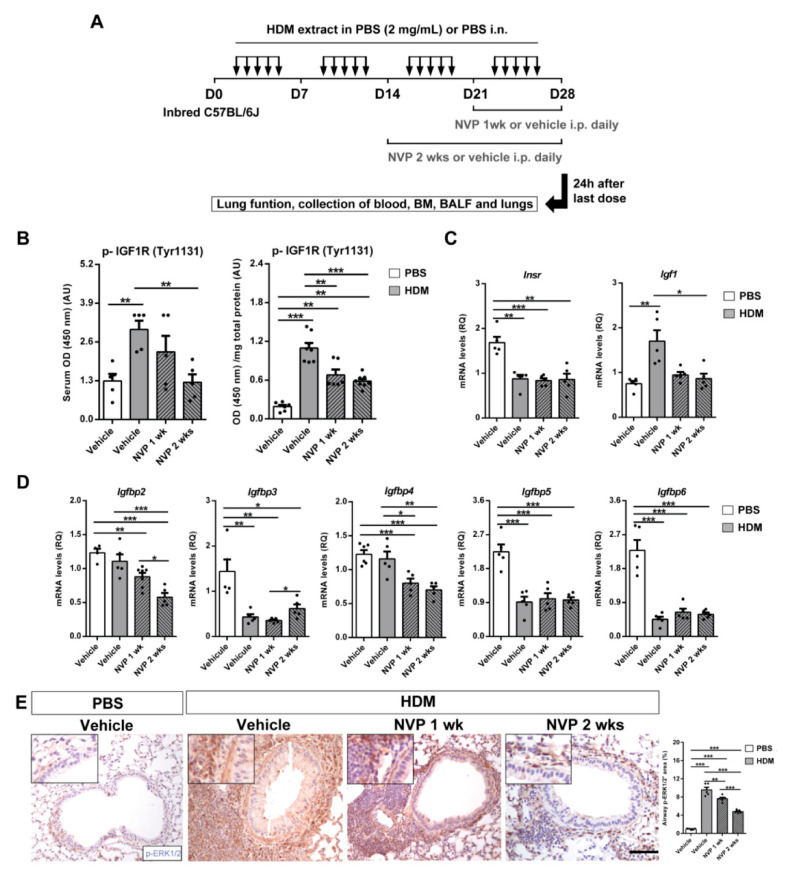
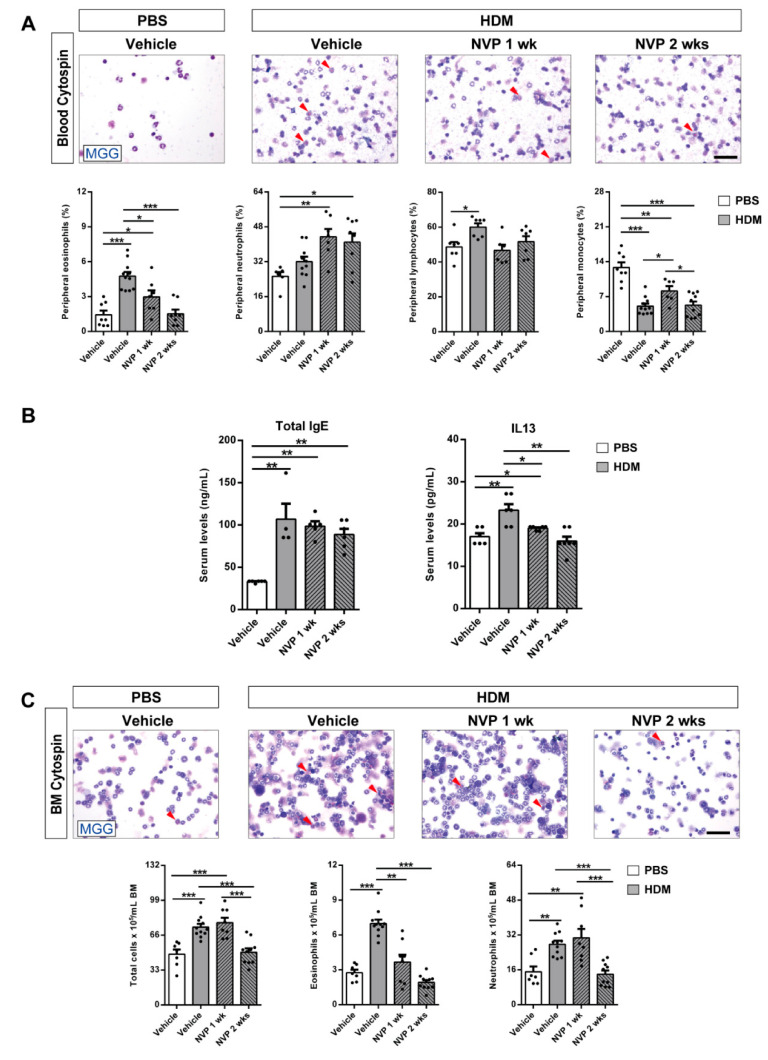
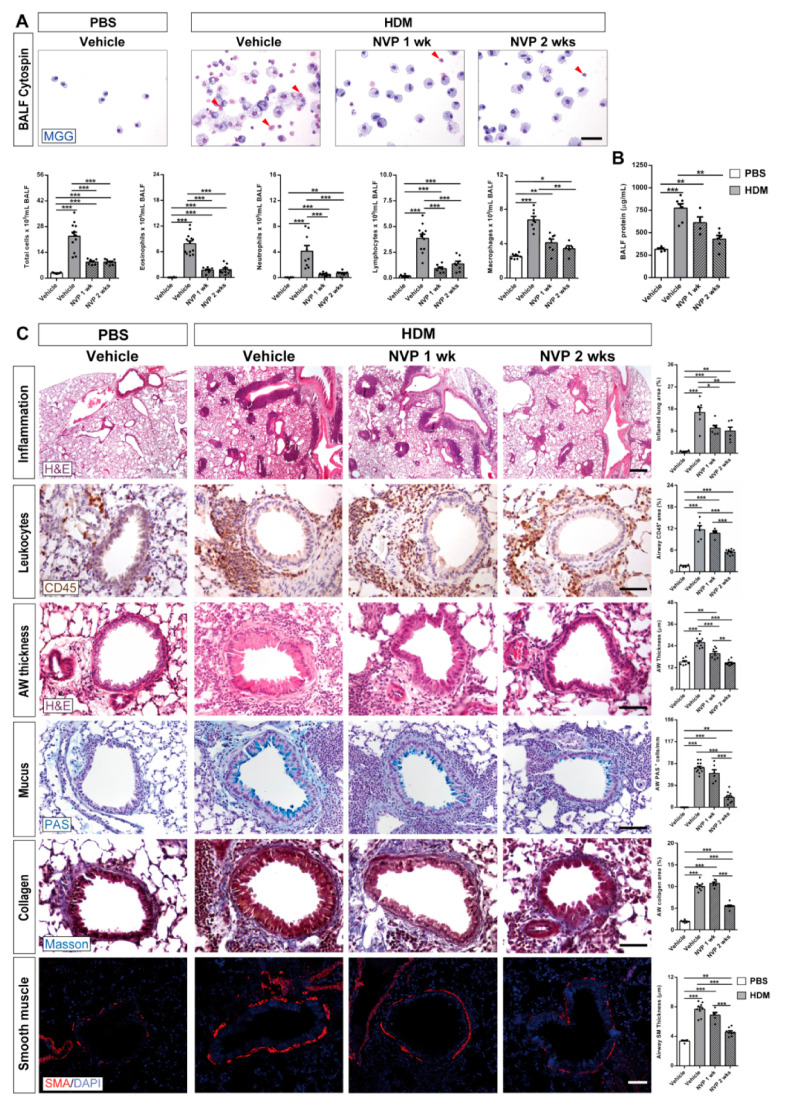
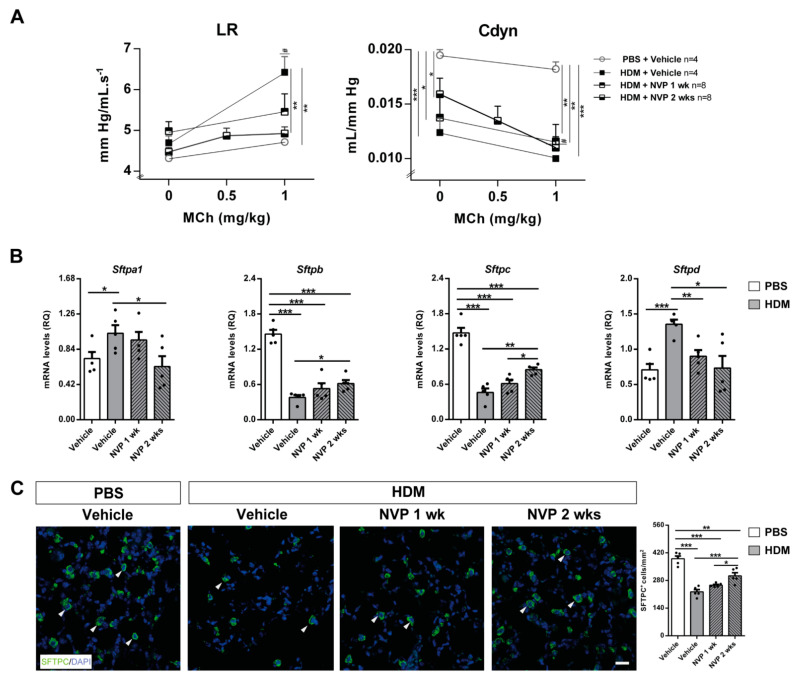
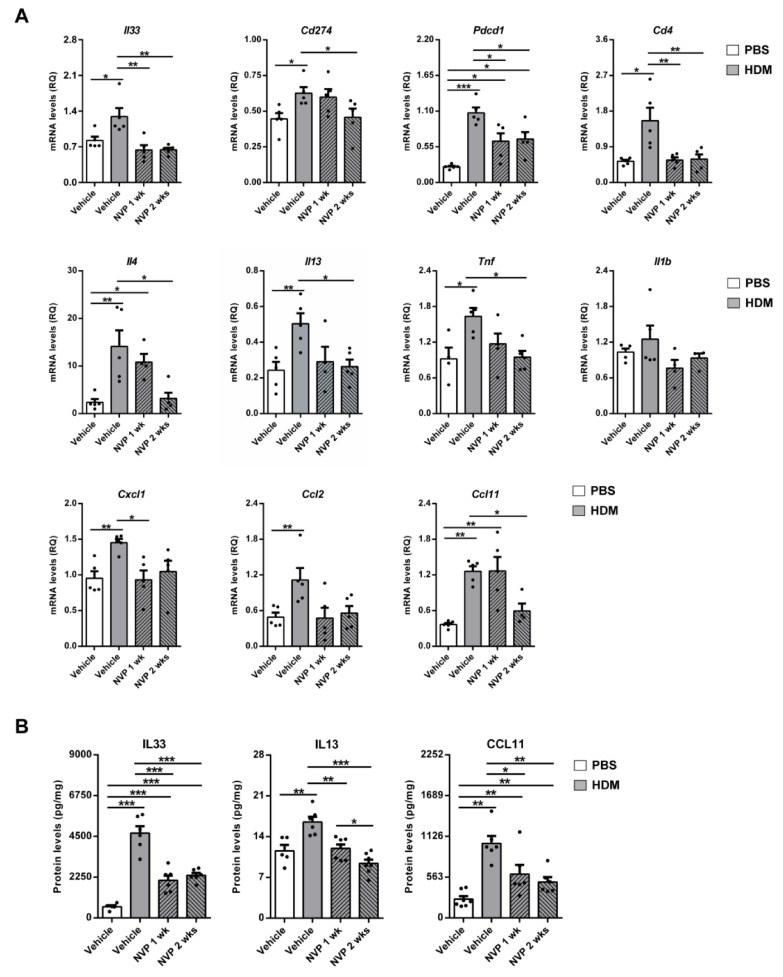
Background: Asthma is a chronic lung disease characterized by reversible airflow obstruction, airway hyperresponsiveness (AHR), mucus overproduction and inflammation. Although Insulin-like growth factor 1 receptor (IGF1R) was found to be involved in asthma, its pharmacological inhibition has not previously been investigated in this pathology. We aimed to determine if therapeutic targeting of IGF1R ameliorates allergic airway inflammation in a murine model of asthma.

Methods: C57BL/6J mice were challenged by house dust mite (HDM) extract or PBS for four weeks and therapeutically treated with the IGF1R tyrosine kinase inhibitor (TKI) NVP-ADW742 (NVP) once allergic phenotype was established.

Results: Lungs of HDM-challenged mice exhibited a significant increase in phospho-IGF1R levels, incremented AHR, airway remodeling, eosinophilia and allergic inflammation, as well as altered pulmonary surfactant expression, all of being these parameters counteracted by NVP treatment. HDM-challenged lungs also displayed augmented expression of the IGF1R signaling mediator p-ERK1/2, which was greatly reduced upon treatment with NVP.

Conclusions: Our results demonstrate that IGF1R could be considered a potential pharmacological target in murine HDM-induced asthma and a candidate biomarker in allergic asthma.

Keywords: IGF1R; NVP-ADW742; allergy; asthma; house dust mite; pharmacological blockade.


Conflict of interest statement

The authors declare no conflict of interest.

Figures

Figure 1
Figure 1
Protocol for HDM exposure and treatment with the IGF1R inhibitor NVP, as well as p-IGF1R and IGF system gene expression levels in the lung. (A) Mice were challenged by intranasal (i.n.) administration of HDM extract in phosphate buffer saline (PBS) or equal volume of vehicle, five days a week for four weeks. Mice also received intraperitoneal (i.p.) injections of the IGF1R inhibitor NVP or equal volume of the vehicle (2% DMSO) twice daily during the last one (NVP 1 week) or two weeks (NVP 2 weeks) of the HDM protocol. Lung function assessment and collection of blood, bone marrow (BM), BALF and lungs were performed 24h after the last exposure on day (D) 28. (B) p-IGF1R protein levels in both serum and lung homogenates from HDM-challenged mice treated with NVP vs. controls (n = 6–8 mice per group). (C,D) Lung tissue mRNA expression of IGF system-related genes Insr, Igf1 (C), and Igfbp2, Igfbp3, Igfbp4, Igfbp5, Igfbp6 (D) normalized to 18S expression in HDM-challenged mice treated with NVP vs. controls (n = 5 mice per group). (E) Representative immunostains of proximal airways for p-ERK1/2 (p-42/44) (brown), and quantification of p-ERK1/2+ area (%) in lung sections from HDM-challenged mice treated with NVP vs. controls (n = 5 mice per group; scale bar: 50 µm). Insets illustrate p-ERK1/2 expression in smooth muscle cells and peribronchiolar areas. Data are expressed as mean ± SEM. * p < 0.05; ** p < 0.01; *** p < 0.001 (Mann–Whitney U test or Student´s t-test for comparing two groups, and Kruskal–Wallis test or ANOVA multiple comparison test for grouped or multivariate analysis).
Figure 2
Figure 2
Pharmacological blockade of IGF1R depletes eosinophil presence in peripheral blood and bone marrow and attenuates the increase in serum IL13 levels after HDM exposure. (A,C) Representative images showing May-Grünwald/Giemsa (MGG) stained peripheral blood and bone marrow cytospin preparations (red arrowheads indicate eosinophils), and differential cell counts for eosinophils, neutrophils, lymphocytes and monocytes in peripheral blood (A), and total cells, eosinophils and neutrophils in bone marrow (C) from HDM-challenged mice treated with NVP vs. controls (n = 7–10 mice per group; scale bars: 50 µm). (B) Total serum IgE and IL13 levels from HDM-challenged mice treated with NVP vs. controls (n = 5–7 mice per group). Data are expressed as mean ± SEM. * p < 0.05; ** p < 0.01; *** p < 0.001 (Mann–Whitney U test or Student´s t-test for comparing two groups and Kruskal–Wallis test or ANOVA multiple comparison test for grouped or multivariate analysis).
Figure 3
Figure 3
Pharmacological blockade of IGF1R attenuates pulmonary pathology after HDM induced allergy. (A) Representative images showing May-Grünwald/Giemsa (MGG) stained BALF cytospin preparations (red arrowheads indicate eosinophils), and total and differential BALF cell counts for eosinophils, neutrophils, lymphocytes and macrophages in HDM-challenged mice treated with NVP vs. controls (n = 7–12 mice per group; scale bar: 50 µm). (B) Total protein concentration in BALF of HDM-challenged mice treated with NVP vs. controls (n = 5–8 mice per group). (C) Representative images of lung inflammation and histopathology of the proximal airways, and respective quantifications of inflamed lung areas (%) (H&E), presence of peribronchiolar CD45+ area (leukocytes) (%) (brown), airway (AW) epithelium thickness (H&E), number of airway PAS+ cells (mucus-producing cells) (blue), peribronchiolar airway collagen content (%) (Masson in blue) and airway smooth muscle (SM) thickness (SMA in red). These parameters were measured in lung sections from HDM-challenged mice treated with NVP vs. controls (n = 6–10 mice per group; scale bars: 50 µm except for the inflammation panel (400 µm)). Quantifications were performed in five different fields in a random way. Data are expressed as mean ± SEM. * p < 0.05; ** p < 0.01; *** p < 0.001 (Mann–Whitney U test or Student´s t-test for comparing two groups and Kruskal–Wallis test or ANOVA multiple comparison test for grouped or multivariate analysis).
Figure 4
Figure 4
Therapeutic inhibition of IGF1R attenuates AHR and normalizes pulmonary surfactant expression upon HDM-induced allergy. (A) Quantification of lung resistance (LR) and dynamic compliance (Cdyn) to methacholine (MCh) evaluated by plethysmography (n = 4–8 mice per group) and (B) changes in lung tissue mRNA expression surfactant (Sftp) markers Sftpa1, b, c and d, normalized to 18S expression in HDM-challenged mice treated with NVP vs. controls (n = 5 mice per group). (C) Representative immunostains for SFTPC (green) (white arrowheads), and quantification of the number of SFTPC+ cells per unit area (mm2) in lung sections from HDM-challenged mice treated with NVP vs. controls (n = 5–10 mice per group; scale bar: 50 µm). Data are expressed as mean ± SEM. * p < 0.05; ** p < 0.01; *** p < 0.001; # p < 0.05 (comparisons within the same group) (Mann–Whitney U test or Student´s t-test for comparing two groups and Kruskal–Wallis test or ANOVA multiple comparison test for grouped or multivariate analysis).
Figure 5
Figure 5
Therapeutic inhibition of IGF1R diminishes expression of allergic airway inflammation markers after HDM exposure. (A) Lung tissue mRNA expression levels of Il33 (dendritic cell activation), Cd274 (PD-L1) and Pdcd1 (PD-1) (T cell response), Cd4 (T cell marker), Il4 and Il13 (Th2 cytokines), Tnf and Il1b (Th1 cytokines), Cxcl1 (neutrophil chemotaxis), Ccl2 (macrophage chemotaxis) and Ccl11 (eosinophil chemotaxis) normalized to 18S expression in HDM-challenged mice treated with NVP vs. controls (n = 5 mice per group). (B) IL33, IL13 and CCL11 protein levels in lung homogenates from HDM-challenged mice treated with NVP vs. controls (n = 5–7 mice per group). Data are expressed as mean ± SEM. * p < 0.05; ** p < 0.01; *** p < 0.001 (Mann–Whitney U test or Student´s t-test for comparing two groups and Kruskal–Wallis test or ANOVA multiple comparison test for grouped or multivariate analysis).
Figure 6
Figure 6
Pharmacological targeting of IGF1R attenuates bronchial differentiation and goblet cell hyperplasia upon HDM-induced allergy. (A) Representative immunostains of proximal airways for SOX2 (bronchial differentiation) (brown; orange arrowheads indicate SOX2+ cells), as well as double immunofluorescent stains for SCGB1A1 (red) (club cell marker) and MUC5AC (green) (goblet cell hyperplasia) (white arrowheads indicate double SCGB1A1+-MUC5AC+ cells). Quantification of SOX2+ and double SCGB1A1+-MUC5AC+ cells per epithelium length (mm) in lung sections from HDM-challenged mice treated with NVP vs. controls (n = 5–10 mice per group; scale bars: 50 µm). (B) Lung mRNA expression levels of Sox2 (bronchial differentiation) and Foxm1, Spdef and Muc5ac markers (goblet cell hyperplasia) normalized to 18S expression in HDM-challenged mice treated with NVP vs. controls (n = 5 mice per group). Quantifications in lung sections were performed in 5 different bronchi in a random manner. Data are expressed as mean ± SEM. * p < 0.05; ** p < 0.01; *** p < 0.001 (Mann–Whitney U test or Student´s t-test for comparing two groups and Kruskal–Wallis test or ANOVA multiple comparison test for grouped or multivariate analysis).

References

    1. Fahy J.V. Type 2 Inflammation in Asthma-Present in Most, Absent in Many. Nat. Rev. Immunol. 2015;15:57–65. doi: 10.1038/nri3786. - DOI - PMC - PubMed
    1. Gregory L.G., Lloyd C.M. Orchestrating House Dust Mite-Associated Allergy in the Lung. Trends Immunol. 2011;32:402–411. doi: 10.1016/j.it.2011.06.006. - DOI - PMC - PubMed
    1. Calderón M.A., Linneberg A., Kleine-Tebbe J., De Blay F., de Rojas D.H.F., Virchow J.C., Demoly P. Respiratory Allergy Caused by House Dust Mites: What do We Really Know? J. Allergy Clin. Immunol. 2015;136:38–48. doi: 10.1016/j.jaci.2014.10.012. - DOI - PubMed
    1. Kuo C.H.S., Pavlidis S., Loza M., Baribaud F., Rowe A., Pandis I., Hoda U., Rossios C., Sousa A., Wilson S.J., et al. A Transcriptome-Driven Analysis of Epithelial Brushings and Bronchial Biopsies to Define Asthma Phenotypes in U-BIOPRED. Am. J. Respir. Crit. Care Med. 2017;195:443–455. doi: 10.1164/rccm.201512-2452OC. - DOI - PubMed
    1. Kuruvilla M.E., Lee F.E.-H., Lee G.B. Understanding Asthma Phenotypes, Endotypes and Mechanisms of Disease. Clin. Rev. Allergy Immunol. 2019;56:219–233. doi: 10.1007/s12016-018-8712-1. - DOI - PMC - PubMed

LinkOut - more resources