. 2021 Aug 17;9(8):1031.
doi: 10.3390/biomedicines9081031.

Interleukin-30 Suppresses Not Only CD4+ T Cells but Also Regulatory T Cells in Murine Primary Biliary Cholangitis

Affiliations

Interleukin-30 Suppresses Not Only CD4+ T Cells but Also Regulatory T Cells in Murine Primary Biliary Cholangitis

Hung-Wen Chen et al. Biomedicines. .

Abstract

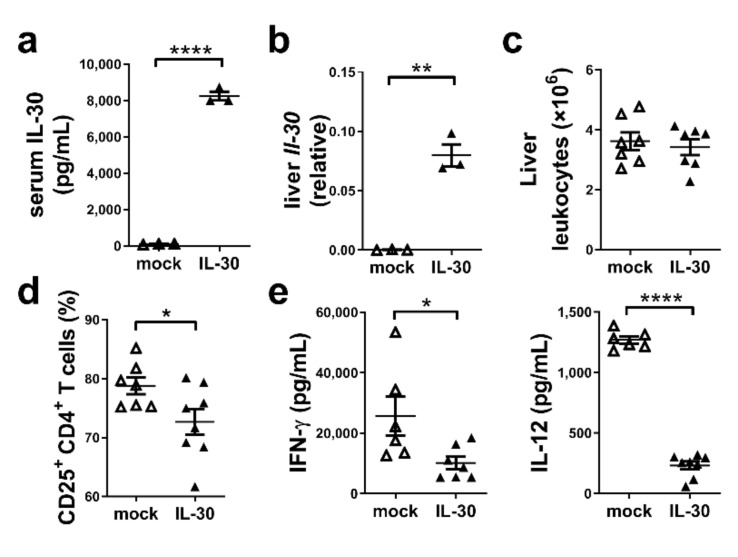
Primary biliary cholangitis (PBC) is a chronic liver autoimmune disease with augmented T helper (Th) 1 and corresponding cytokine IFN-γ immune responses. Using 2-octynoic acid (2-OA) coupled to OVA (2-OA-OVA)-induced mouse models of autoimmune cholangitis (inducible chemical xenobiotic models of PBC), our previous study demonstrated that overexpression of IFN-γ in the model mice enhanced liver inflammation upon disease initiation, but subsequently led to the suppression of chronic inflammation with an increase in interleukin-30 (IL-30) levels. In this study, we investigated whether IL-30 had an immunosuppressive function and whether it could be part of an immune therapeutic regimen for PBC, by treating model mice with murine IL-30-expressing recombinant adeno-associated virus (AAV-mIL-30). We first defined the effects of AAV-mIL-30 in vivo by administering it to a well-known concanavalin A (ConA)-induced hepatitis model of mice and found that AAV-mIL-30 reduced the numbers of activated CD25+CD4+ T cells and the levels of serum IFN-γ and IL-12. In autoimmune cholangitis, decreased numbers of activated CD4+ T cells and Foxp3+ regulatory T cells were noted in the mice treated with AAV-mIL-30 at 3 weeks after the 2-OA-OVA immunization. Treatment with IL-30 did not change the features of autoimmune cholangitis including autoantibodies, cell infiltration, and collagen deposition in the liver at 11 weeks of examination. However, increased levels of cytokines and chemokines were observed. These results suggest that IL-30 suppresses not only CD4+ T cells but also regulatory T cells. Additionally, the administration of IL-30 did not suppress liver inflammation in the murine model of PBC.

Keywords: CD4+ T cells; autoimmune disease; immune therapy; interleukin-30; primary biliary cholangitis.


Conflict of interest statement

The authors declare no conflict of interest. The funders had no role in the design of the study; in the collection, analyses, or interpretation of data; in the writing of the manuscript, or in the decision to publish the results.

Figures

Figure 1
Figure 1
The administration of AAV-mIL-30 reduced the number of CD25+CD4+ T cells and serum IFN-γ and IL-12 levels in ConA-induced hepatitis mice. Mice were injected with ConA for the induction of hepatitis. AAV-mock or AAV-mIL-30 were administered 5 days before ConA injection. Sera and liver tissues were collected at 4 h after ConA injection. (a) Serum levels of IL-30 were detected using ELISA. (b) Liver IL-30 mRNA expression was detected using RT-qPCR. Relative quantification was performed with the 2−ΔCT method. (c) The number of liver leukocytes was counted. (d) The level of CD25 expression on CD4+ T cells was analyzed using flow cytometry. (e) Serum levels of IFN-γ and IL-12 were detected. Each dot represents an individual mouse. n = 3–7 mice per group. All error bars denote ±SEM. *, p < 0.05; **, p < 0.01; ****, p < 0.0001.
Figure 2
Figure 2
Administration of AAV-mIL-30 decreased the activation of CD4+ T cells in 2-OA-OVA-induced autoimmune cholangitis mice. Foxp3GFP mice were injected with AAV-mIL-30 or AAV-mock at 3 weeks after the first 2-OA-OVA immunization and sacrificed at Week 5. Liver leukocytes were isolated. (a) Representative flow plots show gating strategies of different subsets of lymphocytes. (b) Representative flow plots show CD25 expression on CD4+ and CD8+ T cells, NK cells, and NKT cells. (c) The levels of CD25 expression on CD4+ and CD8+ T cells, NK cells, and NKT cells were analyzed using flow cytometry. (d,e) Liver leukocytes were stimulated with phorbol-myristate acetate (PMA) and ionomycin for 4 h, and IFN-γ production in cells was analyzed using intracellular staining and flow cytometry. (d) Representative flow cytometry analysis and graphical summary of the level of IFN-γ secretion in liver CD4+ T cells. (e) The levels of IFN-γ secretion in liver CD8+ T, NK, and NKT cells. Each dot represents an individual mouse. n = 12–20 mice per group. All error bars denote ±SEM. *, p < 0.05; **, p < 0.01.
Figure 3
Figure 3
Administration of AAV-mIL-30 decreased the numbers of Foxp3-Tregs in 2-OA-OVA-induced autoimmune cholangitis mice. Foxp3GFP mice were injected with AAV-mIL-30 or AAV-mock at 3 weeks after the first 2-OA-OVA immunization and sacrificed at Week 5. (a) The numbers of leukocytes in the liver were measured. (b) The numbers of B, NK, and NKT cells in the liver were measured. (c) The numbers of CD4+ and CD8+ T cells in the liver were measured. (d) The percentages and numbers of CD4+ Foxp3-Tregs in the liver were measured. Each dot represents an individual mouse. n = 12–20 mice per group. All error bars denote ±SEM. *, p < 0.05; **, p < 0.01.
Figure 4
Figure 4
IL-30 did not affect antigen-presenting cells in 2-OA-OVA-induced autoimmune cholangitis mice. Mice were injected with AAV-mIL-30 or AAV-mock at 3 weeks after the first 2-OA-OVA immunization and sacrificed at Week 5. (a) Representative flow plots show gating strategies of conventional dendritic cells (cDCs) and plasmacytoid dendritic cells (pDCs). (b) The percentage and H-2Kb, I-Ab, and CD80 expression of cDCs and pDCs were detected using flow cytometry. cDCs were identified as CD3NK1.1 CD11c+B220 cells, whereas pDCs were identified as CD3NK1.1CD11c+B220+ cells. (c) Liver leukocytes were isolated, stimulated with LPS or ODN2395, and their cytokine/chemokine production was detected by performing a fluorescent bead-based multiplex immunoassay. Each dot represents an individual mouse. n = 4–6 mice per group. All error bars denote ±SEM. *, p < 0.05.
Figure 5
Figure 5
Administration of AAV-mIL-30 did not alleviate the disease. Mice were injected with AAV-mIL-30 or AAV-mock at 3 weeks after the first 2-OA-OVA immunization and sacrificed at Week 11. (a) Serum levels of IL-30 in AAV-mIL-30-injected mice. IL-30 was undetectable in mice treated with AAV-mock. (b) Serum levels of anti-PDC-E2 IgM and IgG were measured using ELISA. A.U. arbitrary unit. (c,d) Representative pictures of liver tissue stained with (c) hematoxylin and eosin (H&E) (scale bar, 100×, 100 μm; 400×, 300 µm) and (d) Masson’s trichrome (scale bar, 50 µm). (e) Liver cell infiltrates were counted. (f) The expression of collagen I and collagen III mRNA in the liver was detected using RT-qPCR. (g) Liver IFN-γ and TNF-α mRNA expression was detected using RT-qPCR. Relative quantification was performed by 2−ΔCT method and multiplied by 10,000. Each dot represents an individual mouse. n = 15–17 mice per group. All error bars denote ±SEM. *, p < 0.05.
Figure 6
Figure 6
Administration of AAV-mIL-30 induced an increase in the levels of various cytokines and chemokines. Mice were injected with AAV-mIL-30 or AAV-mock at 3 weeks after the 2-OA-OVA immunization, and the serum levels of cytokines and chemokines were measured at Week 11 by performing fluorescent bead-based multiplex immunoassay. Each dot represents an individual mouse. n = 15–17 mice per group. All error bars denote ±SEM. *, p < 0.05.
Figure 7
Figure 7
Schematic summary of this study. Infiltrating immune cells such as CD4+ T, CD8+, NK, NKT, and B cells mediate the destruction of intrahepatic small bile ducts and lead to liver inflammation and fibrosis in PBC. Tregs can suppress various immune cells. IL-30 suppresses the number of infiltrating activated CD4+ T cells. However, IL-30 also decreases the number of immunosuppressive Tregs. Hence, the administration of IL-30 did not suppress, but slightly enhanced, liver inflammation in the murine model of PBC.

References

    1. Hirschfield G.M., Gershwin M.E. The immunobiology and pathophysiology of primary biliary cirrhosis. Annu. Rev. Pathol. 2013;8:303–330. doi: 10.1146/annurev-pathol-020712-164014. - DOI - PubMed
    1. Beuers U., Gershwin M.E., Gish R.G., Invernizzi P., Jones D.E., Lindor K., Ma X., Mackay I.R., Pares A., Tanaka A., et al. Changing nomenclature for pbc: From ‘cirrhosis’ to ‘cholangitis’. Hepatology. 2015;62:1620–1622. doi: 10.1002/hep.28140. - DOI - PubMed
    1. Harada K., Van de Water J., Leung P.S., Coppel R.L., Ansari A., Nakanuma Y., Gershwin M.E. In situ nucleic acid hybridization of cytokines in primary biliary cirrhosis: Predominance of the th1 subset. Hepatology. 1997;25:791–796. doi: 10.1002/hep.510250402. - DOI - PubMed
    1. Nagano T., Yamamoto K., Matsumoto S., Okamoto R., Tagashira M., Ibuki N., Matsumura S., Yabushita K., Okano N., Tsuji T. Cytokine profile in the liver of primary biliary cirrhosis. J. Clin. Immunol. 1999;19:422–427. doi: 10.1023/A:1020511002025. - DOI - PubMed
    1. Krams S.M., Cao S., Hayashi M., Villanueva J.C., Martinez O.M. Elevations in ifn-gamma, il-5, and il-10 in patients with the autoimmune disease primary biliary cirrhosis: Association with autoantibodies and soluble cd30. Clin. Immunol. Immunopathol. 1996;80:311–320. doi: 10.1006/clin.1996.0129. - DOI - PubMed