. 2021 Aug 20;9(8):1057.
doi: 10.3390/biomedicines9081057.

The Histone Variant MacroH2A1 Impacts Circadian Gene Expression and Cell Phenotype in an In Vitro Model of Hepatocellular Carcinoma

Affiliations

The Histone Variant MacroH2A1 Impacts Circadian Gene Expression and Cell Phenotype in an In Vitro Model of Hepatocellular Carcinoma

Annalucia Carbone et al. Biomedicines. .

Abstract

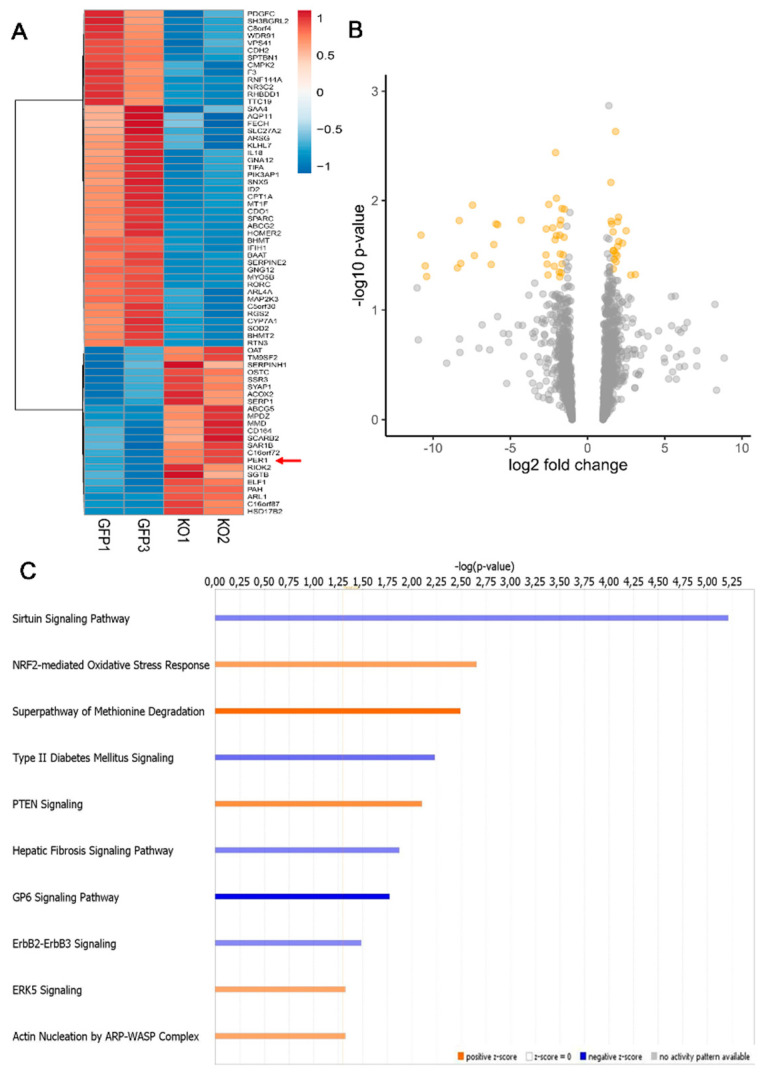
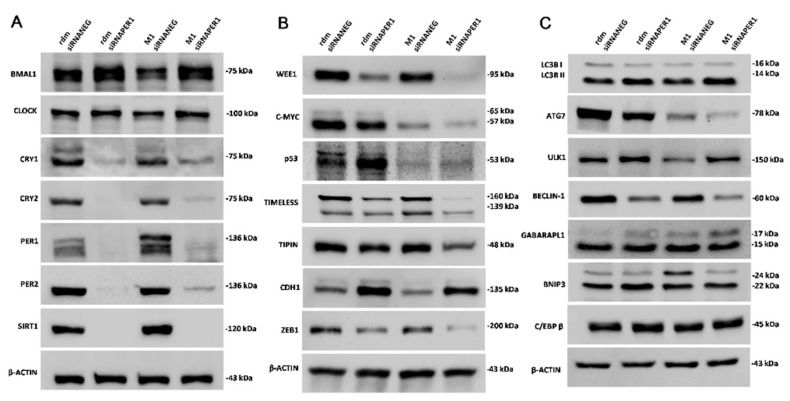
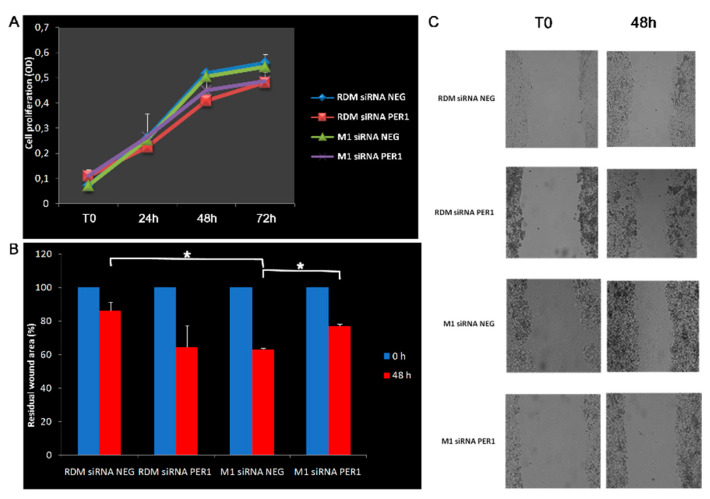
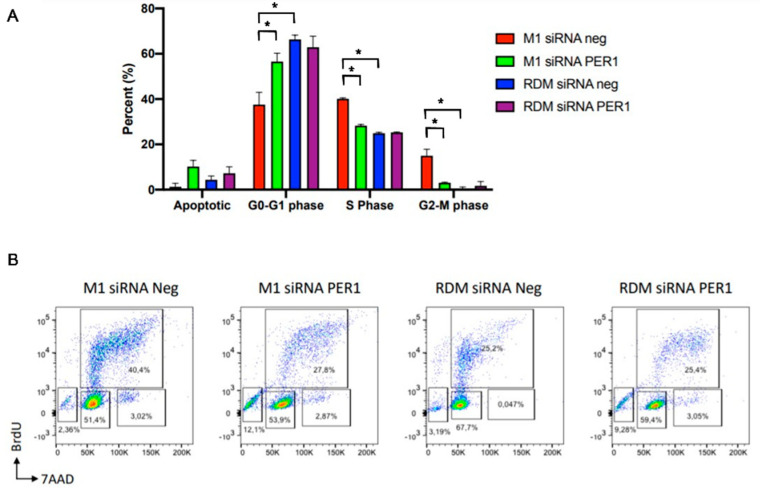
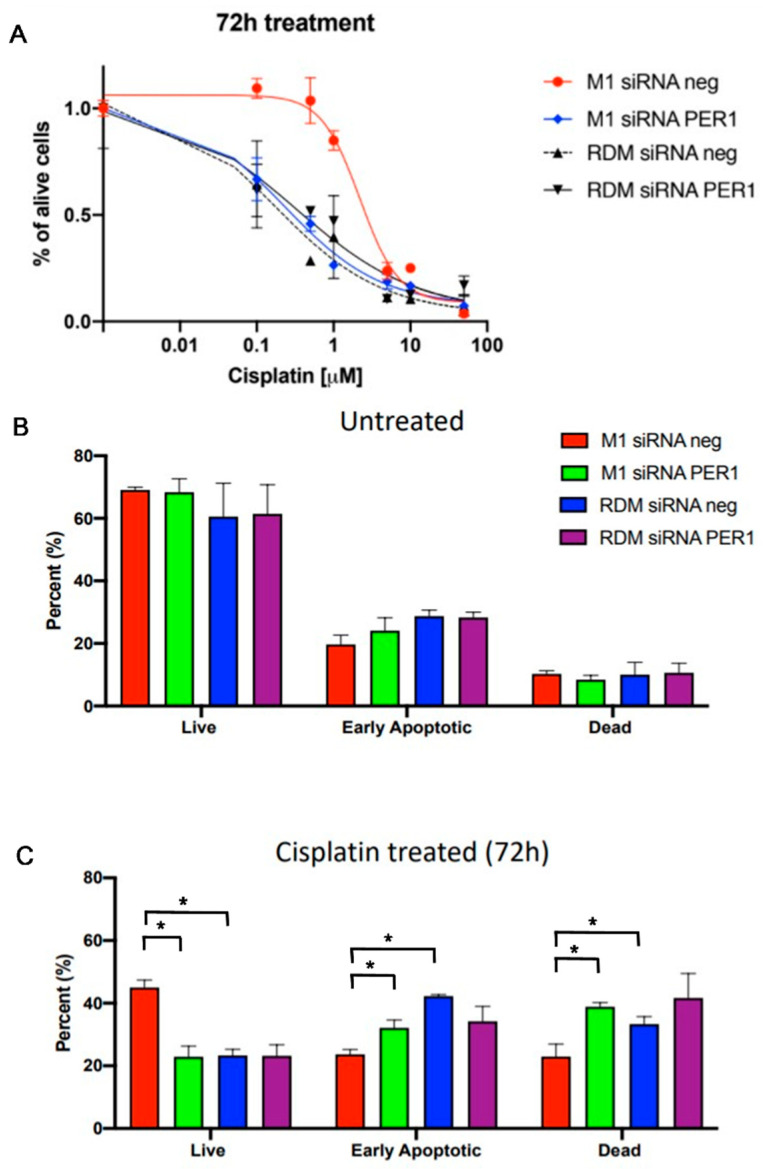
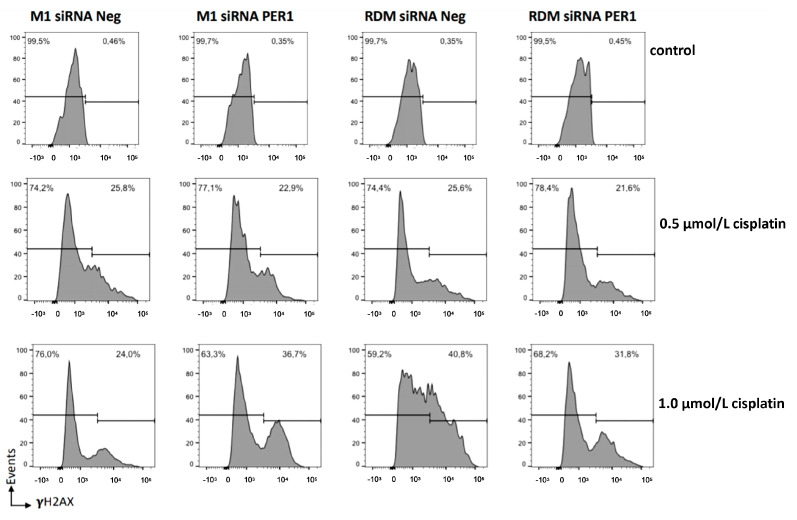
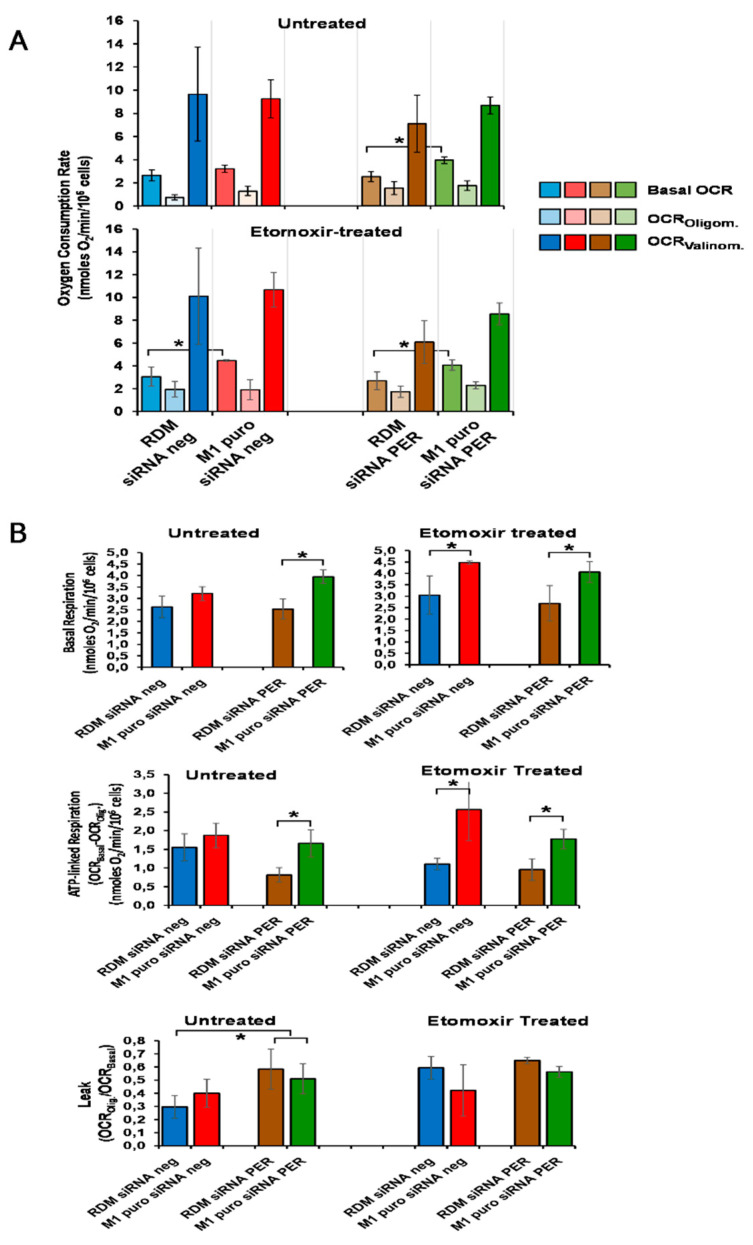
Hepatocellular carcinoma (HCC) is a leading cause of cancer-related death worldwide. A foremost risk factor for HCC is obesity/metabolic syndrome-related non-alcoholic fatty liver disease (NAFLD) and non-alcoholic steatohepatitis (NASH), which is prompted by remarkable changes in transcription patterns of genes enriching metabolic, immune/inflammatory, and circadian pathways. Epigenetic mechanisms play a role in NAFLD-associated HCC, and macroH2A1, a variant of histone H2A, is involved in the pathogenesis modulating the expression of oncogenes and/or tumor suppressor genes and interacting with SIRT1, which crucially impacts the circadian clock circuitry. Hence, we aimed to appraise if and how macroH2A1 regulated the expression patterns of circadian genes in the setting of NAFLD-associated HCC. We took advantage of an in vitro model of liver cancer represented by HepG2 (human hepatocarcinoma) cells stably knocked down for macroH2A1 and conducted whole transcriptome profiling and deep phenotyping analysis. We found up-regulation of PER1 along with several deregulated circadian genes, enriching several important pathways and functions related to cancer onset and progression, such as epithelial-to-mesenchymal transition, cell cycle deregulation, and DNA damage. PER1 silencing partially mitigated the malignant phenotype induced by the loss of macroH2A1 in HCC cells. In conclusion, our findings suggest a modulatory role for the core circadian protein PER1 in liver carcinogenesis in the context of a lack of the macroH2A1 epigenetic and transcriptional landscape.

Keywords: HCC; PER1; biological clock; cancer; circadian.


Conflict of interest statement

The authors declare that there are no conflict of interest with respect to the authorship and/or publication of this article.

Figures

Figure 1
Figure 1
Histone variant macroH2A1 knockdown affects the expression level of circadian genes. (A) Heat-map rendering mRNA expression levels of 24 h oscillating genes upon histone variant macroH2A1 knock down in HepG2 cells. GFP1 and GFP3 indicate HepG2 control cells, KO1 and KO2 indicate macroH2A1 knocked-down HepG2 cells (biological replicates). (B) Volcano plot of differentially expressed circadian genes between HepG2 KD and HepG2 control cells. Indicated in orange are the genes with statistically significant different expression, i.e., p-value < 0.05 and abs (FC) > 2. (C) Enrichment analysis for functional categorization of the most significant pathways. Functional and pathway analyses were conducted using Ingenuity Pathway Analysis (IPA; QIAGEN, Redwood City, CA, USA; www.qiagen.com/ingenuity accessed on 4 June 2021).
Figure 2
Figure 2
Western blot analysis of the expression levels of circadian proteins and regulatory proteins and transcription factors involved in key cell processes in the considered cell conditions. (A) Western blot analysis of the expression levels of proteins involved in the molecular clockwork. (B) Western blot analysis of the expression levels of proteins involved in cell processes. (C) Western blot analysis of the expression levels of proteins involved in the autophagic process. See the Materials and Methods section for more details. RDM siRNA NEG = siRNA scramble-treated HepG2 cells; RDM siRNA PER1 = siRNA PER1-treated HepG2 cells; M1 siRNA NEG = siRNA scramble-treated macroH2A1 knocked down HepG2 cells; M1 siRNA PER1 = siRNA PER1-treated macroH2A1 knocked down HepG2 cells; bars, standard error of mean (SEM); three biological replicates were each assayed in triplicate and results were expressed as mean ± standard error of mean (SEM).
Figure 3
Figure 3
Evaluation of proliferative and migratory capacity: (A) cell proliferation curves; (B) wound area relative to closure (%) assessed at 48 h. Artificial wounds were made in confluent monolayers of control and macroH2A1 KO with or without PER1-silencing cells. Cell migration towards the wound, photographed from 0 h to 48 h. (C) Representative microphotographs of the residual wound area. Original magnification 10X. Cell migration was determined by the rate of scratched area closure over time using ImageJ™ software. See the Materials and Methods section for more details. RDM siRNA NEG = siRNA scramble-treated HepG2 cells; RDM siRNA PER1 = siRNA PER1-treated HepG2 cells; M1 siRNAneg = siRNA scramble-treated macroH2A1 knocked down HepG2 cells; M1 siRNA PER1 = siRNA PER1-treated macroH2A1 knocked down HepG2 cells; bars, standard error of mean (SEM); * p < 0.05; three biological replicates were each assayed in triplicate and results were expressed as mean ± standard error of mean (SEM).
Figure 4
Figure 4
Cell cycle phase distribution analysis in HepG2 cells upon macroH2A1 knockdown and PER1 silencing. (A) The percentage of cells at G0/G1-, S-, and G2/M-phases is plotted. (B) Flow cytometry graphs showing the distribution of cycling cells by FACS analysis. See the Materials and Methods section for more details. RDM siRNA NEG = siRNA scramble-treated HepG2 cells; RDM siRNA PER1 = siRNA PER1-treated HepG2 cells; M1 siRNAneg = siRNA scramble-treated macroH2A1 knocked down HepG2 cells; M1 siRNA PER1 = siRNA PER1-treated macroH2A1 knocked down HepG2 cells; bars, standard error of mean (SEM); * p < 0.05; three biological replicates were each assayed in triplicate and results were expressed as mean ± standard error of mean (SEM).
Figure 5
Figure 5
Evaluation of apoptosis changes upon macroH2A1 knockdown and PER1 silencing in basal conditions and upon cisplatin treatment. (A) Plot of the concentration–response sigmoidal curve using IC50 values to parameterize concentration–effect curves. (B) Apoptosis changes upon macroH2A1 knockdown and PER1 silencing in basal conditions; (C) Apoptosis changes upon macroH2A1 knockdown and PER1 silencing with cisplatin treatment. RDM siRNA NEG = siRNA scramble-treated HepG2 cells; RDM siRNA PER1 = siRNA PER1-treated HepG2 cells; M1 siRNAneg = siRNA scramble-treated macroH2A1 knocked down HepG2 cells; M1 siRNA PER1 = siRNA PER1-treated macroH2A1 knocked down HepG2 cells; bars, standard error of mean (SEM); * p < 0.05; three biological replicates were each assayed in triplicate and results were expressed as mean ± standard error of mean (SEM).
Figure 6
Figure 6
Flow cytometry detection of DNA damage. To evaluate DNA damage, we used the H2A.X phosphorylation assay, a cell-based assay using flow cytometry detection of levels of phosphorylated histone H2A.X on serine 139 (γ-H2AX), formed in response to DNA double-strand breaks (DSBs) generated by exogenous genotoxic agents. Cells for each condition were treated in vitro with 0, 0.5, and 1 μmol/L cisplatin for 72 h. See the Materials and Methods section for more details. RDM siRNA NEG = siRNA scramble-treated HepG2 cells; RDM siRNA PER1 = siRNA PER1-treated HepG2 cells; M1 siRNAneg = siRNA scramble-treated macroH2A1 knocked down HepG2 cells; M1 siRNA PER1 = siRNA PER1-treated macroH2A1 knocked down HepG2 cells; three biological replicates were each assayed in triplicate.
Figure 7
Figure 7
Effect of macroH2A1 and PER1 modulation on mitochondrial respiratory activity in HepG2 cells. Intact cells were assessed by high-resolution oximetry. (A) Oxygen consumption rates (OCR) outcomes. The upper and lower panel refer to OCRs measured in the absence and in the presence of etomoxir, respectively. The colored bars refer, with different tones, to basal OCR and following the addition of oligomycin and valinomycin (see legend). The values are corrected for mitochondria-unrelated respiration (expressed as nmoles O2/min/106 cells). (B) Mitochondrial respiration-linked bioenergetics parameters inferred from the results in (A). Upper bipartite panels: basal respiration on an enlarged scale; middle panel: ATP-linked respiration attained subtracting from the basal OCRs the OCROligom; lower panels: normalized respiratory leak attained as the OCROligom/OCRBasal ratio. See the Materials and Methods section for more details. RDM siRNA NEG = siRNA scramble-treated HepG2 cells; RDM siRNA PER1 = siRNA PER1-treated HepG2 cells; M1 siRNA NEG = siRNA scramble-treated macroH2A1 knocked down HepG2 cells; M1 siRNA PER1 = siRNA PER1-treated macroH2A1 knocked down HepG2 cells; bars, standard error of mean (SEM); * p < 0.05; three biological replicates were each assayed in triplicate and results were expressed as mean ± standard error of mean (SEM).

References

    1. Ferlay J., Colombet M., Soerjomataram I., Mathers C., Parkin D.M., Piñeros M., Znaor A., Bray F. Estimating the global cancer incidence and mortality in 2018: GLOBOCAN sources and methods. Int. J. Cancer. 2019;144:1941–1953. doi: 10.1002/ijc.31937. - DOI - PubMed
    1. Akinyemiju T., Abera S., Ahmed M., Alam N., Alemayohu M.A., Allen C., Al-Raddadi R., Alvis-Guzman N., Amoako Y., Artaman A., et al. The Burden of Primary Liver Cancer and Underlying Etiologies from 1990 to 2015 at the Global, Regional, and National Level: Results from the Global Burden of Disease Study 2015. JAMA Oncol. 2017;3:1683–1691. - PMC - PubMed
    1. Mazzoccoli G., Miele L., Oben J., Grieco A., Vinciguerra M. Biology, Epidemiology, Clinical Aspects of Hepatocellular Carcinoma and the Role of Sorafenib. Curr. Drug Targets. 2016;17:783–799. doi: 10.2174/1389450117666151209120831. - DOI - PubMed
    1. Mazzoccoli G., Tarquini R., Valoriani A., Oben J., Vinciguerra M., Marra F. Management strategies for hepatocellular carcinoma: Old certainties and new realities. Clin. Exp. Med. 2016;16:243–256. doi: 10.1007/s10238-015-0368-z. - DOI - PubMed
    1. Anstee Q.M., Reeves H.L., Kotsiliti E., Govaere O., Heikenwalder M. From NASH to HCC: Current concepts and future challenges. Nat. Rev. Gastroenterol. Hepatol. 2019;16:411–428. doi: 10.1038/s41575-019-0145-7. - DOI - PubMed

LinkOut - more resources