

T-Cell Acute Lymphoblastic Leukemia: Biomarkers and Their Clinical Usefulness
- PMID: 34440292
- PMCID: PMC8394887
- DOI: 10.3390/genes12081118
T-Cell Acute Lymphoblastic Leukemia: Biomarkers and Their Clinical Usefulness
Abstract
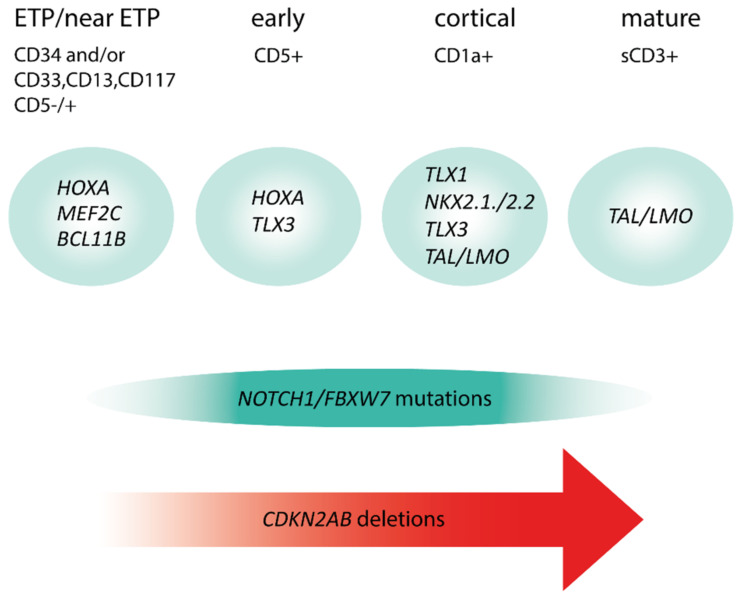
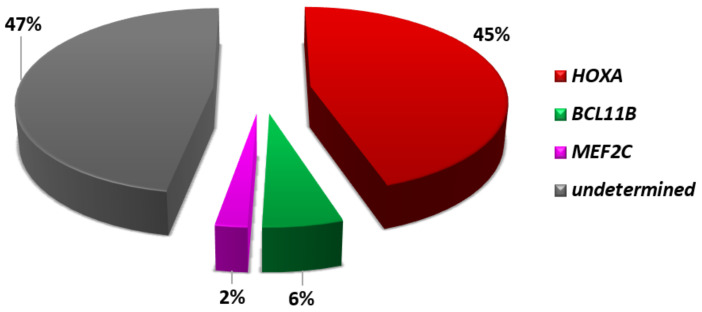
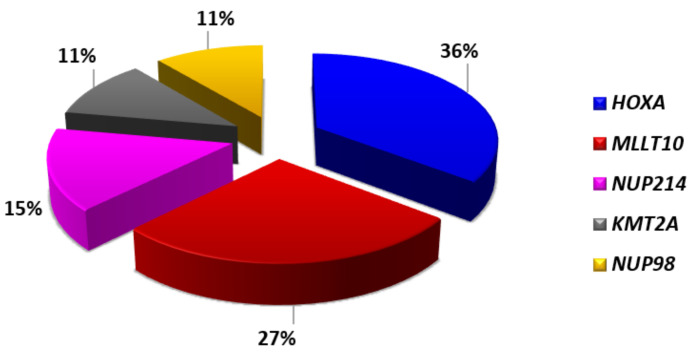
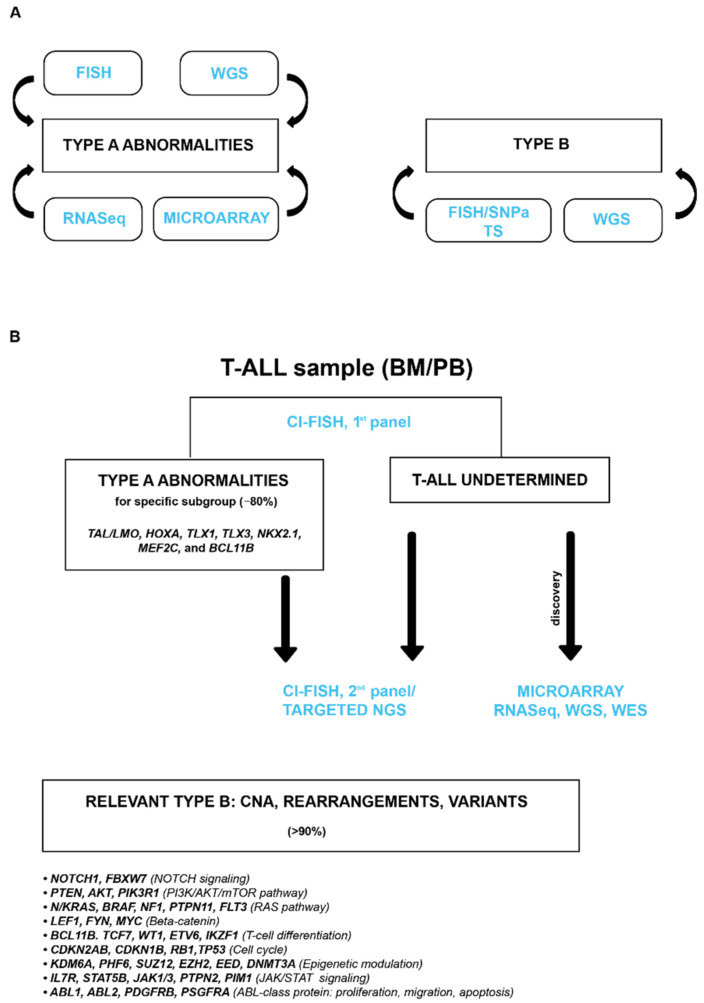
T-cell acute lymphoblastic leukemias (T-ALL) are immature lymphoid tumors localizing in the bone marrow, mediastinum, central nervous system, and lymphoid organs. They account for 10-15% of pediatric and about 25% of adult acute lymphoblastic leukemia (ALL) cases. It is a widely heterogeneous disease that is caused by the co-occurrence of multiple genetic abnormalities, which are acquired over time, and once accumulated, lead to full-blown leukemia. Recurrently affected genes deregulate pivotal cell processes, such as cycling (CDKN1B, RB1, TP53), signaling transduction (RAS pathway, IL7R/JAK/STAT, PI3K/AKT), epigenetics (PRC2 members, PHF6), and protein translation (RPL10, CNOT3). A remarkable role is played by NOTCH1 and CDKN2A, as they are altered in more than half of the cases. The activation of the NOTCH1 signaling affects thymocyte specification and development, while CDKN2A haploinsufficiency/inactivation, promotes cell cycle progression. Among recurrently involved oncogenes, a major role is exerted by T-cell-specific transcription factors, whose deregulated expression interferes with normal thymocyte development and causes a stage-specific differentiation arrest. Hence, TAL and/or LMO deregulation is typical of T-ALL with a mature phenotype (sCD3 positive) that of TLX1, NKX2-1, or TLX3, of cortical T-ALL (CD1a positive); HOXA and MEF2C are instead over-expressed in subsets of Early T-cell Precursor (ETP; immature phenotype) and early T-ALL. Among immature T-ALL, genomic alterations, that cause BCL11B transcriptional deregulation, identify a specific genetic subgroup. Although comprehensive cytogenetic and molecular studies have shed light on the genetic background of T-ALL, biomarkers are not currently adopted in the diagnostic workup of T-ALL, and only a limited number of studies have assessed their clinical implications. In this review, we will focus on recurrent T-ALL abnormalities that define specific leukemogenic pathways and on oncogenes/oncosuppressors that can serve as diagnostic biomarkers. Moreover, we will discuss how the complex genomic profile of T-ALL can be used to address and test innovative/targeted therapeutic options.
Keywords: T-ALL; genomic profile; molecular-cytogenetic markers.
Conflict of interest statement
The authors declare no conflict of interest.
Figures
References
-
- Beldjord K., Chevret S., Asnafi V., Huguet F., Boulland M.L., Leguay T., Thomas X., Cayuela J.M., Grardel N., Chalandon Y., et al. Oncogenetics and Minimal Residual Disease Are Independent Outcome Predictors in Adult Patients with Acute Lymphoblastic Leukemia. Blood. 2014;123:3739–3749. doi: 10.1182/blood-2014-01-547695. - DOI - PubMed
-
- Petit A., Trinquand A., Chevret S., Ballerini P., Cayuela J.M., Grardel N., Touzart A., Brethon B., Lapillonne H., Schmitt C., et al. Oncogenetic Mutations Combined with MRD Improve Outcome Prediction in Pediatric T-Cell Acute Lymphoblastic Leukemia. Blood. 2018;131:289–300. doi: 10.1182/blood-2017-04-778829. - DOI - PubMed
-
- Ferrando A.A., Neuberg D.S., Staunton J., Loh M.L., Huard C., Raimondi S.C., Behm F.G., Pui C.H., Downing J.R., Gilliland D.G., et al. Gene Expression Signatures Define Novel Oncogenic Pathways in T Cell Acute Lymphoblastic Leukemia. Cancer Cell. 2002;1:75–87. doi: 10.1016/S1535-6108(02)00018-1. - DOI - PubMed
Publication types
MeSH terms
Substances
LinkOut - more resources
Full Text Sources
Research Materials
Miscellaneous
