. 2021 Jul 30;12(8):1191.
doi: 10.3390/genes12081191.

Severity of Idiopathic Scoliosis Is Associated with Differential Methylation: An Epigenome-Wide Association Study of Monozygotic Twins with Idiopathic Scoliosis

Affiliations

Severity of Idiopathic Scoliosis Is Associated with Differential Methylation: An Epigenome-Wide Association Study of Monozygotic Twins with Idiopathic Scoliosis

Patrick M Carry et al. Genes (Basel). .

Abstract

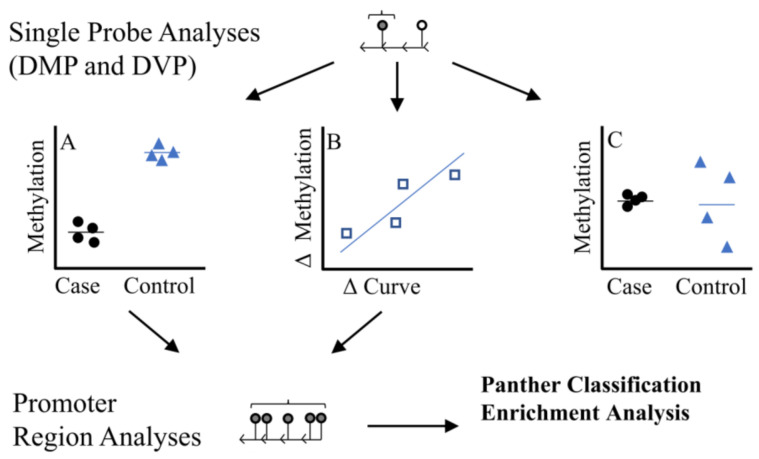
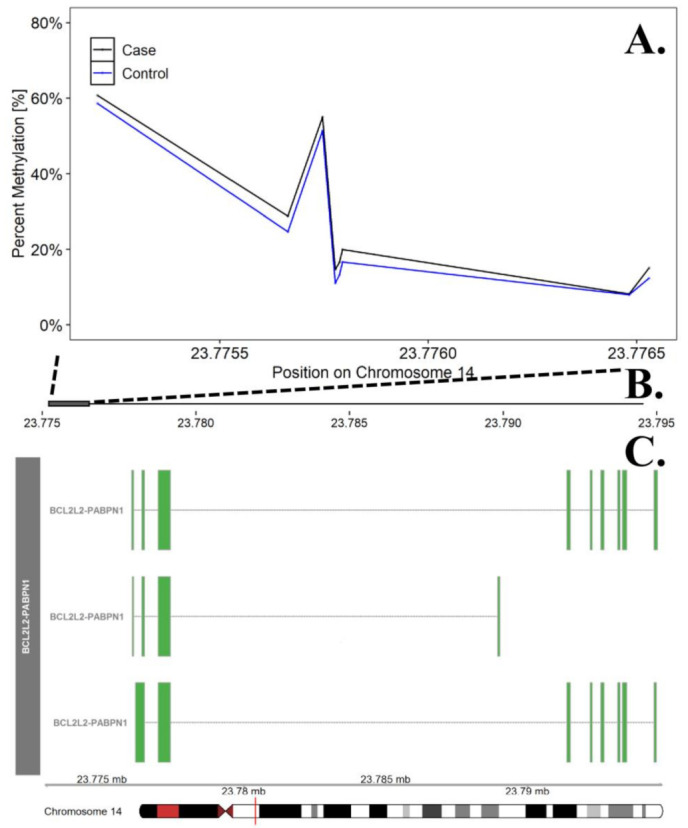
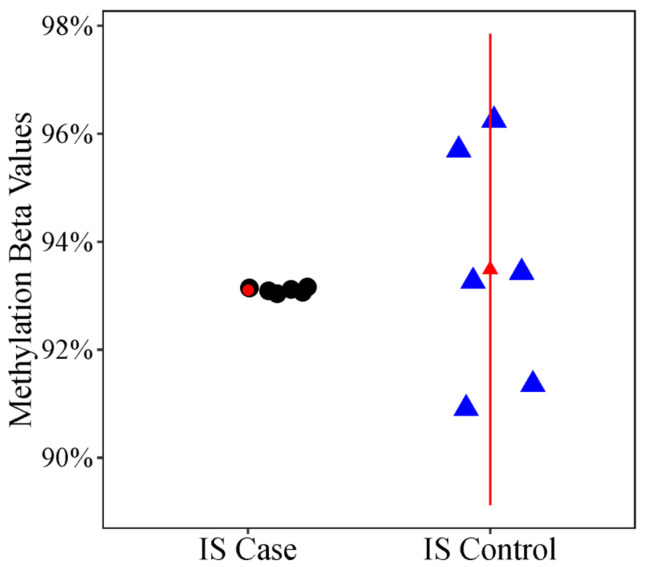
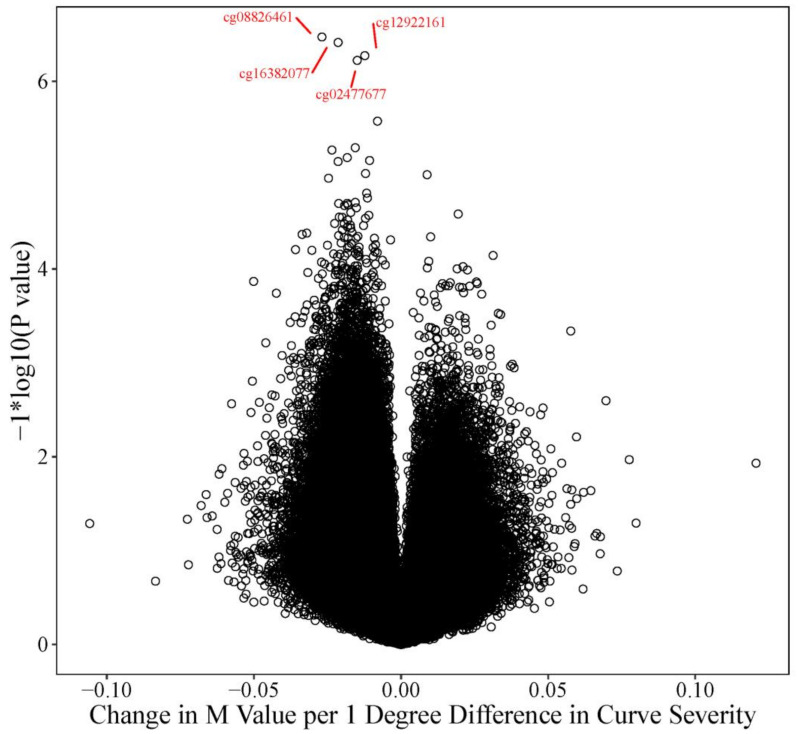
Epigenetic mechanisms may contribute to idiopathic scoliosis (IS). We identified 8 monozygotic twin pairs with IS, 6 discordant (Cobb angle difference > 10°) and 2 concordant (Cobb angle difference ≤ 2°). Genome-wide methylation in blood was measured with the Infinium HumanMethylation EPIC Beadchip. We tested for differences in methylation and methylation variability between discordant twins and tested the association between methylation and curve severity in all twins. Differentially methylated region (DMR) analyses identified gene promoter regions. Methylation at cg12959265 (chr. 7 DPY19L1) was less variable in cases (false discovery rate (FDR) = 0.0791). We identified four probes (false discovery rate, FDR < 0.10); cg02477677 (chr. 17, RARA gene), cg12922161 (chr. 2 LOC150622 gene), cg08826461 (chr. 2), and cg16382077 (chr. 7) associated with curve severity. We identified 57 DMRs where hyper- or hypo-methylation was consistent across the region and 28 DMRs with a consistent association with curve severity. Among DMRs, 21 were correlated with bone methylation. Prioritization of regions based on methylation concordance in bone identified promoter regions for WNT10A (WNT signaling), NPY (regulator of bone and energy homeostasis), and others predicted to be relevant for bone formation/remodeling. These regions may aid in understanding the complex interplay between genetics, environment, and IS.

Keywords: DNA methylation; bone; curve severity; differentially methylated region; discordant; epigenome-wide association study; idiopathic scoliosis; monozygotic twin.


Conflict of interest statement

The authors declare no conflict of interest.

Figures

Figure 1
Figure 1
Study Methodologic Workflow. Differentially methylated position (DMP) analyses were used to identify single probes. We used two DMP strategies (1) Discordant DMP Analysis (A), differences in methylation between cases (twin with more severe IS) relative to controls (twin with less sever IS) (2) Severity DMP Analysis (B) looked at association between difference in curve severity and methylation curvevs methylation, where methylation= methylation levels in affected/more severe twin–methylation levels unaffected/less severe twin and curve= primary curve magnitude in affected/more severe twin–primary curve magnitude is unaffected/less severe twin. We also looked at differences in variability at single probes (differentially variable position analysis, DVP) among cases compared to controls (C). Region analyses based on single probes from (A,B) were used to identify regions of consistent methylation effects within promoter regions. We only considered regions with 5 or more probes where direction of effect was consistent across all probes. DVP probes (C) were not considered in the region analysis due to challenges interpreting a ‘consistent’ direction of effect based on variability.
Figure 2
Figure 2
Differentially Methylated Region in the BCL2L2-PABN1 Promoter Region on Chromosome 14. The top panel (A) describes differences in percent methylation between cases and controls at each probe included in the promoter region for BCL2L2-PABN1. This region was the most significant DMR in the discordant twin analysis. The X axis represents the position (mb) of the probes. The middle panel (B) represents the location of promoter region (solid square) relative to the entire gene, represented in the bottom panel. Multiple known isoforms of BCL2L2-PABN1 are represented in the bottom panel (C), boxes represent exons and lines represent introns. The red line on the ideogram, bottom of the figure, represents location of the region within the chromosome.
Figure 3
Figure 3
Scatter Plot of Differential Variability Between Case and Control Twins. Methylation levels (% methylation or β values) at the cg12959265 probe, an open sea probe near the DPY19L1 gene on chromosome 7 in IS cases and IS controls. The triangle represents the mean % methylation and error bars represent +/− 1 standard deviation. The plot illustrates the large difference in variability at cg12959265 in IS cases vs. IS controls.
Figure 4
Figure 4
Volcano Plot: Curve Severity Analysis The volcano plot describes the effect size and p value for every probe tested in the curve severity analysis. The Y axis represents the −log10(p values) and the X axis represents the change in M value for every one-degree difference in curve severity between the twin pairs for each of the respective probes tested. Increasing curve disparity was more often associated with hypomethylation (decreased M values, left or negative side of the plot) than hypermethylation. The four FDR significant probes (FDR adj p = 0.0753) are highlighted in red, cg08826461 (nominal p value = 3.37 × 10⁻⁷), cg16382077 (nominal p value = 3.85 × 10⁻⁷), cg12922161 (nominal p value = 5.32 × 10⁻⁷), and cg02477677 (nominal p value = 5.97 × 10⁻⁷).
Figure 5
Figure 5
Differentially Methylation Region in the NNAT Promoter Region on Chromosome 20. The top panel (A) presents the slope estimates from the curve severity analysis that represent the change in methylation between cases and controls per one-degree change in curve severity at each of the 34 probes included in the promoter region for the NNAT gene. This region was the most significant DMR in the curve severity analysis. The X axis represents the position (mb) of the probes. The middle panel (B) represents the location of promoter region (solid square) relative to the entire gene, represented in the bottom panel. Multiple known isoforms of the NNAT gene are represented in the bottom panel (C), boxes represent exons and lines represent introns. The red line on the ideogram, bottom of the figure, represents location of the region within the chromosome.

References

    1. Altaf F., Drinkwater J., Phan K., Cree A.K. Systematic Review of School Scoliosis Screening. Spine Deform. 2017;5:303–309. doi: 10.1016/j.jspd.2017.03.009. - DOI - PubMed
    1. Weinstein S.L., Dolan L.A., Cheng J.C., Danielsson A., Morcuende J.A. Adolescent idiopathic scoliosis. Lancet. 2008;371:1527–1537. doi: 10.1016/S0140-6736(08)60658-3. - DOI - PubMed
    1. Miller N.H. Genetics of familial idiopathic scoliosis. Clin. Orthop. Relat. Res. 2007;462:6–10. doi: 10.1097/BLO.0b013e318126c062. - DOI - PubMed
    1. Khanshour A.M., Wise C.A. Pathogenesis of Idiopathic Scoliosis. Springer; Berlin, Germany: 2018. The Genetic Architecture of Adolescent Idiopathic Scoliosis; pp. 51–74.
    1. Tang N.L., Yeung H.Y., Hung V.W., Di Liao C., Lam T.P., Yeung H.M., Lee K.M., Ng B.K., Cheng J.C. Genetic epidemiology and heritability of AIS: A study of 415 Chinese female patients. J. Orthop Res. 2012;30:1464–1469. doi: 10.1002/jor.22090. - DOI - PubMed

Publication types