. 2021 Aug 8;10(8):2029.
doi: 10.3390/cells10082029.

Physcion Induces Potential Anticancer Effects in Cervical Cancer Cells

Affiliations

Physcion Induces Potential Anticancer Effects in Cervical Cancer Cells

Wojciech Trybus et al. Cells. .

Abstract

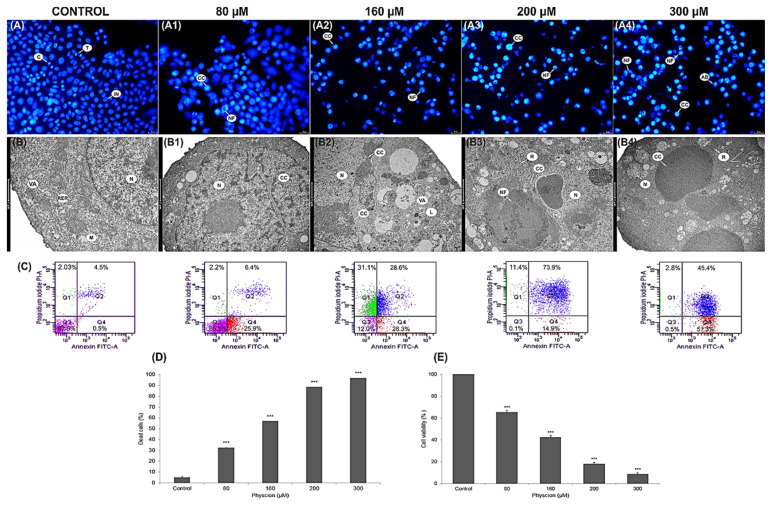
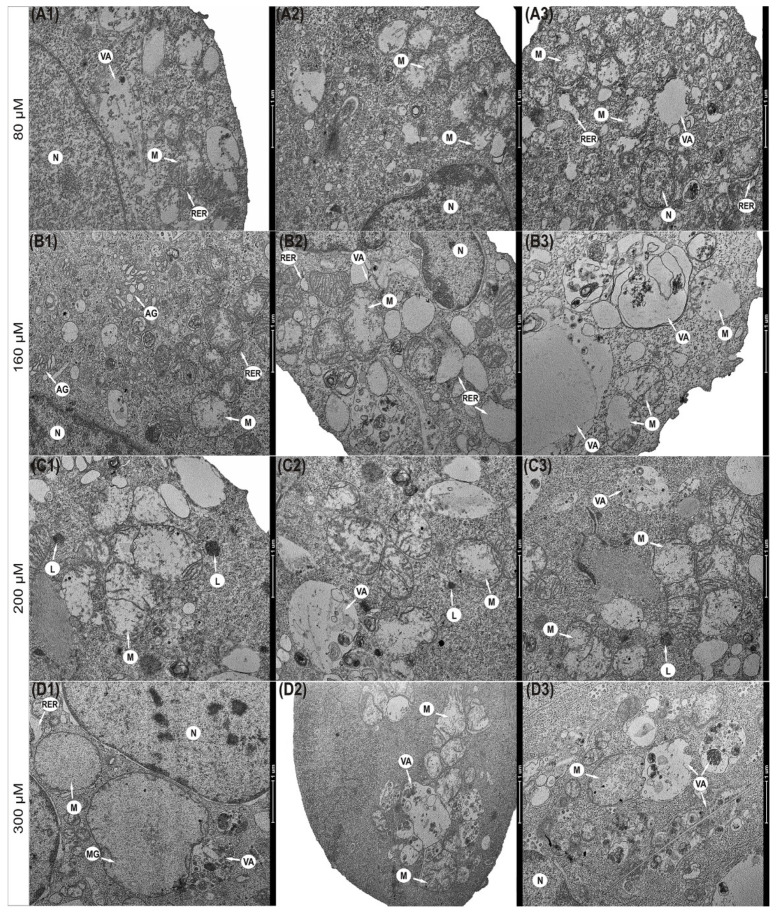
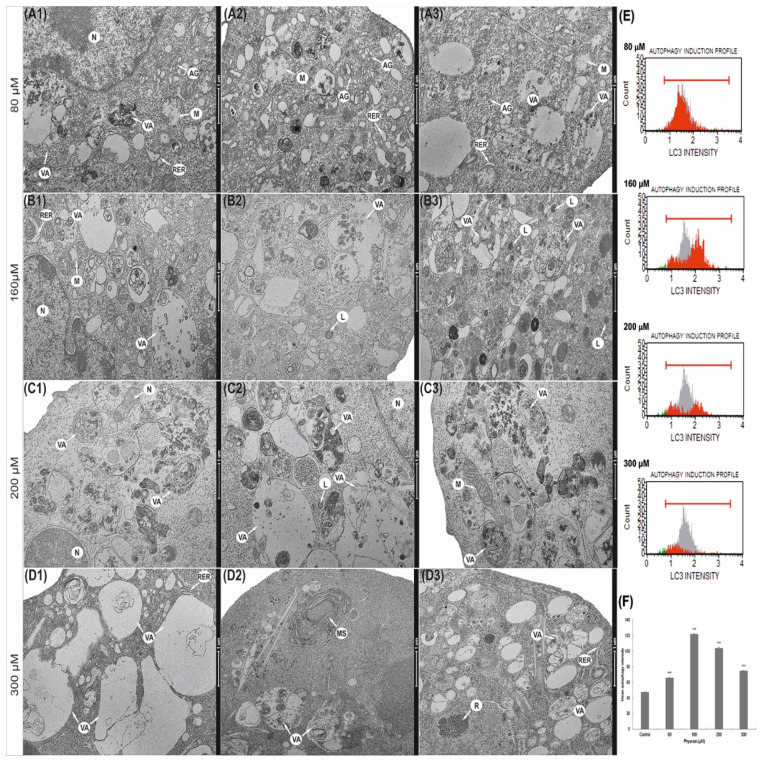
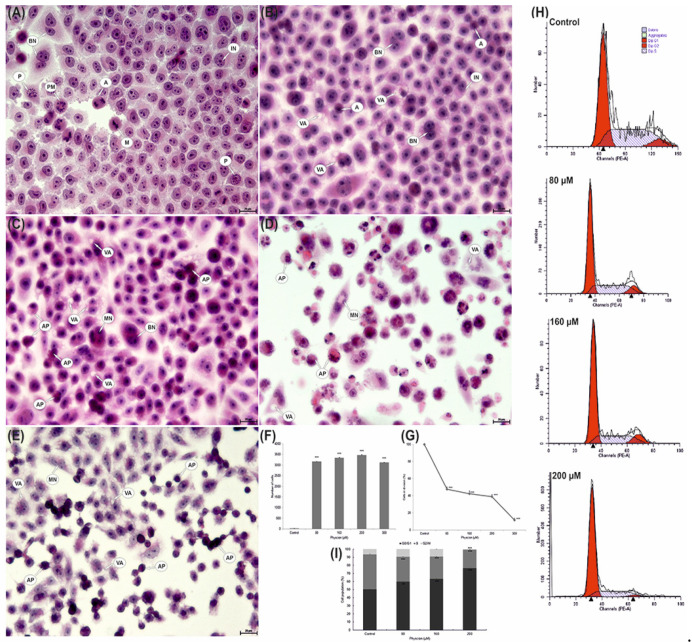
Background: The extent of morphological and ultrastructural changes in HeLa cells was assessed by optical, fluorescence and electron microscopy after exposure to various concentrations of physcion, taking into account the biological properties of the test compound.

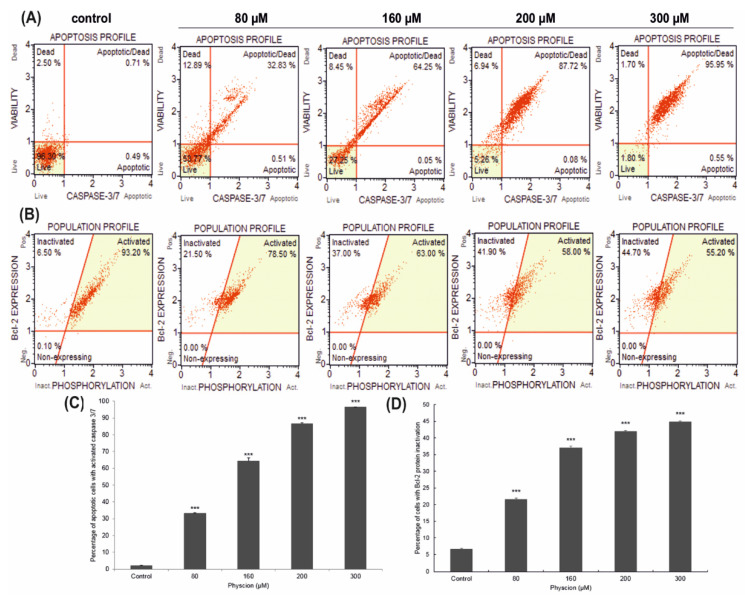
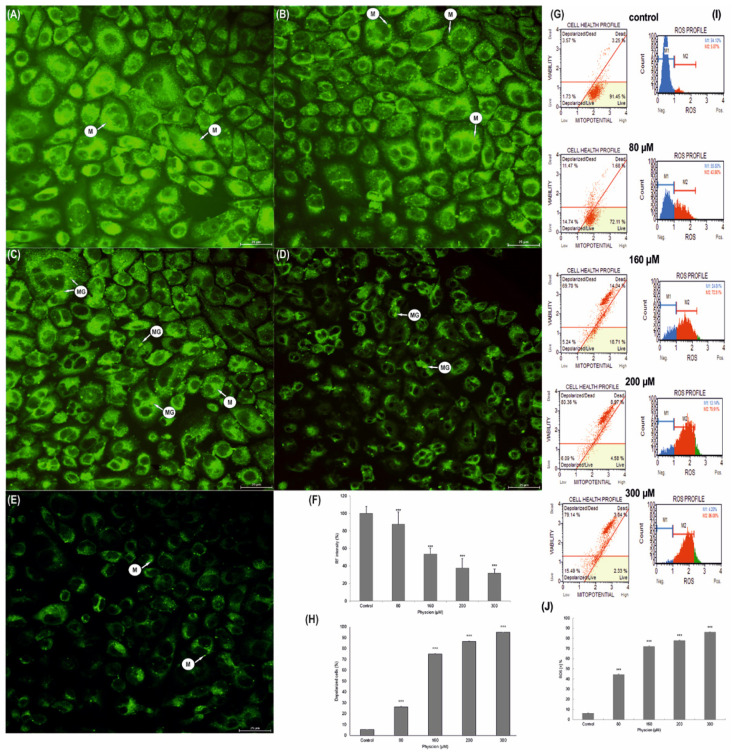
Methods: Cell viability was assessed by MTT assay, while the cell cycle, LC3 expression, apoptosis, change of mitochondrial potential, Bcl-2 protein expression level and the level of reactive oxygen species were analyzed by flow cytometry.

Results: As a result of physcion encumbrance, concentration-dependent inhibition of HeLa cell viability and the G0/G1 phase of the cell cycle was observed. Activation of the lysosomal system was also revealed, which was expressed by an increased number of lysosomes, autophage vacuoles and increased expression of the LC3 protein, a marker of the autophagy process. Transmission electron microscopy and fluorescence microscopy showed that physcion induced clear changes in cervical cancer cells, especially in the structure of the nucleus and mitochondria, which correlated with the production of reactive oxygen species by the test compound and indicated the induction of the oxidative process. At the same time, the pro-apoptotic effect of physcion was demonstrated, and this mechanism was dependent on the activation of caspases 3/7 and the reduction in Bcl-2 protein expression.

Conclusion: The obtained results indicate an antitumor mechanism of action of physcion, based on the induction of oxidative stress, autophagy and apoptosis.

Keywords: apoptosis; autophagy; mitochondria; oxidative stress; physcion.


Conflict of interest statement

The authors declare no conflict of interest.

Figures

Figure 1
Figure 1
Physcion-induced apoptotic death of HeLa cells. Apoptosis observed in HeLa cells after physcion treatment. Labeling of cell nuclei with 4’,6-diamidin-2-phenylindole. (A) Control cells (unloaded) with normal nuclear morphology. Cells after 48 h of exposure to physcion at a concentration of 80 μM (A1), 160 μM (A2), 200 μM (A3) and 300 μM (A4) with visible chromatin condensation (CC), nuclear fragmentation (NF) and formation of apoptotic bodies (AB). T—Telophase, C—cytokinesis. Magnification, ×2000. Ultrastructural changes in cells treated with physcion at the concentrations of 80 μM, 160 μM, 200 μM and 300 µM. (B) Control cell with normal structure of the cell nucleus (N), with mitochondria with normal distribution of cristae (M), rough endoplasmic reticulum (RER) and small autophagic vacuoles (VA). Cells: with an altered nucleus shape (B1—80 µM), with visible condensation and marginalization of chromatin (B2—160 µM) and at a late stage of apoptosis (B3—200 µM, B4—300 µM) with condensed cytoplasm, condensed and fragmented chromatin (CC) and with a fragmented nucleus (NF). M—swollen mitochondria, R—free ribosomes, L—lysosomes. Magnification ×11,500. (C) Apoptosis assessed by annexin V-FITC/PI staining. The cells were treated for 48 h with physcion at the concentrations of 80 µM, 160 µM, 200 µM and 300 µM. Control cells (not in apoptosis) without Annexin V-FITC and PI staining. Populations of cells after physcion treatment: live cells (annexin V-FITC-/PI-), cells in the early phase (annexin V-FITC+/PI-) and late phase apoptosis (annexin V-FITC+/PI+), dead cells (Annexin V-FITC/PI+). (D) Percentage of early and late apoptotic cells induced by physcion in the concentration range of 80 µM–300 µM. (E) Cell viability measured by MTT after exposure to physcion in concentrations of 1-300 µM. Representative data from three parallel experiments. Data correspond to mean values ± standard error (S.E.). The differences were statistically confirmed at the level: *** p < 0.001.
Figure 2
Figure 2
Effect of physcion on caspase 3/7 activity and Bcl-2 levels. Cells were treated for 48 h with physcion at concentrations of 80 µM, 160 µM, 200 µM and 300 µM (A). Live cells (caspase 3/7-/7-AAD-), early apoptotic cells (caspase 3/7+/7-AAD-), late apoptotic (caspase 3/7+/7-AAD+), dead cells (caspase 3/7-/7-AAD+) (B). Bcl-2 expression profile in physcion-treated HeLa cells. Cells expressing Bcl-2 are clustered in the top two quadrants of the scatterplot (inactive and activated). As a result of the action of physcion in increasing concentrations, an increased number of cells with inactivation of the Bcl-2 protein was observed. At a concentration of 300 µM, more than 44% were dephosphorylated, which confirms the inactivation of the Bcl-2 signaling pathway. Concentration-dependent percentage of cells with Bcl-2 protein inactivation (C) and apoptotic cells with activated caspase 3/7 (D). Data representative of three parallel experiments correspond to mean values ± standard error. The differences were statistically confirmed at: *** p < 0.001.
Figure 3
Figure 3
Ultrastructural changes in mitochondria of HeLa cells encumbered for 48 h with physcion. (A1A3) Cell with swollen mitochondria and dilated channels of rough endoplasmic reticulum (80 µM). (B1B3) Swollen mitochondria with clear matrix, short cristae (160 µM), mitochondria with membrane rupture and infused into the cytoplasm with 200 µM (C1C3) and 300 µM (D1D3). Megamitochondria present in the cytoplasm (D1) (300 µM) with complete loss of mitochondrial cristae. N—Nucleus, M—mitochondria, MG—megamitochondria, AG—Golgi apparatus, RER—rough endoplasmic reticulum, VA—autophagic vacuoles, L—lysosomes. Magnification ×11,500.
Figure 4
Figure 4
Morphological and biochemical changes in mitochondria of Hela cells after physcion treatment. Mitochondrial membrane potential change analysis based on rhodamine 123 staining. Representative photos of control cells with high mitochondrial membrane potential (A) and cells incubated for 48 h with physcion at concentrations of 80 µM (B), 160 µM (C), 200 µM (D) and 300 µM (E). Relative fluorescence intensity expressed as a percentage of the control group (F). Data correspond to mean values ± S.E. M—mitochondria, MG—megamitochondria. Magnification, ×4000. Changes in mitochondrial membrane potential dependent on physcion concentration (G). Percentage of cells with depolarization of the mitochondrial membrane (H). Each sample was analyzed in triplicate. The differences were statistically confirmed at: *** p < 0.001. Generation of reactive oxygen species (ROS) by physcion at concentrations of 80 µM, 160 µM, 200 µM and 300 µM (I). Percentage of ROS (+) cells induced with physcion (J). The degree of ROS production in cells was determined in comparison with the control. Each sample was analyzed in triplicate. The differences were statistically confirmed at: *** p < 0.001.
Figure 5
Figure 5
Ultrastructural and biochemical changes in the lysosomal compartment of HeLa cells encumbered with 48 h of physcion action. (A1A3) Cells with numerous autophagic vacuoles and swollen cisterns of Golgi apparatus (80 µM). Cells with intense degradation processes, with numerous autophagic vacuoles and lysosomes (160 µM) (B1B3). Vacuoles at various stages of digestion occupying the entire area of the cell 200 μM (C1C3) and 300 μM (D1D3). N—nucleus, M—mitochondria, MG—megamitochondria, AG—Golgi apparatus, RER—rough endoplasmic reticulum, VA—autophagic vacuoles, L—lysosomes. Magnification, ×11,500. Physcion increased the expression of the LC3 protein. (E) Histograms of HeLa cells treated for 48 h with physcion at concentrations of 80–300 µM. Cells were stained with conjugated anti-LC3/Alexa Fluor®555 antibody, and the fluorescence intensity was measured cytometrically. (F) Change of fluorescence intensity in HeLa cells with LC3 protein expression depending on physcion concentration. The results are the mean of three independent experiments. The differences were statistically confirmed at the level: *** p < 0.001.
Figure 6
Figure 6
Morphological changes in HeLa cells after 48 h of exposure to physcion. (A) Control cells with normal morphology and numerous cells in division. (B) Cells with vacuoles present in the cytoplasm (80 µM). Numerous cells with strong cytoplasmic vacuolization covering the entire cell area and numerous apoptotic cells (C—160 µM, D—200 µM and E—300 µM). IN—interphase, P—prophase, PM—prometaphase, M—metaphase, A—anaphase, AP—apoptotic cells, VA—cells with cytoplasmic vacuolization, BN—binuclear cells, MN—multinucleated cells. Hematoxylin and eosin staining. Magnification, ×4000. (F) Number of cells with cytoplasm vacuolization. (G) Mitotic index of HeLa cells. Data correspond to mean values ± S.E. from three different experiments. The differences were confirmed statistically at: *** p < 0.001. (H) Effect of physcion at concentrations (80 µM, 160 µM and 200 µM) on cell cycle progression in HeLa cell lines. (I) Percentage of cells in different phases of the cell cycle. Cell cycle distribution was analyzed by flow cytometry. Data correspond to mean values ± S.E. from three different experiments. The differences were confirmed statistically at: *** p < 0.001.

References

    1. Fulda S. Autophagy in cancer therapy. Front. Oncol. 2017;7:128. doi: 10.3389/fonc.2017.00128. - DOI - PMC - PubMed
    1. Król T., Schmidt M., Kołątaj A., Witek B. Vinblastine-induced autophagy in mouse liver. Comp. Biochem. Physiol. C Toxicol. Pharm. 1994;107:165–169. doi: 10.1016/1367-8280(94)90023-X. - DOI
    1. Król T. Vincristine-induced autophagy in mouse liver. Acta Biol. Cracoviensia. Ser. Zool. 1996;38:5–12.
    1. Krol T. Activity of lysosomal system in mouse liver after taxol administration. Gen. Pharm. 1998;30:239–243. doi: 10.1016/S0306-3623(97)00091-8. - DOI - PubMed
    1. Mathew R., Karantza-Wadsworth V., White E. Role of autophagy in cancer. Nat. Rev. Cancer. 2007;7:961–967. doi: 10.1038/nrc2254. - DOI - PMC - PubMed

Publication types

MeSH terms