. 2021 Aug 18;10(8):2126.
doi: 10.3390/cells10082126.

Ovarian Decellularized Bioscaffolds Provide an Optimal Microenvironment for Cell Growth and Differentiation In Vitro

Affiliations

Ovarian Decellularized Bioscaffolds Provide an Optimal Microenvironment for Cell Growth and Differentiation In Vitro

Georgia Pennarossa et al. Cells. .

Abstract

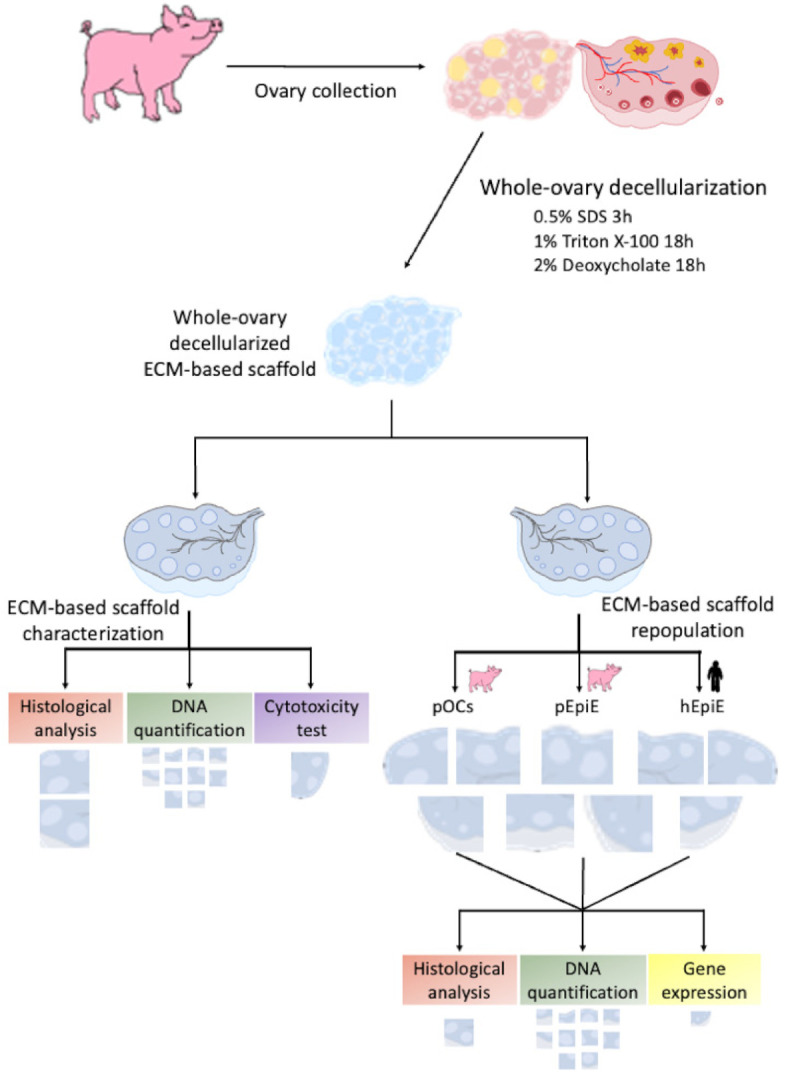
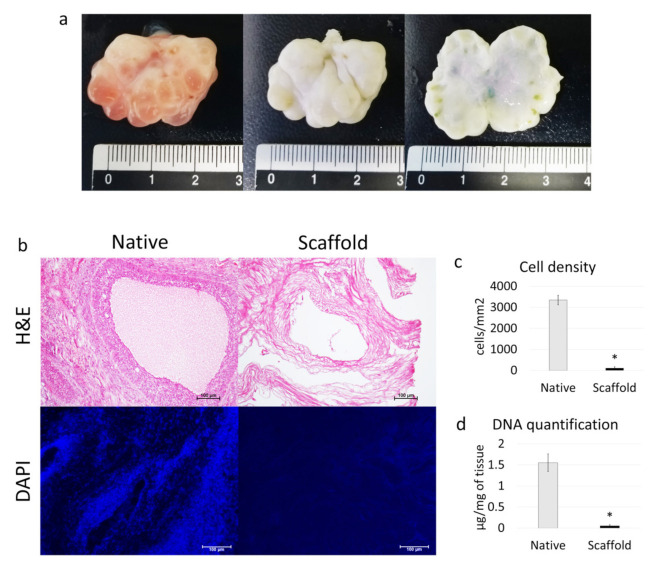
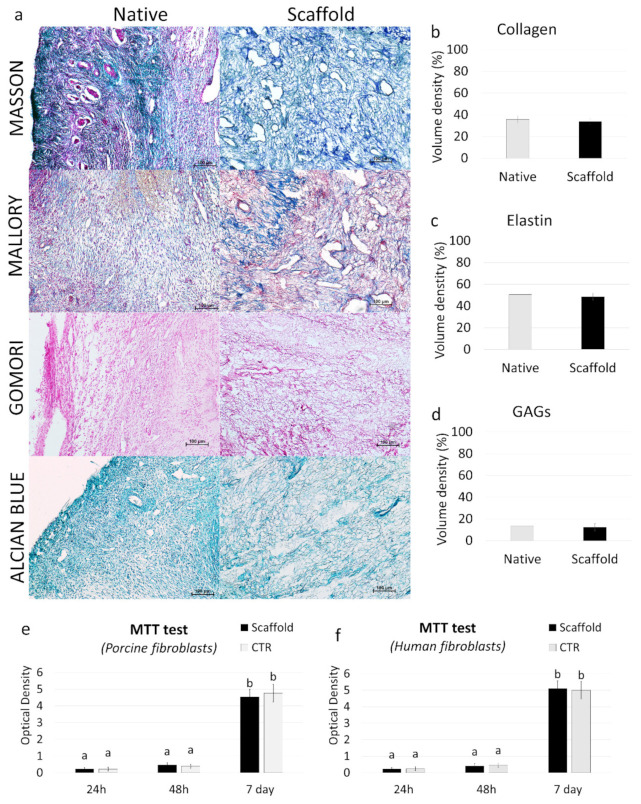
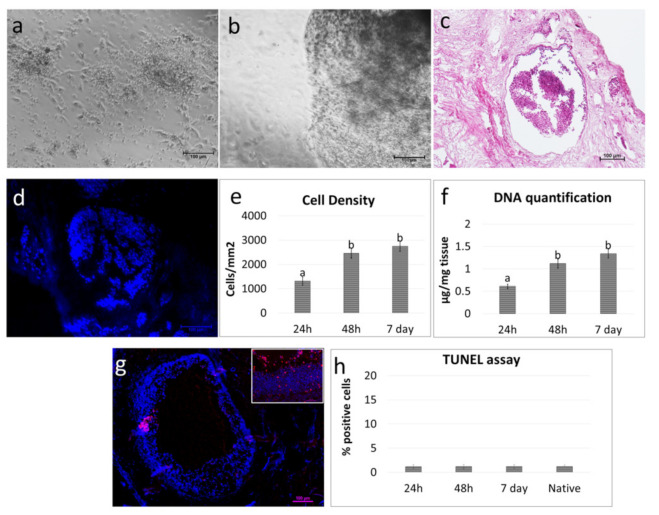
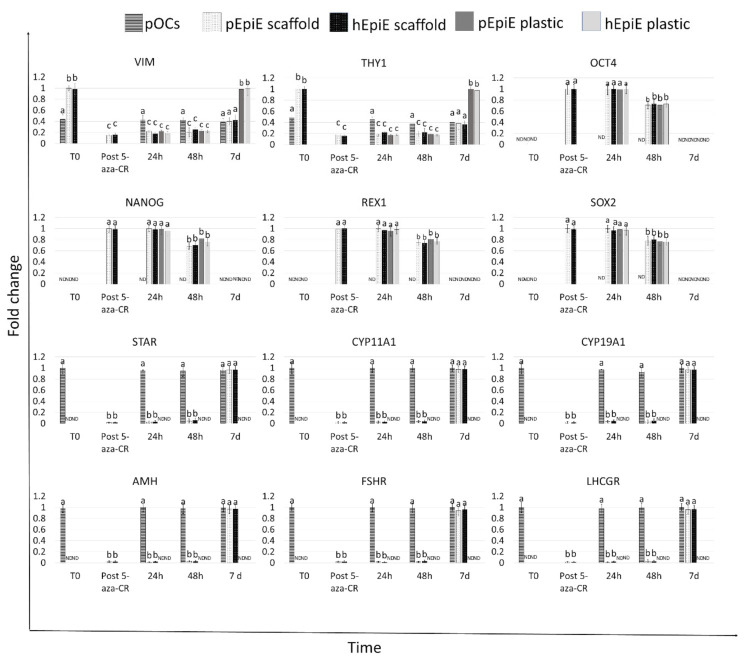
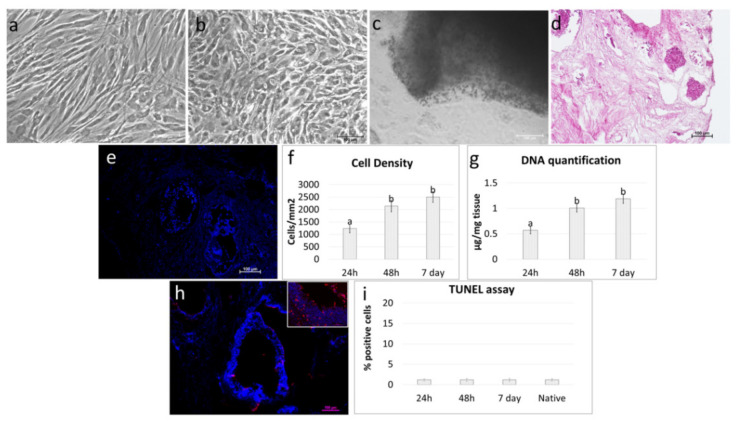
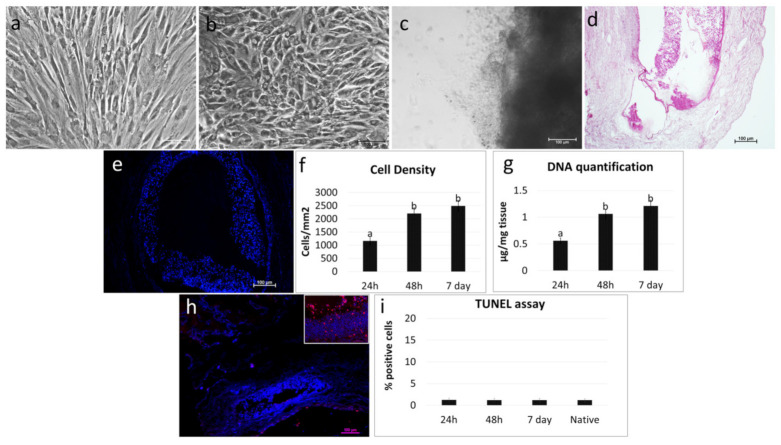
Ovarian failure is the most common cause of infertility. Although numerous strategies have been proposed, a definitive solution for recovering ovarian functions and restoring fertility is currently unavailable. One innovative alternative may be represented by the development of an "artificial ovary" that could be transplanted in patients for re-establishing reproductive activities. Here, we describe a novel approach for successful repopulation of decellularized ovarian bioscaffolds in vitro. Porcine whole ovaries were subjected to a decellularization protocol that removed the cell compartment, while maintaining the macrostructure and microstructure of the original tissue. The obtained bioscaffolds were then repopulated with porcine ovarian cells or with epigenetically erased porcine and human dermal fibroblasts. The results obtained demonstrated that the decellularized extracellular matrix (ECM)-based scaffold may constitute a suitable niche for ex vivo culture of ovarian cells. Furthermore, it was able to properly drive epigenetically erased cell differentiation, fate, and viability. Overall, the method described represents a powerful tool for the in vitro creation of a bioengineered ovary that may constitute a promising solution for hormone and fertility restoration. In addition, it allows for the creation of a suitable 3D platform with useful applications both in toxicological and transplantation studies.

Keywords: ECM-based scaffold repopulation; bioprosthetic ovary; epigenetically erased cells; fibroblasts; human; ovarian reconstruction; porcine; whole-ovary decellularization.


Conflict of interest statement

The authors declare no conflict of interest.

Figures

Figure 1
Figure 1
Scheme showing overall experimental design.
Figure 2
Figure 2
Macroscopic and microscopic evaluations of ECM-based scaffolds and DNA quantification. (a) Native (left panel) and decellularized (middle and right panels) ovaries display comparable shapes and homogeneity, while the color turns from red (left panel) to white (middle and right panels); (b) H & E staining shows the presence of both basophilic (cell nuclei) and eosinophilic (cell cytoplasm and ECM) staining in the control tissue (native), while cell nuclei and the related basophilic staining are absent in the decellularized ECM-based scaffolds (scaffold). DAPI staining displays the presence of nuclei in native ovaries (native), which disappeared after the decellularization process (scaffold). Scale bars = 100 μm; (c) Cell density demonstrated a significantly lower number of nuclei in the decellularized ECM-based scaffolds (scaffold) compared to the untreated tissues (native); data are expressed as the mean ± the standard error of the mean (SEM), * p < 0.05; (d) DNA quantification analysis showed a significant decrease in the DNA content of the decellularized ECM-based scaffolds (scaffold) compared to the native tissue (native). Data are expressed as the mean ± the standard error of the mean (SEM), * p < 0.05.
Figure 3
Figure 3
ECM microarchitecture and composition in ECM-based scaffolds and cytotoxicity assessment. (a) Masson’s Trichrome staining showed the persistence of collagen fibers (blue) and their comparable distribution between the native ovaries (native) and the decellularized tissues (scaffold). Mallory’s Trichrome staining demonstrated the maintenance of intact collagen (blue) and elastic fibers (red magenta) after the decellularization process (scaffold). Gomori’s aldehyde-fuchsin staining confirmed that ECM-based scaffolds (scaffold) retained the elastic fibers scattered throughout the decellularized ovary, similar to what was visible in untreated ovaries (native). Alcian blue staining revealed GAG retention in the decellularized scaffolds (scaffold). Scale bars = 100 μm. (b–d) Stereological quantifications demonstrated no significant differences between untreated ovaries (native) and the decellularized ECM-based scaffolds (scaffold) in collagen (b), elastin (c), and GAG (d) contents. Data are expressed as the mean ± the standard error of the mean (SEM) (p > 0.05). (e–f) MTT assays demonstrated no significant differences in the OD values of porcine (e) and human (f) adult dermal fibroblasts cocultured with ECM-based scaffold fragments and those identified in control cultures (CTR) at all the different time points analyzed. Data are expressed as the mean ± the standard error of the mean (SEM) (p > 0.05). a and b indicate statistically significant differences (p < 0.05).
Figure 4
Figure 4
Repopulation of decellularized ovarian ECM-based scaffolds with pOCs. (a) Image illustrating freshly isolated pOCs. Scale bar = 100 μm. (b) pOCs adhered and migrated into the decellularized ECM-based ovarian scaffolds. Representative image after 7 days of culture. Scale bar = 100 μm. (c) H & E staining demonstrated the presence of pOCs in the ECM-based scaffolds. Scale bar = 100 μm. (d) DAPI staining confirmed the positivity for nuclei. Scale bar = 100 μm. (e) Cell density analysis showed ECM-based scaffolds’ repopulation after 24 h, with a higher number of cells after 48 h and 7 days of coculture. Data are expressed as the mean ± the standard error of the mean (SEM). a and b indicate statistically significant differences (p < 0.05). (f) DNA quantification demonstrated the presence of pOCs into the ECM-based scaffolds after 24 h, with an increasing cell number at 48 h, which was steadily maintained at Day 7. Data are expressed as the mean ± the standard error of the mean (SEM). a and b indicate statistically significant differences (p < 0.05). (g) Representative picture of the TUNEL assay showing positive cells in red. Nuclei were stained with DAPI (blue). Scale bars = 100 μm and 50 μm. (h) TUNEL-positive cell rates detected 24–48 hours and 7 days postseeding were comparable to those identified in the native tissues (native). Data are expressed as the mean ± the standard error of the mean (SEM).
Figure 5
Figure 5
Gene expression changes in pOCs (line bars), pEpiE (white with black dots bars), and hEpiE (black with white dots bars) during the ECM-based scaffold repopulation process. Expression pattern of fibroblast-specific (VIM, and THY1), pluripotency-related (OCT4, NANONG, REX1, and SOX2), and granulosa-cell-associated (STAR, CYP11A1, CYP19A1, AMH, FSHR, and LHCGR) markers in freshly isolated pOCs and porcine and human untreated fibroblasts (T0), in fibroblasts exposed to 5-aza-CR (post 5- aza-CR), and at different time points of ECM-based scaffold repopulation (24 and 48 h and 7 days). (a), (b), and (c) indicate statistically significant differences (p < 0.05).
Figure 6
Figure 6
Repopulation of decellularized ovarian ECM-based scaffolds with pEpiE. (a) Representative image of porcine untreated fibroblasts showing the typical elongated shape. Scale bar = 100 μm. (b) After 18 h of exposure to 5-aza-CR, the cells displayed a round epithelioid aspect and became smaller in size with larger nuclei and granular cytoplasm. Scale bar = 100 μm. (c) pEpiE adhered and migrated to the decellularized ECM-based ovarian scaffolds. Representative image after 7 days of culture. Scale bar = 100 μm. (d) H & E staining demonstrated the presence of pEpiE in the ECM-based scaffolds. Scale bar = 100 μm. (e) DAPI staining confirmed the positivity for nuclei. Scale bar = 100 μm. (f) Cell density analysis showed ECM-based scaffolds’ repopulation after 24 h, with a higher number of cells after 48 h and 7 days of coculture. Data are expressed as the mean ± the standard error of the mean (SEM). a and b indicate statistically significant differences (p < 0.05). (g) DNA quantification demonstrated the presence of pEpiE in the ECM-based scaffolds after 24 h, with an increasing number of cells at 48 h, which was steadily maintained at Day 7. Data are expressed as the mean ± the standard error of the mean (SEM). a, and b indicate statistically significant differences (p < 0.05). (h) Representative picture of the TUNEL assay showing positive cells in red. Nuclei were stained with DAPI (blue). Scale bars = 100 μm and 50 μm. (i) TUNEL-positive cell rates detected 24–48 h and 7 days after seeding were comparable to those identified in the native tissues (native). Data are expressed as the mean ± the standard error of the mean (SEM).
Figure 7
Figure 7
Repopulation of decellularized ovarian ECM-based scaffolds with hEpiE. (a) Representative image of human untreated fibroblasts showing the typical elongated shape. Scale bar = 100 μm. (b) After 18 h of exposure to 5-aza-CR, cells displayed a round epithelioid aspect and became smaller in size with larger nuclei and granular cytoplasm. Scale bar = 100 μm. (c) hEpiE adhered and migrated into the decellularized ECM-based ovarian scaffolds. Representative image after 7 days of culture. Scale bar = 100 μm. (d) H & E staining demonstrated the presence of hEpiE in the ECM-based scaffolds. Scale bar = 100 μm. (e) DAPI staining showed the positivity for nuclei. Scale bar = 100 μm. (f) Cell density analysis indicated ECM-based scaffolds’ repopulation after 24 h, with a higher number of cells after 48h and 7 days of coculture. Data are expressed as the mean ± the standard error of the mean (SEM). a and b indicate statistically significant differences (p < 0.05). (g) DNA quantification confirmed the presence of hEpiE in the ECM-based scaffolds after 24 h, with an increasing number of cells at 48h, which was steadily maintained at Day 7. Data are expressed as the mean ± the standard error of the mean (SEM). a and b indicate statistically significant differences (p < 0.05). (h) Representative picture of the TUNEL assay showing positive cells in red. Nuclei were stained with DAPI (blue). Scale bars = 100 μm and 50 μm. (i) TUNEL-positive cell rates detected 24–48 hours and 7 days after seeding were comparable to those identified in the native tissues (native). Data are expressed as the mean ± the standard error of the mean (SEM).

References

    1. Lin D., Quan H., Chen K., Lin L., Lin L., Ji Q. An adolescent girl with premature ovarian failure, Graves’ disease, and chronic urticaria: A case report. J. Med. Case Rep. 2020;14:1–5. doi: 10.1186/s13256-020-02491-w. - DOI - PMC - PubMed
    1. Pennarossa G., Ghiringhelli M., Gandolfi F., Brevini T.A.L. Whole-ovary decellularization generates an effective 3D bioscaffold for ovarian bioengineering. J. Assist. Reprod. Genet. 2020:1–11. doi: 10.1007/s10815-020-01784-9. - DOI - PMC - PubMed
    1. Gandolfi F., Ghiringhelli M., Brevini T.A.L., Gandolfi F., Ghiringhelli M., Brevini T.A.L. Bioengineering the ovary to preserve and reestablish female fertility. Anim. Reprod. 2019;16:45–51. doi: 10.21451/1984-3143-AR2018-0099. - DOI - PMC - PubMed
    1. Fu Y.X., Ji J., Shan F., Li J., Hu R. Human mesenchymal stem cell treatment of premature ovarian failure: New challenges and opportunities. Stem Cell Res. Ther. 2021;12:1–13. doi: 10.1186/s13287-021-02212-0. - DOI - PMC - PubMed
    1. Liu W.-Y., Lin S.-G., Zhuo R.-Y., Xie Y.-Y., Pan W., Lin X.-F., Shen F.-X. Xenogeneic decellularized scaffold: A novel platform for ovary regeneration. Tissue Eng. Part. C. Methods. 2017;23:61–71. doi: 10.1089/ten.tec.2016.0410. - DOI - PMC - PubMed

Publication types