. 2021 Jul 21;11(8):1309.
doi: 10.3390/diagnostics11081309.

Forecasting COVID-19 Severity by Intelligent Optical Fingerprinting of Blood Samples

Affiliations

Forecasting COVID-19 Severity by Intelligent Optical Fingerprinting of Blood Samples

Simão P Faria et al. Diagnostics (Basel). .

Abstract

Forecasting COVID-19 disease severity is key to supporting clinical decision making and assisting resource allocation, particularly in intensive care units (ICUs). Here, we investigated the utility of time- and frequency-related features of the backscattered signal of serum patient samples to predict COVID-19 disease severity immediately after diagnosis. ICU admission was the primary outcome used to define disease severity. We developed a stacking ensemble machine learning model including the backscattered signal features (optical fingerprint), patient comorbidities, and age (AUROC = 0.80), which significantly outperformed the predictive value of clinical and laboratory variables available at hospital admission (AUROC = 0.71). The information derived from patient optical fingerprints was not strongly correlated with any clinical/laboratory variable, suggesting that optical fingerprinting brings unique information for COVID-19 severity risk assessment. Optical fingerprinting is a label-free, real-time, and low-cost technology that can be easily integrated as a front-line tool to facilitate the triage and clinical management of COVID-19 patients.

Keywords: COVID-19; machine learning; optical fingerprinting; photonics; predictive biomarker.


Conflict of interest statement

S.P.F., C.C., V.P., S.M.R., J.A., F.M., P.H.S., S.R., P.S., M.M and J.S.P. are employees and/or founders of iLoF. The funders had no role in the design of the study; in the collection, analyses, or interpretation of data; in the writing of the manuscript, or in the decision to publish the results.

Figures

Figure 1
Figure 1
Study design. Patients admitted at the CHUSJ with positive COVID-19 diagnosis by RT-PCR molecular testing were enrolled in the study. Peripheral blood was collected, processed into serum, and analyzed using the iLoF platform. The primary outcome was measured up to four weeks after diagnosis, with 38 patients developing severe disease that required ICU admission, and the remaining 50 patients presenting mild to light symptoms, thus not requiring intensive care.
Figure 2
Figure 2
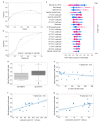
Establishment of the optical fingerprint of COVID-19 severe patients. (a) PR plot showing the positive predictive value (precision) against the sensitivity (recall) of the optical fingerprint model. (b) ROC curve showing the trade-off between sensitivity and specificity using the optical fingerprint model. The diagonal dashed line represents a model with no discrimination. The AUROC with its 95% confidence interval is shown in the plot. Both PR and ROC curves were obtained from the test dataset; blue dots indicate the optimal threshold, while dashed lines represent a random prediction model. (c) Summary plot of the SHAP values of the top 20 optical features distinguishing severe and non-severe patients. Features are ranked (top to bottom) by their overall importance in contributing to the final prediction. The color of each point represents the value of the predictor, with the higher values corresponding to red and the lower values to blue. The distribution along the X-axis indicates the effect that a feature had on the prediction of that specific case. The positive range indicates that the feature contributed to increase the risk of severe illness prediction. (dg) Association and correlation by linear regression between the optical fingerprinting prediction and clinical inflammatory parameters including detection of IgG (d), levels of C-reactive peptide (e), Leukocyte (f), and lymphocyte (g) counts. (eg) Pearson correlation coefficients were calculated for each linear regression and are shown in the respective plots. AUROC: area under the receiver operating characteristic curve; SD: standard deviation; SVD: singular value decomposition; AUC: area under the curve; DCT: discrete cosine transform.
Figure 3
Figure 3
Optical fingerprint-based model to forecast COVID-19 severity. (a) PR plot showing the positive predictive value (precision) against the sensitivity (recall) of the optical fingerprint/comorbidities/age stack model. (b) ROC curve showing the trade-off between sensitivity and specificity using the optical fingerprint/comorbidities/age stack model. The AUROC with its 95% confidence interval is shown in the plot. Both PR and ROC curves were obtained from the test dataset; blue dots indicate the optimal threshold, while dashed lines represent a random prediction model. (c) Summary plot of the SHAP values of the top 20 most important features to distinguish severe and non-severe COVID-19 patients using the stack model of optical fingerprint and comorbidities/age. AUROC: area under the receiver operating characteristic curve; SD: standard deviation; AUC: area under the curve; IQR: Interquartile range; DCT: discrete cosine transform.
Figure 4
Figure 4
Impact of the optical fingerprinting, comorbidities and age stacking model in the clinical trajectory of COVID-19 patients. Optical fingerprinting of patient serum samples, together with the information on patient comorbidities and age, provide a robust and reliable severity risk assessment tool to support the stratification of COVID-19 patients immediately after diagnosis. This information might be of utmost importance to define patient surveillance, manage the timing for treatment initiation, and assist resource allocation.

References

    1. Richardson S., Hirsch J.S., Narasimhan M., Crawford J.M., McGinn T., Davidson K.W., The Northwell COVID-19 Research Consortium Presenting characteristics, comorbidities and outcomes among 5700 patients hospitalized With COVID-19 in the New York City area. JAMA. 2020;323:2052–2059. doi: 10.1001/jama.2020.6775. - DOI - PMC - PubMed
    1. Helms J., Tacquard C., Severac F., Leonard-Lorant I., Ohana M., Delabranche X., Merdji H., Clere-Jehl R., Schenck M., Gandet F.F., et al. High risk of thrombosis in patients with severe SARS-CoV-2 infection: A multicenter prospective cohort study. Intensive Care Med. 2020;46:1089–1098. doi: 10.1007/s00134-020-06062-x. - DOI - PMC - PubMed
    1. Mao L., Jin H., Wang M., Hu Y., Chen S., He Q., Chang J., Hong C., Zhou Y., Wang D., et al. Neurologic manifestations of hospitalized patients with coronavirus disease 2019 in Wuhan, China. JAMA Neurol. 2020;77:683–690. doi: 10.1001/jamaneurol.2020.1127. - DOI - PMC - PubMed
    1. Wu Z., McGoogan J.M. Characteristics of and important lessons from the coronavirus disease 2019 (COVID-19) outbreak in china: Summary of a report of 72 314 cases from the chinese center for disease control and prevention. JAMA. 2020;323:1239–1242. doi: 10.1001/jama.2020.2648. - DOI - PubMed
    1. Williamson E.J., Walker A.J., Bhaskaran K., Bacon S., Bates C., Morton C.E., Curtis H.J., Mehrkar A., Evans D., Inglesby P., et al. Factors associated with COVID-19-related death using OpenSAFELY. Nature. 2020;584:430–436. doi: 10.1038/s41586-020-2521-4. - DOI - PMC - PubMed

LinkOut - more resources