. 2021 Aug 3;11(8):1400.
doi: 10.3390/diagnostics11081400.

A Novel Saliva RT-LAMP Workflow for Rapid Identification of COVID-19 Cases and Restraining Viral Spread

Affiliations

A Novel Saliva RT-LAMP Workflow for Rapid Identification of COVID-19 Cases and Restraining Viral Spread

Gerson Shigeru Kobayashi et al. Diagnostics (Basel). .

Abstract

Rapid diagnostics is pivotal to curb SARS-CoV-2 transmission, and saliva has emerged as a practical alternative to naso/oropharyngeal (NOP) specimens. We aimed to develop a direct RT-LAMP (reverse transcription loop-mediated isothermal amplification) workflow for viral detection in saliva, and to provide more information regarding its potential in curbing COVID-19 transmission. Clinical and contrived specimens were used to optimize formulations and sample processing protocols. Salivary viral load was determined in symptomatic patients to evaluate the clinical performance of the test and to characterize saliva based on age, gender and time from onset of symptoms. Our workflow achieved an overall sensitivity of 77.2% (n = 90), with 93.2% sensitivity, 97% specificity, and 0.895 Kappa for specimens containing >102 copies/μL (n = 77). Further analyses in saliva showed that viral load peaks in the first days of symptoms and decreases afterwards, and that viral load is ~10 times lower in females compared to males, and declines following symptom onset. NOP RT-PCR data did not yield relevant associations. This work suggests that saliva reflects the transmission dynamics better than NOP specimens, and reveals gender differences that may reflect higher transmission by males. This saliva RT-LAMP workflow can be applied to track viral spread and, to maximize detection, testing should be performed immediately after symptoms are presented, especially in females.

Keywords: 2019 novel coronavirus; LAMP (loop-mediated isothermal amplification) assay; saliva; viral diagnostics.


Conflict of interest statement

The authors declare no conflict of interest.

Figures

Figure 1
Figure 1
Modifications to the PK6 formula. (A) Removal of PK and T20 increases Ct value, while substituting GuHCl with PK (4 mg/mL), RNAse OUT or DTT results in no amplification. (B) 800 mM GuHCl is sufficient to stabilize RNA in the presence of PK and T20. (*) The solution containing RNAse OUT was buffered by Tris−EDTA pH 8.0 instead of Tris-HCl (6). (C,D) Optimization of the stabilization solution. (C) RNA stabilization is achieved by replacing PK and T20 with 200 mM DTT and reducing GuHCl to 600 mM, and (D) this is maintained after storage of processed specimens for 24 h at 8 °C. n.d. = not detected.
Figure 2
Figure 2
Effect of DGS heating on direct RT−LAMP reactions. (A) Compatibility between direct RT−LAMP and DGS−processed saliva. After 40−min incubation at 65 °C, colors were visibly distinguishable between the pink NTC and the yellow positive samples. Agarose gel electrophoresis confirmed specific amplification (as band patterns of individuals 13717, 13713 and 13813) matched those of the positive control (104 RNA copies). Nonspecific amplification was observed in NTC after longer incubation (up to 60 min). (BD) Compatibility with direct rtRT−LAMP. (B) SARS−CoV−2 RNA serially spiked in DGS−simulated saliva or in H2O was used to assemble standard curves for primer sets orf1ab, N, N1 and E, in duplicate reactions. Nonspecific and failed amplifications were observed at 0–120 copies/reaction in some reactions (not shown). Doubling time (DT) values were calculated to assess amplification speed/efficiency [12] for each primer set. Determination coefficients (r2) point to high linearity (>0.939) between RNA input and Tt in DGS−simulated saliva, except for primer set N (r2 = 0.8488). (C) Representative color output after rtRT−LAMP (primer set E is shown). (D) Representative dissociation analysis and (D’) gel electrophoresis showing non−specific LAMP products at 0 and 12 copies/reaction (primer set E is shown). NTC (no−template control) reactions were performed with H2O. S = specific amplification; NS = non−specific amplification.
Figure 3
Figure 3
Assessment of different DGS heating protocols via rtRT−LAMP. (A) rtRT−LAMP results for clinical specimens heat−inactivated (no−DGS control) or processed under four DGS protocols (AD). Reactions were performed on different days. (B) rtRT−LAMP results for clinical specimens after protocols (AD), in two parallel experiments. Datapoints above the dashed line are nonspecific amplifications. rtRT−LAMP was performed in a single reaction plate. (C) Reaction output of simulated samples spiked with SARS−CoV−2 RNA (102 to 104 copies/reaction). RNAs spiked in H2O were used as positive control. Lines indicate mean Tt values. (D) Detection rate of the 3 DGS−processed clinical specimens incubated for 48 h at 8 °C and 30 °C (n = 6). (E,E’) rtRT−LAMP results after storage at 8 °C (E) and 30 °C (E’). Data points above the dashed line are nonspecific amplifications. Results shown in D/E/E’ were plotted with data from B (t = 0 h). (F,G) Assessment of protocol B in 11 additional specimens via rtRT−LAMP for primer sets N1 and ACTB. (F) Changes in reaction speed of protocol B compared to A were plotted as ΔTt values; negative values indicate gain in reaction speed. Nonspecific and failed amplifications were not included. (G) Saliva RT−PCR Ct values were plotted against Tt values used in (F). Experiments in (AE) were performed with n = 3 biological samples (P220031, P220032, and P220041 or P220051). All rtRT−LAMP reactions were carried out in duplicates. Since GuHCl was recently shown to improve speed and sensitivity of RT−LAMP (13), all rtRT−LAMP performed on no−DGS controls (protocol A) were supplemented with 40 mM GuHCl to allow more precise evaluation of the DGS protocols.
Figure 4
Figure 4
Direct rtRT−LAMP output after volumetric adjustments and reduction of processing time. (A,B) Output after volumetric adjustments. (A) Representative color output before and after rtRT−LAMP performed on 4 clinical specimens and on 3000 and 1500 simulated viral copies/µL. (B) Sensitivity using simulated specimens (20 replicates each). No−template control (NTC) reactions had H2O as input. (C) Reduction of heat inactivation (HI) and DGS incubation times with respective rtRT−LAMP readout and sensitivity (stratified at 103 copies/μL; dashed line). (D,D’) Before−after plots for 8 specimens processed with HI for 5 min and DGS for 5 min. (D) rtRT−LAMP Tt profiles after 1 freeze–thaw cycle. (D’) Tt profiles after storage for 36 h at 8 °C and 30 °C. cp/μL = viral copies per μL of saliva.
Figure 5
Figure 5
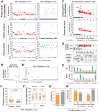
Analysis of saliva as a diagnostic specimen for SARS−CoV−2 detection via direct RT−LAMP. (A) Distribution of viral load in saliva from 51 COVID−19 patients. (B) Pearson’s correlation between viral load in saliva (gene N) and Ct values of NOP swab specimens (genes N and RdRp). (C) Comparison of mean Ct values between saliva and NOP swab specimens; and (C’) the same analysis was performed for each gender. One−way ANOVA with Dunnet’s post−tests; * p < 0.05; ** p < 0.001. (D) Cumulative frequency distribution and (D’) comparison of mean viral loads between males and females; Student’s t-test. (E) Pearson’s correlation between salivary viral load and days since onset of symptoms and (F) the same analysis stratified by gender. Dashed lines or gray shading indicate 95% confidence intervals of the linear trends for significant correlations. (G) Pearson’s correlation between viral load and age for each gender. (G’) Comparison of mean viral loads between genders for younger (aged 14–38) and older (aged 42–88) individuals; Two−way ANOVA with Bonferroni post−tests. (HK’) Comparisons performed for saliva (D’G) were applied to NOP swabs using Ct values from RT−PCR targeting N and RdRp (HK’).
Figure 5
Figure 5
Analysis of saliva as a diagnostic specimen for SARS−CoV−2 detection via direct RT−LAMP. (A) Distribution of viral load in saliva from 51 COVID−19 patients. (B) Pearson’s correlation between viral load in saliva (gene N) and Ct values of NOP swab specimens (genes N and RdRp). (C) Comparison of mean Ct values between saliva and NOP swab specimens; and (C’) the same analysis was performed for each gender. One−way ANOVA with Dunnet’s post−tests; * p < 0.05; ** p < 0.001. (D) Cumulative frequency distribution and (D’) comparison of mean viral loads between males and females; Student’s t-test. (E) Pearson’s correlation between salivary viral load and days since onset of symptoms and (F) the same analysis stratified by gender. Dashed lines or gray shading indicate 95% confidence intervals of the linear trends for significant correlations. (G) Pearson’s correlation between viral load and age for each gender. (G’) Comparison of mean viral loads between genders for younger (aged 14–38) and older (aged 42–88) individuals; Two−way ANOVA with Bonferroni post−tests. (HK’) Comparisons performed for saliva (D’G) were applied to NOP swabs using Ct values from RT−PCR targeting N and RdRp (HK’).
Figure 6
Figure 6
Assessment of the DGS and direct RT-LAMP diagnostic workflow in clinical saliva. (A) Saliva direct rtRT-LAMP output in NOP+ (n = 51) and NOP- (n = 29) individuals with primer sets E1 (in duplicates), As1e and N1. Specific amplifications were classified as positive detections, while nonspecific and failed amplifications were classified as negative. (B) RT-PCR quantification of viral copies in saliva from the 10 discordant NOP+ individuals who escaped detection via rtRT-LAMP and (B’) in saliva from the 29 NOP individuals, including the 4 discordant rtRT-LAMP positives. Undet. = undetermined. (C) rtRT-LAMP with primer sets E1 (in duplicates) and As1e for saliva specimens in which viral titer was determined via RT-PCR (shown in B/B’ and in Figure 5). (D) Assessment of sensitivity, specificity and Kappa values of rtRT-LAMP considering primer set E1 alone or E1/As1e for specimens containing at least 102 viral copies/µL (dashed line). (E) Representative comparisons between visual color interpretation and rtRT-LAMP results (Tt values). Over 97.6% of specimens were correctly classified as positive (P, yellow) or negative (N, pink) for E1 and As1e, and the remaining was classified as inconclusive (I, orange-shaded). (F) Gender comparison of average Tt values in saliva from the NOP+ cases ascertained in ‘A’ (n = 41 rtRT-LAMP positives). Results for primer set E1 were used. Mann–Whitney test was used to compare medians. (F’) Gender comparison of Ct values from NOP RT-PCR for genes N and RdRp. Student’s t-test was used to compare means. n.s. = not significant. (G) Comparison of joint E1/As1e detection rates between genders for 100 saliva specimens ascertained herein via rtRT-LAMP. (G’) Stratified analysis of detection rates between genders, based on days from onset of symptoms.

References

    1. Notomi T., Okayama H., Masubuchi H., Yonekawa T., Watanabe K., Amino N., Hase T. Loop-mediated isothermal amplification of DNA. Nucleic Acids Res. 2000;28:E63. doi: 10.1093/nar/28.12.e63. - DOI - PMC - PubMed
    1. Huang N., Pérez P., Kato T., Mikami Y., Okuda K., Gilmore R.C., Conde C.D., Gasmi B., Stein S., Beach M., et al. SARS-CoV-2 infection of the oral cavity and saliva. Nat. Med. 2021;27:892–903. doi: 10.1038/s41591-021-01296-8. - DOI - PMC - PubMed
    1. Fakheran O., Dehghannejad M., Khademi A. Saliva as a diagnostic specimen for detection of SARS-CoV-2 in suspected patients: A scoping review. Infect. Dis. Poverty. 2020;9:100. doi: 10.1186/s40249-020-00728-w. - DOI - PMC - PubMed
    1. Leal F.E., Mendes-Correa M.C., Buss L.F., Costa S.F., Bizario J.C.S., de Souza S.R.P., Thomaz O., Tozetto-Mendoza T.R., Villas-Boas L.S., de Oliveira-da Silva L.C., et al. Clinical features and natural history of the first 2073 suspected COVID-19 cases in the Corona São Caetano primary care programme: A prospective cohort study. BMJ Open. 2021;11:e042745. - PMC - PubMed
    1. Rabe B.A., Cepko C. SARS-CoV-2 detection using isothermal amplification and a rapid, inexpensive protocol for sample inactivation and purification. Proc. Natl. Acad. Sci. USA. 2020;117:24450–24458. doi: 10.1073/pnas.2011221117. - DOI - PMC - PubMed

LinkOut - more resources