Plasmacytoid Dendritic Cells in Patients with MGUS and Multiple Myeloma
- PMID: 34442012
- PMCID: PMC8396926
- DOI: 10.3390/jcm10163717
Plasmacytoid Dendritic Cells in Patients with MGUS and Multiple Myeloma
Abstract
Background: Plasmacytoid dendritic cells (pDCs) play prominent roles in mediating innate and adaptive immune responses. However, it is unclear how pDCs contribute to the immunosuppressive tumor microenvironment described in multiple myeloma (MM).
Methods: Newly diagnosed myeloma patients (MM, n = 37) were analyzed to determine the pDC counts in comparison to peripheral blood (PB, n = 53) and bone marrow (BM, n = 10) samples of age-matched healthy donors (HD) using flow cytometry. Second, proliferation of myeloma tumor cells in the presence of freshly isolated pDCs was examined. Third, production of IFNα by pDCs co-cultured with MM cells was determined by intracellular staining.
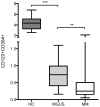
Results: We found a highly significant reduction of circulating pDCs (p < 0.0001) and in bone marrow (p < 0.0001) of MM patients compared to HD. We also observed a significant decrease of pDCs (p = 0.004) in BM in patients with monoclonal gammopathy of undetermined significance (MGUS, n = 12). Importantly, we determined that pDCs promote proliferation specifically of MM cells and not the stromal cells and that pDCs secrete IFNα upon co-culture with MM tumor cells.
Conclusions: Our results show altered pDC frequencies in the BM microenvironment in MGUS and MM patients at diagnosis. We showed the tumor-promoting function of pDCs that may mediate immune deficiencies affecting long-term disease control and treatment outcome.
Keywords: MGUS; immunosuppressive tumor microenvironment; multiple myeloma; plasmacytoid dendritic cells.
Conflict of interest statement
The authors declare no conflict of interest. The funders had no role in the design of the study; in the collection, analyses, or interpretation of data; in the writing of the manuscript, or in the decision to publish the results.
Figures


Similar articles
-
Th22 cells increase in poor prognosis multiple myeloma and promote tumor cell growth and survival.Oncoimmunology. 2015 Feb 3;4(5):e1005460. doi: 10.1080/2162402X.2015.1005460. eCollection 2015 May. Oncoimmunology. 2015. PMID: 26155400 Free PMC article.
-
Increased activated regulatory T cell subsets and aging Treg-like cells in multiple myeloma and monoclonal gammopathy of undetermined significance: a case control study.Cancer Cell Int. 2018 Nov 19;18:187. doi: 10.1186/s12935-018-0687-8. eCollection 2018. Cancer Cell Int. 2018. PMID: 30479566 Free PMC article.
-
Mass Cytometry Discovers Two Discrete Subsets of CD39-Treg Which Discriminate MGUS From Multiple Myeloma.Front Immunol. 2019 Aug 2;10:1596. doi: 10.3389/fimmu.2019.01596. eCollection 2019. Front Immunol. 2019. PMID: 31428081 Free PMC article.
-
[Monoclonal gammopathy of undetermined significance and asymptomatic multiple myelom in the year 2014 ].Vnitr Lek. 2014 Oct;60(10):861-79. Vnitr Lek. 2014. PMID: 25382009 Review. Czech.
-
Tumor-forming plasmacytoid dendritic cells in acute myelocytic leukemia: a report of three cases and literature review.Int J Clin Exp Pathol. 2017 Jul 1;10(7):7285-7291. eCollection 2017. Int J Clin Exp Pathol. 2017. PMID: 31966568 Free PMC article. Review.
Cited by
-
Treating Multiple Myeloma in the Context of the Bone Marrow Microenvironment.Curr Oncol. 2022 Nov 21;29(11):8975-9005. doi: 10.3390/curroncol29110705. Curr Oncol. 2022. PMID: 36421358 Free PMC article. Review.
-
Dissecting molecular mechanisms of immune microenvironment dysfunction in multiple myeloma and precursor conditions.J Cancer Metastasis Treat. 2023;9:17. doi: 10.20517/2394-4722.2022.110. Epub 2023 May 16. J Cancer Metastasis Treat. 2023. PMID: 38213954 Free PMC article.
-
Selinexor's Immunomodulatory Impact in Advancing Multiple Myeloma Treatment.Cells. 2025 Mar 13;14(6):430. doi: 10.3390/cells14060430. Cells. 2025. PMID: 40136679 Free PMC article. Review.
-
Monoclonal Gammopathies and the Bone Marrow Microenvironment: From Bench to Bedside and Then Back Again.Hematol Rep. 2023 Jan 9;15(1):23-49. doi: 10.3390/hematolrep15010004. Hematol Rep. 2023. PMID: 36648882 Free PMC article. Review.
-
The yin-yang effects of immunity: From monoclonal gammopathy of undetermined significance to multiple myeloma.Front Immunol. 2022 Jul 25;13:925266. doi: 10.3389/fimmu.2022.925266. eCollection 2022. Front Immunol. 2022. PMID: 35958625 Free PMC article. Review.
References
-
- Tel J., Schreibelt G., Sittig S.P., Mathan T.S.M., Buschow S.I., Cruz L.J., Lambeck A.J.A., Figdor C.G., de Vries I.J.M. Human Plasmacytoid Dendritic Cells Efficiently Cross-Present Exogenous Ags to CD8+ T Cells despite Lower Ag Uptake than Myeloid Dendritic Cell Subsets. Blood. 2013;121:459–467. doi: 10.1182/blood-2012-06-435644. - DOI - PubMed
Grants and funding
LinkOut - more resources
Full Text Sources

