. 2021 Aug 4;12(8):700.
doi: 10.3390/insects12080700.

A Multi-Scale Model of Disease Transfer in Honey Bee Colonies

Affiliations

A Multi-Scale Model of Disease Transfer in Honey Bee Colonies

Matthew Betti et al. Insects. .

Abstract

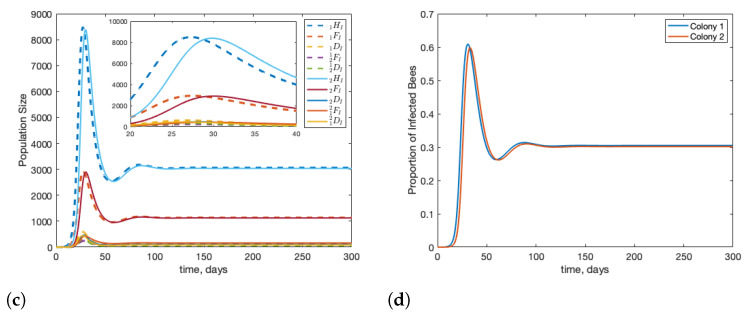
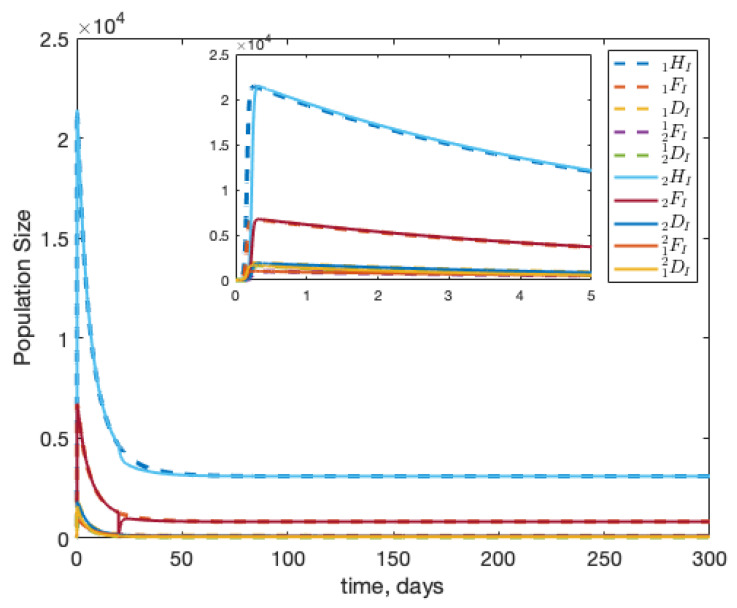
Inter-colony disease transfer poses a serious hurdle to successfully managing healthy honeybee colonies. In this study, we build a multi-scale model of two interacting honey bee colonies. The model considers the effects of forager and drone drift, guarding behaviour, and resource robbing of dying colonies on the spread of disease between colonies. Our results show that when drifting is high, disease can spread rapidly between colonies, that guarding behaviour needs to be particularly efficient to be effective, and that for dense apiaries drifting is of greater concern than robbing. We show that while disease can put an individual colony at greater risk, drifting can help less the burden of disease in a colony. We posit some evolutionary questions that come from this study that can be addressed with this model.

Keywords: disease transfer; drift; honey bee; robbing.


Conflict of interest statement

The authors declare no conflict of interest.

Figures

Figure 1
Figure 1
The dynamics of two healthy colonies with interactions through forager and drone drifting for colony 1 (a) and colony 2 (b). The model is started with initial conditions 1HS(0)=2HS(0) = 10,000, and all other compartments with 0 individuals. Food is considered abundant and infinite. As identical parameter sets are used for both colonies, the dynamics of both colonies are the same.
Figure 2
Figure 2
With the drifting rate set at 10%, we see that on average 12% of the foragers in a colony are foreign. These results are consistent with experimental findings.
Figure 3
Figure 3
Beginning from equilibrium, we introduce one infected forager into colony 1 (1FI(0)=1). We see that infection can travel quickly between two colonies with little delay. Note that the infection in the second colony peaks slightly higher than in the source colony. Panel (a) shows the population of infected bees over time and panel (b) shows the proportion of bees in each colony that are infected over time.
Figure 4
Figure 4
Beginning from equilibrium, we introduce one infected forager into colony 1 (1FI(0)=1). We see that infection is more severe and poses greater long-term risk when bees are not able to drift between colonies. Subfigure (a) shows the infected population in the hives, subfigure (b) shows the percentage of infected bees in each colony.
Figure 5
Figure 5
Beginning from equilibrium, we introduce one infected forager into colony 1 (1FI(0)=1). Subfigure (a) shows the impact of only forager drift on the system of two colonies; d^12=d^21=r^1=r^2=0 and all other parameters as in Table 1. Subfigure (b) shows the impact of only drone drift; d12=d21=r1=r2=0 and all other parameters as in Table 1. Comparing panels (c,d), we see that forager drift is mainly responsible for alleviating infection pressure in the colony as when forager drift is removed, the situation in colony 1 is very similar to when there is no drift at all.
Figure 5
Figure 5
Beginning from equilibrium, we introduce one infected forager into colony 1 (1FI(0)=1). Subfigure (a) shows the impact of only forager drift on the system of two colonies; d^12=d^21=r^1=r^2=0 and all other parameters as in Table 1. Subfigure (b) shows the impact of only drone drift; d12=d21=r1=r2=0 and all other parameters as in Table 1. Comparing panels (c,d), we see that forager drift is mainly responsible for alleviating infection pressure in the colony as when forager drift is removed, the situation in colony 1 is very similar to when there is no drift at all.
Figure 6
Figure 6
Beginning from equilibrium, we introduce one infected forager into colony 1 (1FI(0)=1). In this scenario, we allow healthy foragers and drones to drift between colonies, but infected bees are detected and are removed. In panels (a,b), we assume there is a perfect filter for infected hive bees; in panels (c,d), we assume this guarding behaviour is 50% effective.
Figure 6
Figure 6
Beginning from equilibrium, we introduce one infected forager into colony 1 (1FI(0)=1). In this scenario, we allow healthy foragers and drones to drift between colonies, but infected bees are detected and are removed. In panels (a,b), we assume there is a perfect filter for infected hive bees; in panels (c,d), we assume this guarding behaviour is 50% effective.
Figure 7
Figure 7
Beginning from equilibrium, we introduce one infected forager into colony 1 (1FI(0)=1). In this scenario, we remove drift but allow colony 2 to rob colony 1 of resources as the colony begins to die. We see that in this case the colonies behave independently.
Figure 8
Figure 8
Beginning from equilibrium, we introduce one infected forager into colony 1 (1FI(0)=1). In this scenario, we allow drifting between colonies and allow colony 2 to rob colony 1 of resources as the colony begins to die. We see that in this case the effects of robbing are washed out.
Figure 9
Figure 9
With all other parameters being equal, we change the drift coefficient and measure the time between peak infections in colony 1 and colony 2. We can see for low β (panel (a)) that increasing the drift coefficient (i.e., decreasing the distance between colonies) exponentially decreases the time it take an infection to reach colony 2. When β is high (panel (b)), we see that there is less importance on drift, it only need be present.
Figure 10
Figure 10
With all other parameters being equal, we change β and measure the time between peak infections in colony 1 and colony 2. We can see that increasing β exhibits exponentially decreases in the time it take an infection to reach colony 2, but the change is quite small. In panel (a), we use a drift coefficient of 0.1, and in panel (b), we use a drift coefficient of 1×10⁴.

References

    1. Owen R. Role of human action in the spread of honey bee (Hymenoptera: Apidae) pathogens. J. Econ. Entomol. 2017;110:797–801. doi: 10.1093/jee/tox075. - DOI - PubMed
    1. Coulon M., Dalmon A., Di Prisco G., Prado A., Arban F., Dubois E., Ribière-Chabert M., Alaux C., Thiéry R., Le Conte Y. Interactions between thiamethoxam and Deformed wing virus can drastically impair flight behavior of honey bees. Front. Microbiol. 2020;11:766. doi: 10.3389/fmicb.2020.00766. - DOI - PMC - PubMed
    1. Flores J.M., Gil-Lebrero S., Gámiz V., Rodríguez M.I., Ortiz M.A., Quiles F.J. Effect of the climate change on honey bee colonies in a temperate Mediterranean zone assessed through remote hive weight monitoring system in conjunction with exhaustive colonies assessment. Sci. Total Environ. 2019;653:1111–1119. doi: 10.1016/j.scitotenv.2018.11.004. - DOI - PubMed
    1. Colin T., Meikle W.G., Paten A.M., Barron A.B. Long-term dynamics of honey bee colonies following exposure to chemical stress. Sci. Total Environ. 2019;677:660–670. doi: 10.1016/j.scitotenv.2019.04.402. - DOI - PubMed
    1. De Jong D. Honey Bee Pests, Predators and Diseases. Volume 1. Cornell University Press; Ithaca, NY, USA: 1997. Mites: Varroa and other parasites of brood; pp. 279–327.

LinkOut - more resources