. 2021 Aug 11;26(16):4869.
doi: 10.3390/molecules26164869.

Solvatomorphism of Moxidectin

Affiliations

Solvatomorphism of Moxidectin

Toni Grell et al. Molecules. .

Abstract

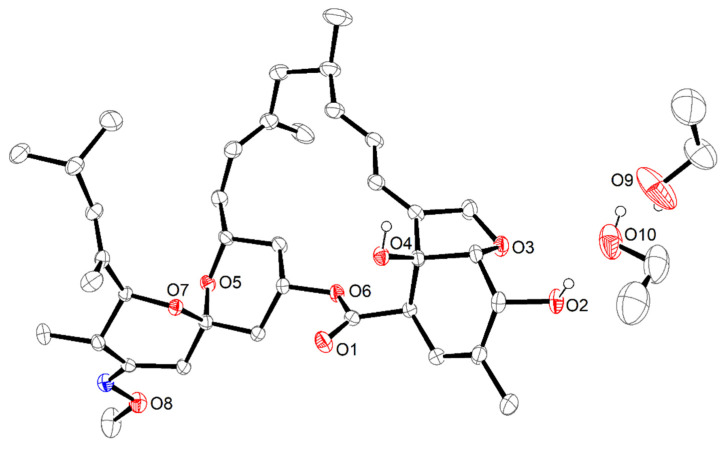
The solvatomorphism of the anthelmintic drug moxidectin is investigated, and a new solvatomorph with nitromethane is reported. Moreover, the hitherto unknown crystal structures of the solvatomorphs with ethanol and 2-propanol are reported and discussed. The thermal characterization of these solvatomorphs through variable-temperature powder X-ray diffraction analysis (VT-PXRD) is also described, providing new insights into the crystallochemistry of this active pharmaceutical ingredient.

Keywords: X-ray diffraction; moxidectin; solvatomorphism; variable-temperature PXRD.


Conflict of interest statement

The funders had no role in the design of the study; in the collection, analyses, or interpretation of data; in the writing of the manuscript, or in the decision to publish the results.

Figures

Scheme 1
Scheme 1
Structural formula of moxidectin including the labels used in this paper for SC-XRD structure description (numbers in black for carbon and red for oxygen atoms).
Figure 1
Figure 1
Calculated PXRD patterns (radiation Cu-Kα) for moxidectin known crystal forms: bottom to top: Form I; Moxi·2EtOH; Moxi·2iPrOH; Moxi·1.5MeNO2. Patterns were calculated from single crystal XRD using the Mercury (CCDC) powder diffraction simulation tool.
Figure 2
Figure 2
Asymmetric unit in the crystal structure of the ethanol solvate (Moxi·2EtOH) containing the molecular structures of moxidectin and two independent ethanol molecules shown with anisotropic displacement parameters (ADPs). ADPs are shown with 50% probability. Color code: C, grey; N, blue; O, red; H, white.
Figure 3
Figure 3
Representation of the chains along the crystallographic [010] direction formed by hydrogen bonds between the molecules in Moxi·2ROH (R = Et, iPr; exemplarily shown for the EtOH solvate). Color code: C, grey; N, blue; O, red; H, white.
Figure 4
Figure 4
Four-membered cyclic hydrogen bond motif between two moxidectin molecules (only fragments shown) and two ethanol solvent molecules. Selected distances O1–O9 3.255(4) Å, O2–O4 2.760(2) Å, O2–O10 2.700(3) Å, O4–O9 2.782(4) Å, O9–O10 2.719(5) Å. Colour code: C, grey; N, blue; O, red; H, white.
Figure 5
Figure 5
Asymmetric unit of the crystal structure of the nitromethane solvate Moxi·1.5MeNO2 showing a one moxidectin and three nitromethane molecules. For the disordered nitromethane molecules only one position is shown. Anisotropic displacement parameters are shown with 30% probability.
Figure 6
Figure 6
Crystal structure of Moxi·1.5MeNO2 showing a dimer of two moxidectin molecules. Selected distances O2–O3′ 2.863(5) Å, O1–O4 2.759(6) Å. Color code: C, grey; N, blue; O, red; H, white.
Figure 7
Figure 7
Comparison of the conformations of the moxidectin molecule in the crystal forms described in this paper. The graphical representation shows the different conformations of moxidectin solvatomorphs. Color code: yellow (Moxi·2EtOH), red (Moxi·2iPrOH), green (Moxi·1.5MeNO2) and blue (form I, CSD reference code GETBOW [12]). The orientation of the 16-membered ring (A) and the spirocycle (B) are indicated.
Figure 8
Figure 8
Two-dimensional contour plot as a function of 2θ and temperature for the collection of PXRD patterns measured at elevating temperatures in the range of 25–100 °C for Moxi·2iPrOH. The collection of PXRD patterns shows that, by raising the temperature, the sample loses crystallinity at about 70 °C, and becomes amorphous. No peak shifts are observed. As a sign of amorphization, the lowering of peak intensities, starting from 65 °C, is observed. The sample can be considered fully amorphous at about 85 °C.
Figure 9
Figure 9
Two-dimensional contour plot as a function of 2θ and temperature for the collection of PXRD patterns measured at elevating temperatures in the range of 25–130 °C for Moxi·1.5MeNO2. The collection of PXRD patterns shows that the sample loses crystallinity at about 50 °C and becomes amorphous by raising the temperature. No peak shifts are observed. As a sign of amorphization, the lowering of peak intensities, starting from 50 °C, is observed. The sample can be considered fully amorphous at about 100 °C.

References

    1. Brittain H.G. Polymorphism in Pharmaceutical Solids. CRC Press; Boca Raton, FL, USA: 2018.
    1. Bernstein J. Polymorphism in Molecular Crystals. Clarendon Press; Oxford, UK: 2007.
    1. Hilfiker R., von Raumer M. Solid Form and Drug Development. John Wiley & Sons Incorporated; Newark, NJ, USA: 2018. Polymorphism in the Pharmaceutical Industry.
    1. Bauer J., Spanton S., Henry R., Quick J., Dziki W., Porter W., Morris J. Ritonavir: An extraordinary example of conformational polymorphism. Pharm. Res. 2001;18:859–866. doi: 10.1023/A:1011052932607. - DOI - PubMed
    1. Price S.L. The computational prediction of pharmaceutical crystal structures and polymorphism. Adv. Drug Deliv. Rev. 2004;56:301–319. doi: 10.1016/j.addr.2003.10.006. - DOI - PubMed