

Machine Learning Models for Sarcopenia Identification Based on Radiomic Features of Muscles in Computed Tomography
- PMID: 34444459
- PMCID: PMC8394435
- DOI: 10.3390/ijerph18168710
Machine Learning Models for Sarcopenia Identification Based on Radiomic Features of Muscles in Computed Tomography
Abstract
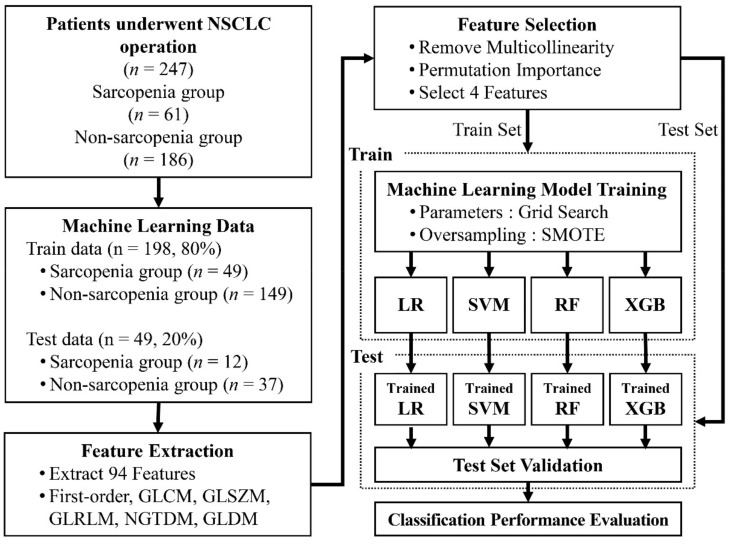
The diagnosis of sarcopenia requires accurate muscle quantification. As an alternative to manual muscle mass measurement through computed tomography (CT), artificial intelligence can be leveraged for the automation of these measurements. Although generally difficult to identify with the naked eye, the radiomic features in CT images are informative. In this study, the radiomic features were extracted from L3 CT images of the entire muscle area and partial areas of the erector spinae collected from non-small cell lung carcinoma (NSCLC) patients. The first-order statistics and gray-level co-occurrence, gray-level size zone, gray-level run length, neighboring gray-tone difference, and gray-level dependence matrices were the radiomic features analyzed. The identification performances of the following machine learning models were evaluated: logistic regression, support vector machine (SVM), random forest, and extreme gradient boosting (XGB). Sex, coarseness, skewness, and cluster prominence were selected as the relevant features effectively identifying sarcopenia. The XGB model demonstrated the best performance for the entire muscle, whereas the SVM was the worst-performing model. Overall, the models demonstrated improved performance for the entire muscle compared to the erector spinae. Although further validation is required, the radiomic features presented here could become reliable indicators for quantifying the phenomena observed in the muscles of NSCLC patients, thus facilitating the diagnosis of sarcopenia.
Keywords: computed tomography; identification; machine learning; radiomic feature; sarcopenia.
Conflict of interest statement
The authors declare no conflict of interest. The funders had no role in the design of the study; in the collection, analyses, or interpretation of data; in the writing of the manuscript, or in the decision to publish the results.
Figures


References
-
- Cruz-Jentoft A.J., Baeyens J.P., Bauer J.M., Boirie Y., Cederholm T., Landi F., Martin F.C., Michel J.P., Rolland Y., Schneider S.M., et al. Sarcopenia: European consensus on definition and diagnosis: Report of the European working group on sarcopenia in older people. Age Ageing. 2010;39:412–423. doi: 10.1093/ageing/afq034. - DOI - PMC - PubMed
-
- Cruz-Jentoft A.J., Landi F., Schneider S.M., Zúñiga C., Arai H., Boirie Y., Chen L.K., Fielding R.A., Martin F.C., Michel J.P., et al. Prevalence of and interventions for sarcopenia in ageing adults: A systematic review. Report of the International Sarcopenia Initiative (EWGSOP and IWGS) Age Ageing. 2014;43:748–759. doi: 10.1093/ageing/afu115. - DOI - PMC - PubMed
-
- Bruyère O., Beaudart C., Locquet M., Buckinx F., Petermans J., Reginster J.-Y. Sarcopenia as a public health problem. Eur. Geriatr. Med. 2016;7:272–275. doi: 10.1016/j.eurger.2015.12.002. - DOI
Publication types
MeSH terms
LinkOut - more resources
Full Text Sources
Medical
Research Materials
