. 2021 Jul 23;13(8):2523.
doi: 10.3390/nu13082523.

Differential Effects of Dietary Components on Glucose Intolerance and Non-Alcoholic Steatohepatitis

Affiliations

Differential Effects of Dietary Components on Glucose Intolerance and Non-Alcoholic Steatohepatitis

Josephine Skat-Rørdam et al. Nutrients. .

Abstract

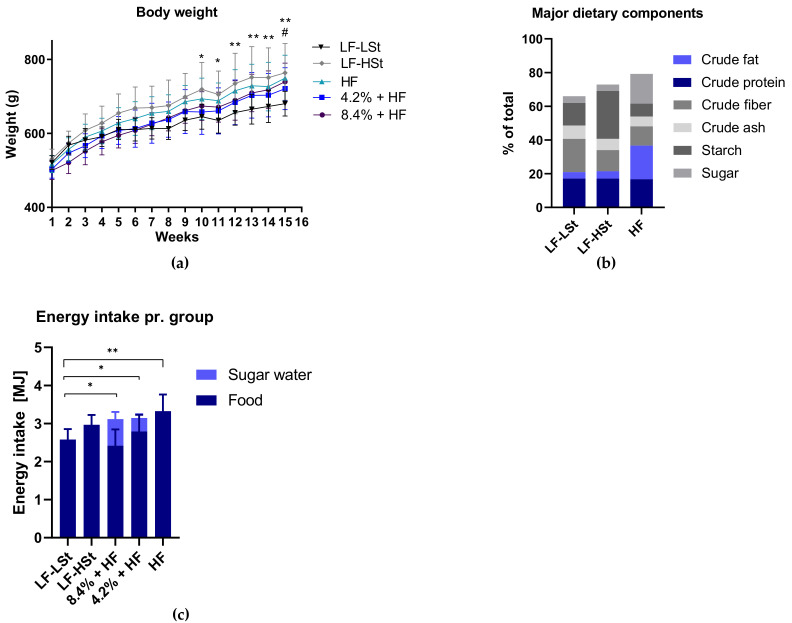
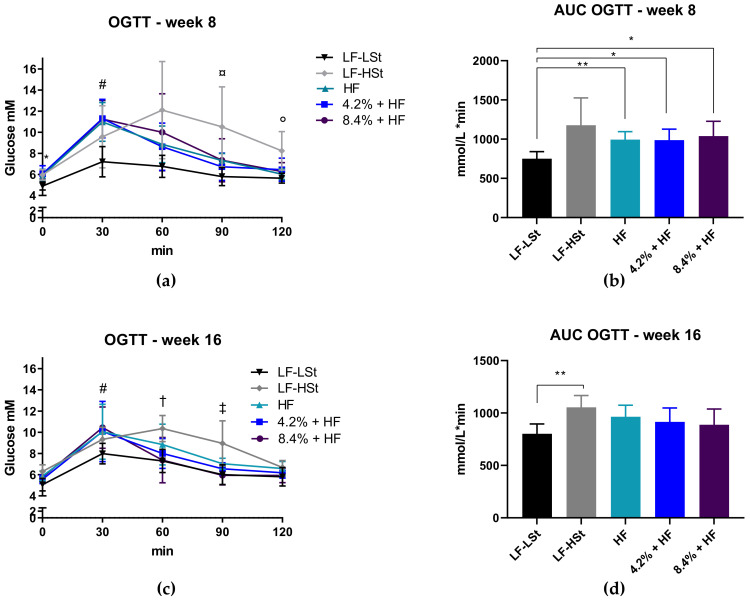
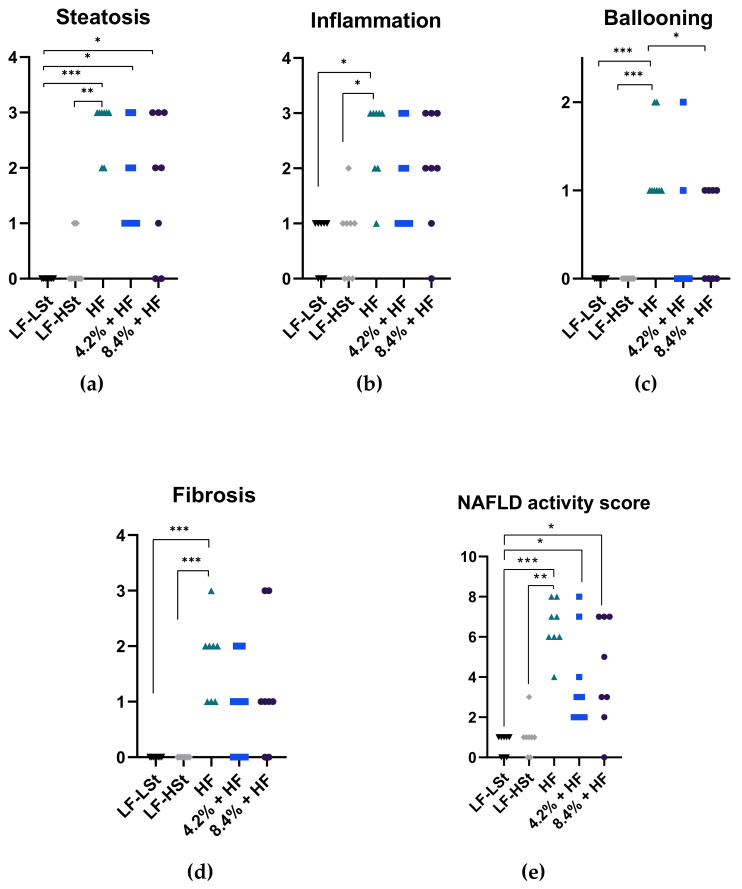
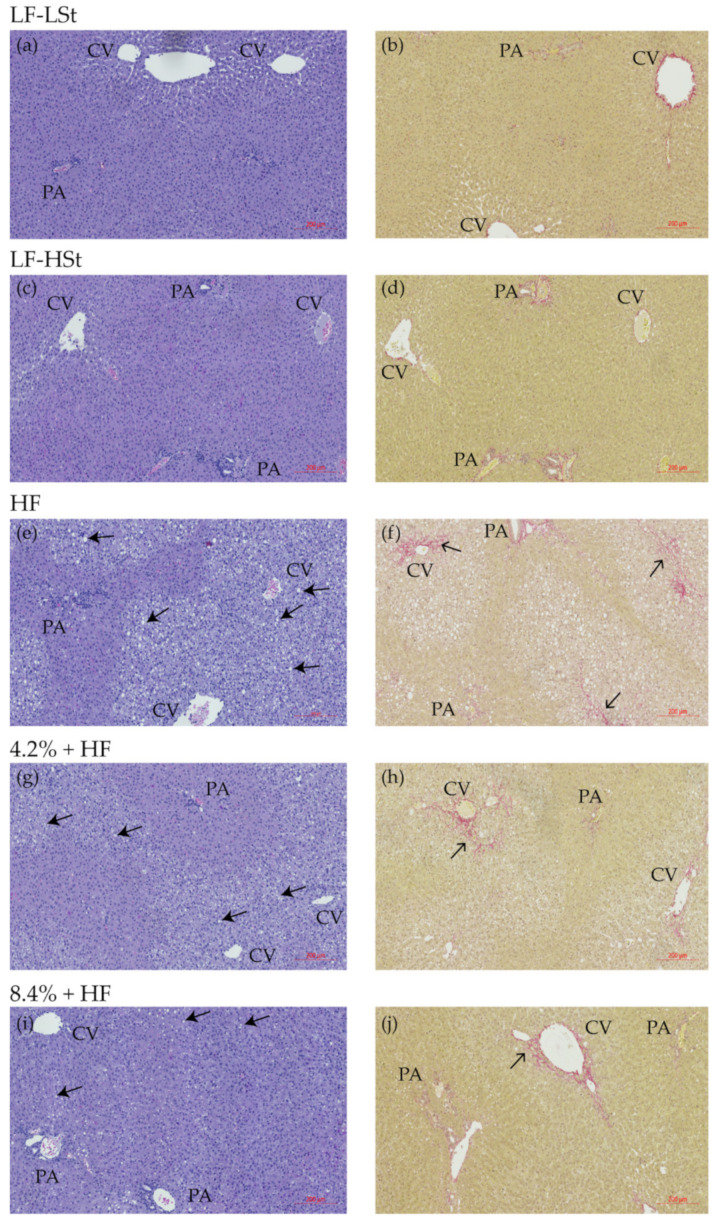
Pharmacological treatment modalities for non-alcoholic fatty liver disease (NAFLD) and steatohepatitis (NASH) are scarce, and discoveries are challenged by lack of predictive animal models adequately reflecting severe human disease stages and co-morbidities such as obesity and type 2 diabetes. To mimic human NAFLD/NASH etiology, many preclinical models rely on specific dietary components, though metabolism may differ considerably between species, potentially affecting outcomes and limiting comparability between studies. Consequently, understanding the physiological effects of dietary components is critical for high translational validity. This study investigated the effects of high fat, cholesterol, and carbohydrate sources on NASH development and metabolic outcomes in guinea pigs. Diet groups (n = 8/group) included: low-fat low-starch (LF-LSt), low-fat high-starch (LF-HSt), high-fat (HF) or HF with 4.2%, or 8.4% sugar water supplementation. The results showed that caloric compensation in HF animals supplied with sugar water led to reduced feed intake and a milder NASH phenotype compared to HF. The HF group displayed advanced NASH, weight gain and glucose intolerance compared to LF-LSt animals, but not LF-HSt, indicating an undesirable effect of starch in the control diet. Our findings support the HF guinea pig as a model of advanced NASH and highlights the importance in considering carbohydrate sources in preclinical studies of NAFLD.

Keywords: NASH; diet; glucose intolerance; soft drink; starch.


Conflict of interest statement

J.S.-R., D.H.I. and J.L. were supported in part by the LifePharm Centre of In Vivo Pharmacology, which has received funding from Novo Nordisk A/S. The funder had no role in experimental design, acquisition, analysis and interpretation of data, writing the manuscript or the decision to publish. M.L. is employed by Novo Nordisk A/S.

Figures

Figure 1
Figure 1
Body Weight and Energy Intake. (a) Body weights for each group are presented as means with SD, for each week. Data was analyzed using a mixed effects model with repeated measures with a Tukey’s test for multiple comparisons. n = 8 (b) Major dietary components presented in % (c) Energy intake in MJ for each group is presented as means with SD and analyzed using a one-way ANOVA with a Dunnett’s test for multiple comparisons. n = 13 average weekly intake pr. group during the study period. For LF-LSt vs. LF-HSt * p < 0.05, ** p < 0.01. for LF-LSt vs. HF # p < 0.05. LF: Low Fat, HSt: High Starch, LSt: Low Starch, HF: High Fat, MJ: Mega Joule.
Figure 2
Figure 2
Oral Glucose Tolerance Tests. (a) Oral glucose tolerance test at week 8. Data are presented as means with SD and square root transformed data were analyzed by a repeated measures two-way ANOVA, and a Tukey’s test for multiple comparisons. n = 8 (b) Area under the curve for each group. Data are represented as means with SD, and analyzed by Welch ANOVA with a Dunnett’s test for multiple comparisons. n = 8 (c) Oral Glucose tolerance test week 16. Data are represented as means with SD, and analyzed by mixed effects model with repeated measures, and a Tukey’s test for multiple comparisons. n = 6–8 (d) Area under the curve for each group. Data are presented as means with SD and analyzed by a one-way ANOVA, with a Dunnett’s test for multiple comparisons. n = 6–8. For (a,c): * LF-LSt different from all, # LF-LSt different from all except LF-HSt, ¤ LF-LSt different from HF and LF-HSt, ° LF-HSt different from HF and LF-LSt, LF-HSt different from all except HF, LF-HSt different from all. p < 0.05. For (b,d): * p < 0.05, ** p < 0.01. LF: Low Fat, HSt: High Starch, LSt: Low Starch, HF: High Fat, AUC: Area Under Curve, OGTT: oral glucose tolerance test, Min: Minutes.
Figure 3
Figure 3
Histopathological scoring. Data are represented as individual scores with medians. (a) Steatosis scores for all groups on a scale of 0–3 (b) Inflammation scores for all groups on a scale of 0–3 (c) Ballooning scores for all groups on a scale of 0–2 (d) Fibrosis scores for all groups on a scale of 0–3 (e) Cumulative NAFLD activity score on a scale of 0–8. Scoring was performed as previously described [28]. The data was analyzed using a non-parametric Kruskal–Wallis with a Dunn’s multiple comparisons test. * p < 0.05, ** p < 0.01, *** p < 0.001. n = 8. LF: Low Fat, HSt: High Starch, LSt: Low Starch, HF: High Fat.
Figure 4
Figure 4
Representative histological images. (a,c,e,g,i) Hematoxylin and eosin stain. Scale bar shows 200 µm. (b,d,f,h,j) Picro Sirius Red stain. Scale bar shows 200 µm. Solid arrows indicate lipid vacuoles, and open arrows indicate fibrosis (in red). CV: central vein, PA: portal area, HF: high fat, LF: low fat, HSt: high starch, LSt: low starch.

References

    1. Younossi Z., Anstee Q.M., Marietti M., Hardy T., Henry L., Eslam M., George J., Bugianesi E. Global burden of NAFLD and NASH: Trends, predictions, risk factors and prevention. Nat. Rev. Gastroenterol. Hepatol. 2018;15:11–20. doi: 10.1038/nrgastro.2017.109. - DOI - PubMed
    1. Younossi Z., Tacke F., Arrese M., Chander Sharma B., Mostafa I., Bugianesi E., Wai-Sun Wong V., Yilmaz Y., George J., Fan J., et al. Global Perspectives on Nonalcoholic Fatty Liver Disease and Nonalcoholic Steatohepatitis. Hepatology. 2019;69:2672–2682. doi: 10.1002/hep.30251. - DOI - PubMed
    1. Schuppan D., Schattenberg J.M. Non-alcoholic steatohepatitis: Pathogenesis and novel therapeutic approaches. J. Gastroenterol. Hepatol. 2013;28(Suppl. 1):68–76. doi: 10.1111/jgh.12212. - DOI - PubMed
    1. Byrne C.D., Targher G. NAFLD: A multisystem disease. J. Hepatol. 2015;62:S47–S64. doi: 10.1016/j.jhep.2014.12.012. - DOI - PubMed
    1. Farrell G., Schattenberg J.M., Leclercq I., Yeh M.M., Goldin R., Teoh N., Schuppan D. Mouse Models of Nonalcoholic Steatohepatitis: Toward Optimization of Their Relevance to Human Nonalcoholic Steatohepatitis. Hepatology. 2019;69:2241–2257. doi: 10.1002/hep.30333. - DOI - PubMed

MeSH terms