

Effects of Cranberry Juice Supplementation on Cardiovascular Disease Risk Factors in Adults with Elevated Blood Pressure: A Randomized Controlled Trial
- PMID: 34444779
- PMCID: PMC8398037
- DOI: 10.3390/nu13082618
Effects of Cranberry Juice Supplementation on Cardiovascular Disease Risk Factors in Adults with Elevated Blood Pressure: A Randomized Controlled Trial
Abstract
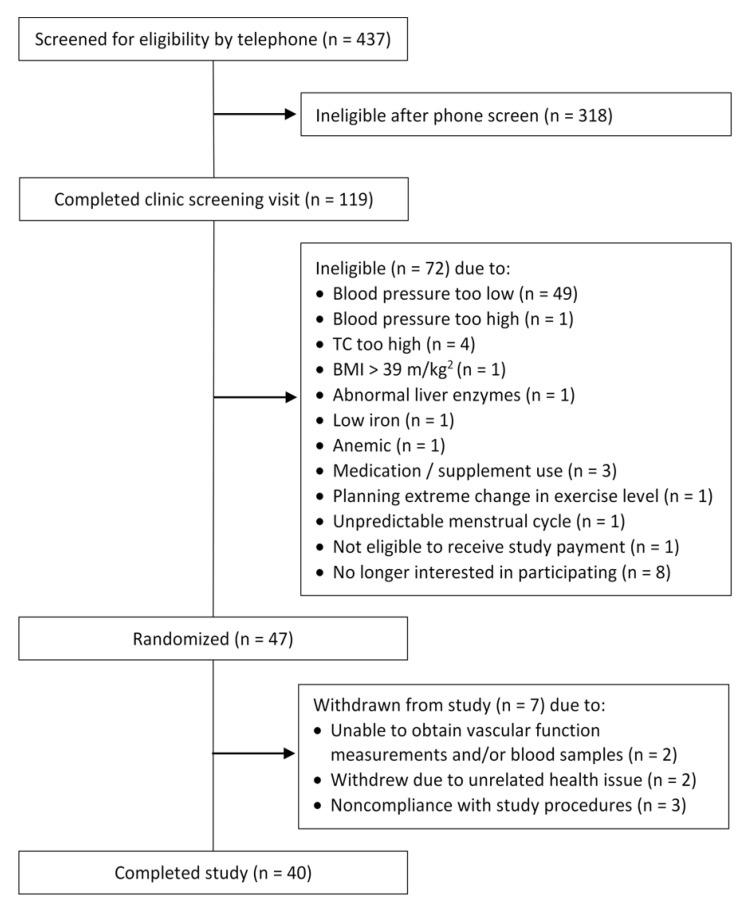
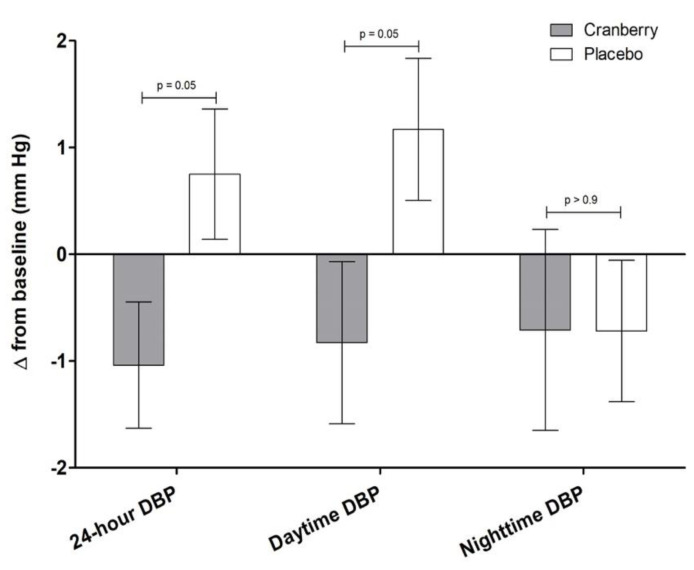
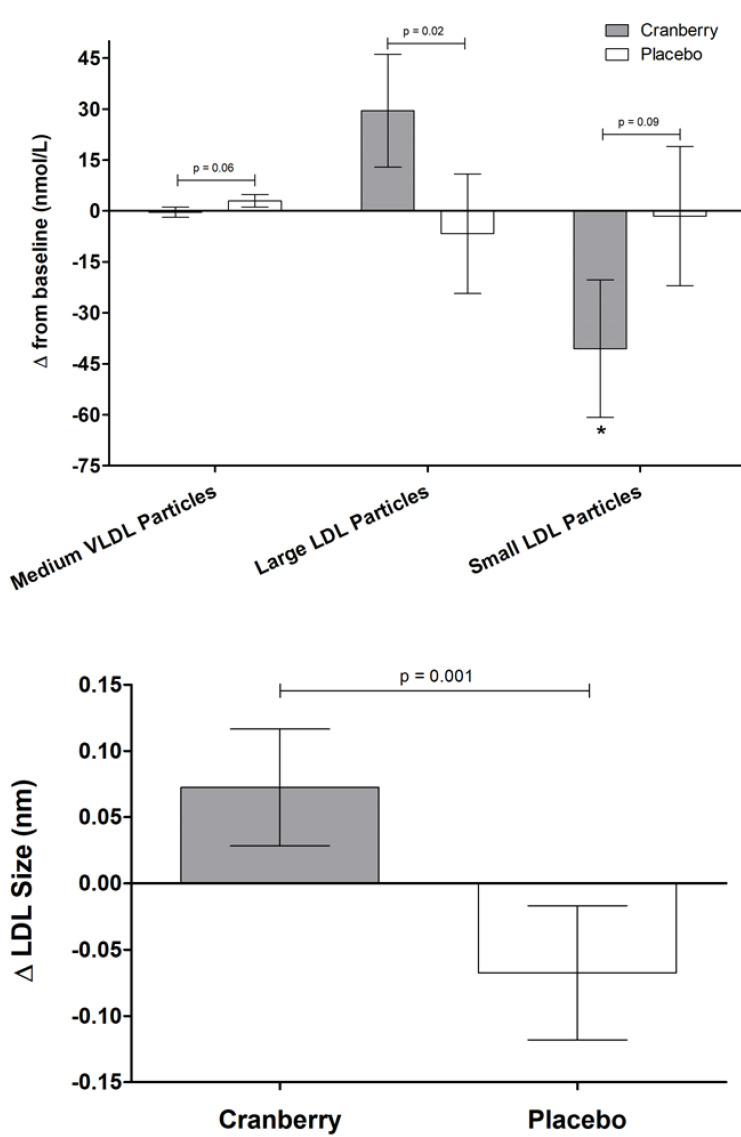
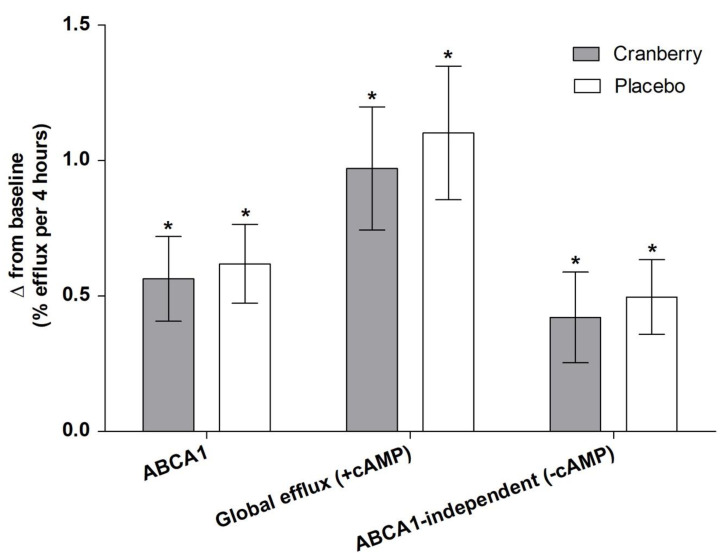
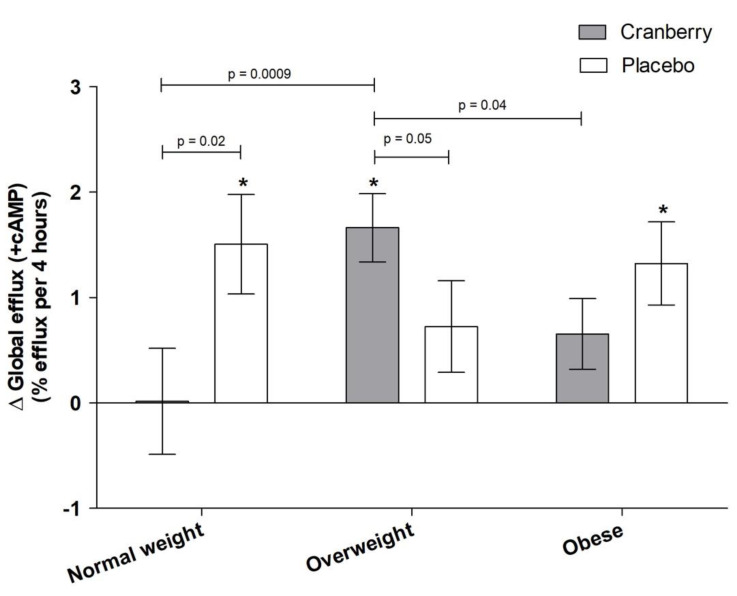
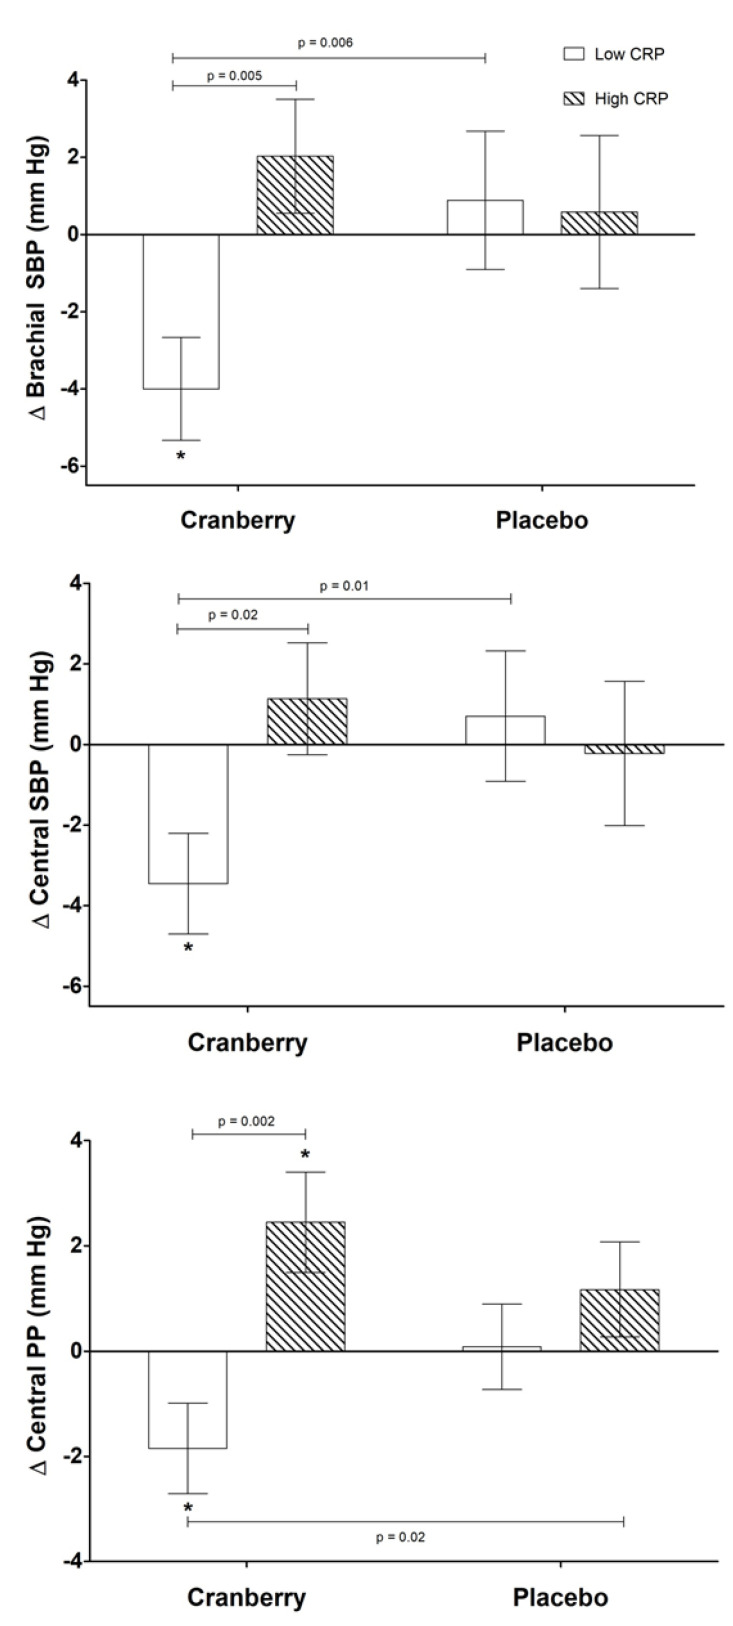
Emerging cardiovascular disease (CVD) risk factors, including central vascular function and HDL efflux, may be modifiable with food-based interventions such as cranberry juice. A randomized, placebo-controlled, crossover trial was conducted in middle-aged adults with overweight/obesity (n = 40; mean BMI: 28.7 ± 0.8 kg/m2; mean age: 47 ± 2 years) and elevated brachial blood pressure (mean systolic/diastolic BP: 124 ± 2/81 ± 1 mm Hg). Study participants consumed 500 mL/d of cranberry juice (~16 fl oz; 27% cranberry juice) or a matched placebo juice in a randomized order (8-week supplementation periods; 8-week compliance break), with blood samples and vascular measurements obtained at study entry and following each supplementation period. There was no significant treatment effect of cranberry juice supplementation on the primary endpoint of central systolic blood pressure or central or brachial diastolic pressure. Cranberry juice significantly reduced 24-h diastolic ambulatory BP by ~2 mm Hg compared to the placebo (p = 0.05) during daytime hours. Cranberry juice supplementation did not alter LDL-C but significantly changed the composition of the lipoprotein profile compared to the placebo, increasing the concentration of large LDL-C particles (+29.5 vs. -6.7 nmol/L; p = 0.02) and LDL size (+0.073 vs. -0.068 nm; p = 0.001). There was no effect of treatment on ex vivo HDL efflux in the total population, but exploratory subgroup analyses identified an interaction between BMI and global HDL efflux (p = 0.02), with greater effect of cranberry juice in participants who were overweight. Exploratory analyses indicate that baseline C-reactive protein (CRP) values may moderate treatment effects. In this population of adults with elevated blood pressure, cranberry juice supplementation had no significant effect on central systolic blood pressure but did have modest effects on 24-h diastolic ambulatory BP and the lipoprotein profile. Future studies are needed to verify these findings and the results of our exploratory analyses related to baseline health moderators.
Keywords: LDL-C; arterial stiffness; blood pressure; inflammatory markers; lipids.
Conflict of interest statement
The authors declare no conflict of interest.
Figures
References
-
- Centers for Disease Control . National Vital Statistics Report—Deaths: Leading causes for 2017. U.S. Department of Health & Human Services; Hyattsville, MD, USA: 2019.
-
- World Health Organization The Top 10 Causes of Death. [(accessed on 29 July 2021)];2018 Available online: https://www.who.int/news-room/fact-sheets/detail/the-top-10-causes-of-death.
-
- 2015 Dietary Guidelines Advisory Committee . Scientific Report of the 2015 Dietary Guidelines Advisory Committee. U.S. Department of Agriculture; Washington, DC, USA: 2015.
-
- Eckel R.H., Jakicic J.M., Ard J.D., de Jesus J.M., Houston Miller N., Hubbard V.S., Lee I., Lichtenstein A.H., Loria C.M., Millen B.E., et al. 2013 AHA/ACC guideline on lifestyle management to reduce cardiovascular risk: A report of the American College of Cardiology/American Heart Association Task Force on Practice Guidelines. J. Am. Coll. Cardiol. 2014;63:2960–2984. doi: 10.1016/j.jacc.2013.11.003. - DOI - PubMed
Publication types
MeSH terms
Substances
Grants and funding
LinkOut - more resources
Full Text Sources
Medical
Research Materials
Miscellaneous
