. 2021 Aug 6;22(16):8446.
doi: 10.3390/ijms22168446.

Autophagic Upregulation Is Cytoprotective in Ischemia/Reperfusion-Injured Retina and Retinal Progenitor Cells

Affiliations

Autophagic Upregulation Is Cytoprotective in Ischemia/Reperfusion-Injured Retina and Retinal Progenitor Cells

Larissa Ho Ching Tang et al. Int J Mol Sci. .

Abstract

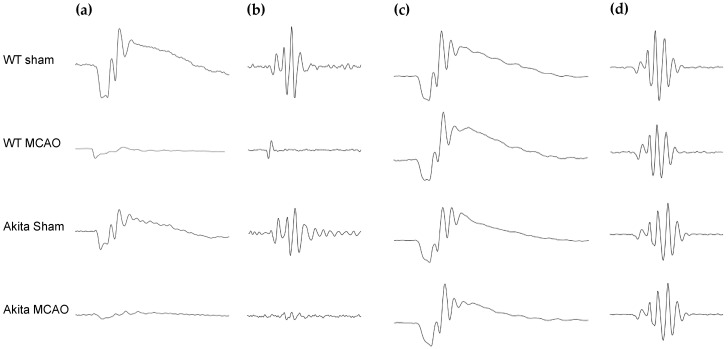
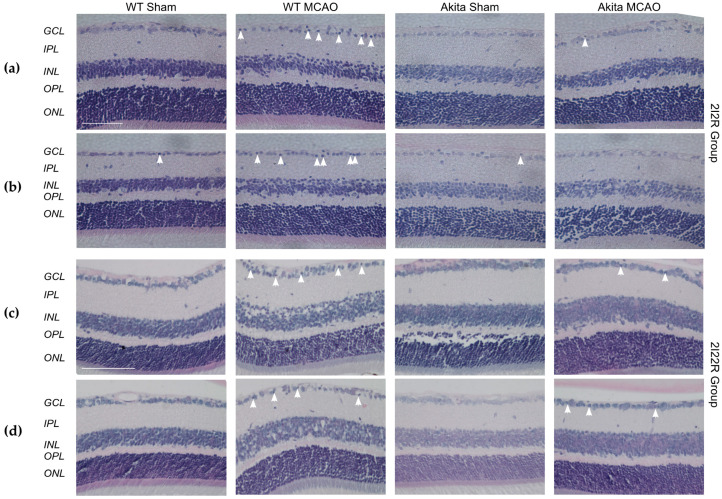
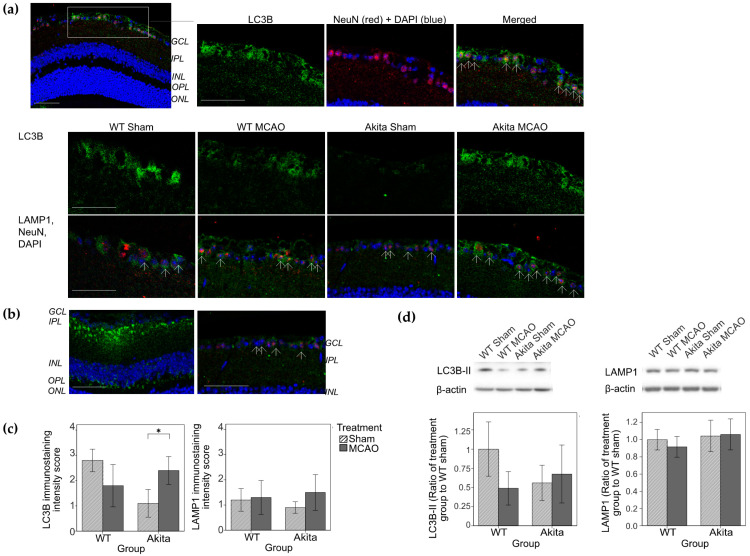
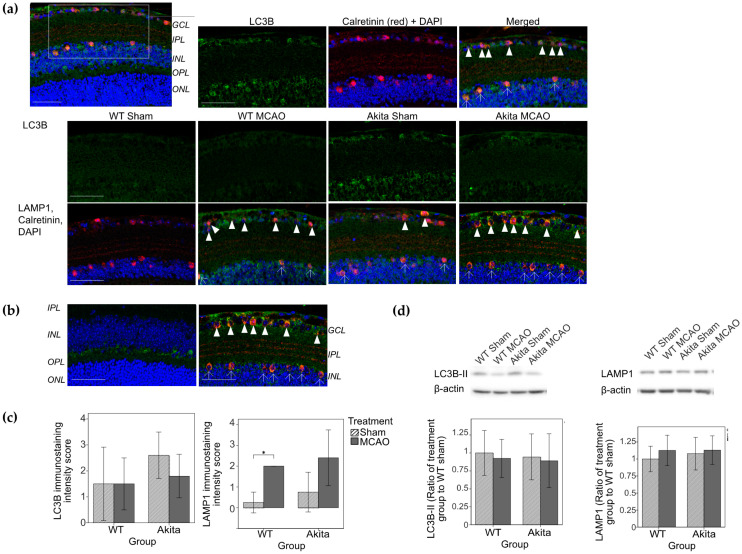
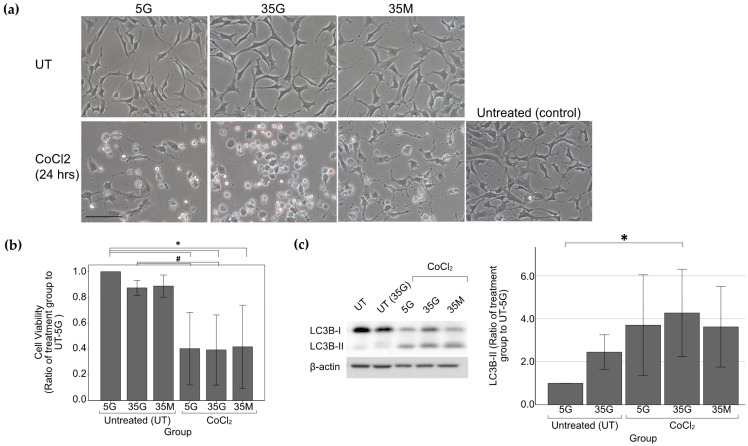
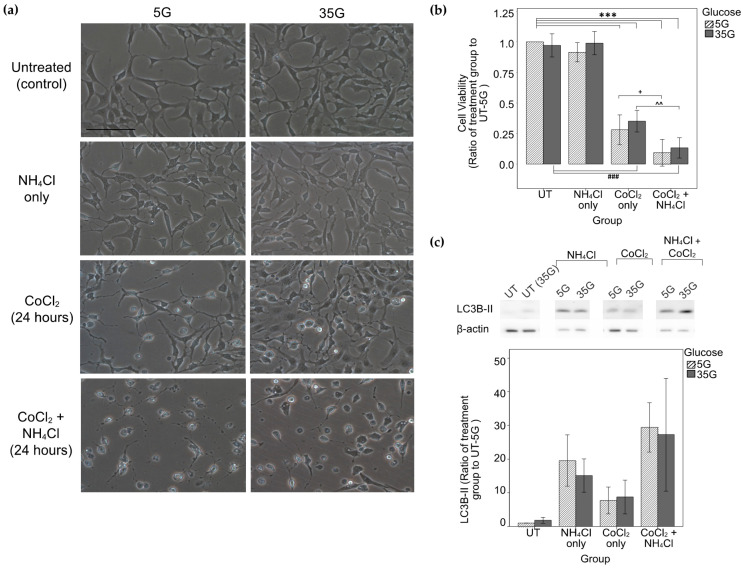
The cytoprotective versus cytotoxic role of macroautophagy in ocular ischemia/reperfusion injuries remains controversial and its effects under hyperglycemia are unclear. We investigated the involvement of autophagy in in vitro and in vivo normoglycemic and hyperglycemic models of retinal ischemia/reperfusion injury. Retinal ischemia (2 h) and reperfusion (2 or 22 h) was induced in wild-type and type I diabetic Ins2Akita/+ mice using a middle cerebral artery occlusion model. R28 retinal precursor cells were subjected to CoCl2-induced hypoxia with or without autophagic inhibitor NH4Cl. Autophagic regulation during ischemia/reperfusion was assessed through immunohistochemical detection and Western blotting of microtubule-associated protein 1A/1B-light chain 3 (LC3) and lysosomal associated membrane protein 1 (LAMP1). Effect of autophagic inhibition on cell viability and morphology under hypoxic conditions was also evaluated. Upregulation of autophagic markers in the inner retinae was seen after two hours reperfusion, with tapering of the response following 22 h of reperfusion in vivo. LC3-II turnover assays confirmed an increase in autophagic flux in our hypoxic in vitro model. Pharmacological autophagic inhibition under hypoxic conditions decreased cell survival and induced structural changes not demonstrated with autophagic inhibition alone. Yet no statistically significant different autophagic responses in ischemia/reperfusion injuries were seen between the two glycemic states.

Keywords: CoCl2; LAMP1; LC3; NH4Cl; R28 cells; autophagy inhibitors; hypoxia; macroautophagy.


Conflict of interest statement

The authors declare no conflict of interest. The funders had no role in the design of the study; in the collection, analyses, or interpretation of data; in the writing of the manuscript, or in the decision to publish the results.

Figures

Figure 1
Figure 1
Representative waveforms of scotopic flash ERG responses in WT and Akita mice after sham or MCAO treatment for 2I2R (a,b) and 2I22R (c,d) groups at 3 cd.s/m² intensity. (a) a-wave and b-wave waveforms for 2I2R group; (b) oscillatory potential waveforms for 2I2R group; (c) a-wave and b-wave waveforms for 2I22R group; (d) oscillatory potentials waveforms for 2I22R group. Figure and caption has been adapted from a dissertation [9]. Please refer to acknowledgements section.
Figure 2
Figure 2
Retinal morphological samples from the 2I2R and 2I22R group in the central retina (a,c) and mid-peripheral retina (b,d). Morphological examination under 40× magnification (a,b) and 20× magnification (c,d) showed similar retinal thicknesses in all layers among all groups in both the central and mid-peripheral retinae. More pyknotic cells were observed in the WT MCAO-injured retinae (arrowheads) as compared with WT sham-treated retinae in the 2I2R group, and in the MCAO-injured retinae (arrowheads) as compared with sham-treated retinae in the 2I22R group. There is a slight increase in total retinal thickness in MCAO-injured retinae as compared to sham-treated retinae in the 2I22R group. Scale bars: 50 μm (a,b), 100 μm (c,d). Figure and caption has been adapted from a dissertation [9]. Please refer to acknowledgements section.
Figure 3
Figure 3
Immunohistochemical staining of PKCα, LC3B, LAMP1, and NeuN, immunohistochemical staining grading of LC3B and LAMP1 and Western blot analysis of LC3B-II and LAMP1 in the 2I2R group. (a) Immunohistochemical staining of LC3B (top and middle row) and LAMP1 (bottom row). Double immunolabelling of LC3 and NeuN (neuronal marker) showed colocalization of the two markers (arrows) in the GCL of the Akita MCAO-injured retina sample. LC3 immunoreactivity was increased in the GCL of Akita MCAO-injured retinae as compared with Akita sham-treated retinae. Colocalization of LAMP1 (green) and NeuN (red) (shown with DAPI) in the GCL layer (arrows). Staining of LC3 and LAMP1 was performed on adjacent slides. Scale bars: 50 μm; (b) Immunohistochemical staining of PKCα (left, green, shown with DAPI), LAMP1 and NeuN (right) in Akita sham-treated retinae samples to show the localization of rod bipolar cells. Colocalization of LAMP1 (green) and NeuN (red) (shown with DAPI) in the GCL layer (arrows). LAMP1 was not stained in areas of rod bipolar cells. Staining of PKCα and LAMP1 was performed on adjacent slides. Scale bars: 50 μm; (c) Immunohistochemical staining grading of LC3B (left) and LAMP1 (right). Score of 1 represents the weakest immunoreactivity while a score of 4 represented the highest immunoreactivity. * p < 0.05 as compared with Akita sham group. n = 5 in each group. Values represent mean with error bars +/− SD. (d) Western blot analysis of LC3B-II (left) and LAMP1 (right). Levels of LC3B-II were measured by Western blot analysis and normalized by β-actin. Densitometry analysis showed increased LC3B-II levels in Akita MCAO-injured retinae compared with Akita sham-treated retinae, but there was no statistically significant difference. Densitometry analysis showed no differences in LAMP1 among the four groups. n = 5 in each group. Values represent mean with error bars +/− SD. Figure and caption has been adapted from a dissertation [9]. Please refer to acknowledgements section.
Figure 4
Figure 4
Immunohistochemical staining of calbindin, LC3B, LAMP1, and calretinin, immunohistochemical staining grading of LC3B and LAMP1 and Western blot analysis of LC3B-II and LAMP1 in the 2I22R group. (a) Immunohistochemical staining of LC3B (top and middle row) and LAMP1 (bottom row). Double immunolabelling of LC3 and calretinin (amacrine cell marker) showed colocalization of the two markers (arrows) in the GCL and INL of the Akita sham-treated retina sample. Colocalization of LAMP1 (green) and calretinin (red) (shown with DAPI) in the GCL layer (arrowheads) and INL (arrows). LAMP1 immunoreactivity was increased in the GCL and INL of MCAO-injured retinae as compared with sham-treated retinae. Staining of LC3 and LAMP1 was performed on adjacent slides. Scale bars: 50 μm; (b) Immunohistochemical staining of calbindin (left, green, shown with DAPI), LAMP1 and calretinin (right) in Akita MCAO-injured retinae samples to show the localization of horizontal cells. Colocalization of LAMP1 (green) and calretinin (red) (shown with DAPI) in the GCL (arrowheads) and INL (arrows) (same image as shown in Figure 4 (a) bottom right corner). LAMP1 was not stained in areas of the horizontal cells. Staining of calbindin and LAMP1 was performed on adjacent slides. Scale bars: 50 μm; (c) Immunohistochemical staining grading of LC3B (left) and LAMP1 (right). Score of 1 represents the weakest immunoreactivity while a score of 4 represented the highest immunoreactivity. * p < 0.05 as compared with WT sham group. n = 5 in each group. Values represent mean with error bars +/− SD.; (d) Western blot analysis of LC3B-II (left) and LAMP1 (right). Levels of LC3B-II were measured by Western blot analysis and normalized by β-actin. Densitometry analysis showed similar LC3B-II levels in MCAO-injured retinae as compared with their respective sham-treated counterparts. Densitometry analysis did not show significant differences in LAMP1 among the four groups. n = 5 in each group. Values represent mean with error bars +/− SD. Figure and caption has been adapted from a dissertation [9]. Please refer to acknowledgements section.
Figure 5
Figure 5
Cell morphology, cell viability and western blot analysis of LC3B-II in R28 cells under glucose treatment and/or 500 μM CoCl2 chemically-induced hypoxia. (a) Cell morphology of cells after glucose treatment alone and after 500 μM CoCl2 treatment. Similar cell morphology was observed among R28 cells subjected to different levels of glucose treatment and in the osmotic control. High glucose-treated cells appeared to be more susceptible to hypoxia damage as seen by the increase in cytoplasmic vacuoles. Scale bars: 100 μm; (b) Cell viability of cells after glucose treatment and chemically-induced hypoxia. Both low glucose and high glucose-treated cells had significantly lower cell viability than their respective untreated groups. n = 7 except UT-35M n = 5. * p < 0.05 as compared with UT-5G, # p < 0.05 as compared with UT-35G. Values represent mean with error bars +/− SD; (c) Western blot analysis of LC3B-II. Levels of autophagy markers LC3B-II were measured by Western blot analysis and normalized by β-actin. Densitometry analysis showed a statistically significant increase in LC3B-II levels in high glucose-treated cells subjected to hypoxia as compared with untreated cells. Glucose treatment alone (UT-35G) did not induce statistically significant LC3B-II upregulation. * p < 0.05 as compared with UT-5G. n = 7 except for UT-35G and 35M groups (n = 4). Values represent mean with error bars +/− SD. Figure and caption has been adapted from a dissertation [9]. Please refer to acknowledgements section.
Figure 6
Figure 6
Cell morphology, cell viability and western blot analysis of LC3B-II in R28 cells after glucose treatment, NH4Cl treatment, 250 μM CoCl2 chemically-induced hypoxia or chemically-induced hypoxia with NH4Cl. (a) Cell morphology of cells subjected to CoCl2-induced hypoxia and autophagy inhibition. More cytoplasmic vacuoles were observed in cells treated with the autophagy inhibitor in addition to the hypoxic insult, as compared with cells treated with hypoxia only. Scale bars = 100 μm; (b) Cell viability of R28 cells under different treatment conditions. Both low glucose and high glucose-treated cells had significantly lower cell viability when induced with hypoxia as compared to their respective untreated groups. Those treated only with autophagy inhibitors had similar viability to their respective untreated groups. Cells treated with hypoxic insult and autophagy inhibition had lower cell viability than those treated only with hypoxic insult. n = 6. *** p < 0.001 as compared with UT-5G; ### p < 0.001 as compared with UT-35G; + p < 0.05 as compared with CoCl2 only-5G; ^^ p < 0.01 as compared with CoCl2 only-35G. Values represent mean with error bars +/− SD; (c) Levels of LC3B-II were measured by Western blot analysis and normalized by β-actin. Densitometry analysis showed an increase in LC3B-II levels in cells treated with CoCl2 as compared with the untreated group. Addition of NH4Cl to CoCl2 in the 5G group further increased the LC3B-II levels as compared with the CoCl2 only 5G group (p = 0.051). Figure and caption has been adapted from a dissertation [9]. Please refer to acknowledgements section.

References

    1. Mizushima N., Levine B., Cuervo A.M., Klionsky D.J. Autophagy fights disease through cellular self-digestion. Nature. 2008;451:1069–1075. doi: 10.1038/nature06639. - DOI - PMC - PubMed
    1. Russo R., Varano G.P., Adornetto A., Nazio F., Tettamanti G., Girardello R., Cianfanelli V., Cavaliere F., Morrone L.A., Corasaniti M.T., et al. Rapamycin and fasting sustain autophagy response activated by ischemia/reperfusion injury and promote retinal ganglion cell survival. Cell Death Dis. 2018;9:981. doi: 10.1038/s41419-018-1044-5. - DOI - PMC - PubMed
    1. Piras A., Gianetto D., Conte D., Bosone A., Vercelli A. Activation of autophagy in a rat model of retinal ischemia following high intraocular pressure. PLoS ONE. 2011;6:e22514. doi: 10.1371/journal.pone.0022514. - DOI - PMC - PubMed
    1. Wei T., Kang Q., Ma B., Gao S., Li X., Liu Y. Activation of autophagy and paraptosis in retinal ganglion cells after retinal ischemia and reperfusion injury in rats. Exp. Ther. Med. 2015;9:476–482. doi: 10.3892/etm.2014.2084. - DOI - PMC - PubMed
    1. Produit-Zengaffinen N., Pournaras C.J., Schorderet D.F. Autophagy induction does not protect retina against apoptosis in ischemia/reperfusion model. Adv. Exp. Med. Biol. 2014;801:677–683. doi: 10.1007/978-1-4614-3209-8_85. - DOI - PubMed