. 2021 Aug 6;22(16):8481.
doi: 10.3390/ijms22168481.

YY1 Silencing Induces 5-Fluorouracil-Resistance and BCL2L15 Downregulation in Colorectal Cancer Cells: Diagnostic and Prognostic Relevance

Affiliations

YY1 Silencing Induces 5-Fluorouracil-Resistance and BCL2L15 Downregulation in Colorectal Cancer Cells: Diagnostic and Prognostic Relevance

Silvia Vivarelli et al. Int J Mol Sci. .

Abstract

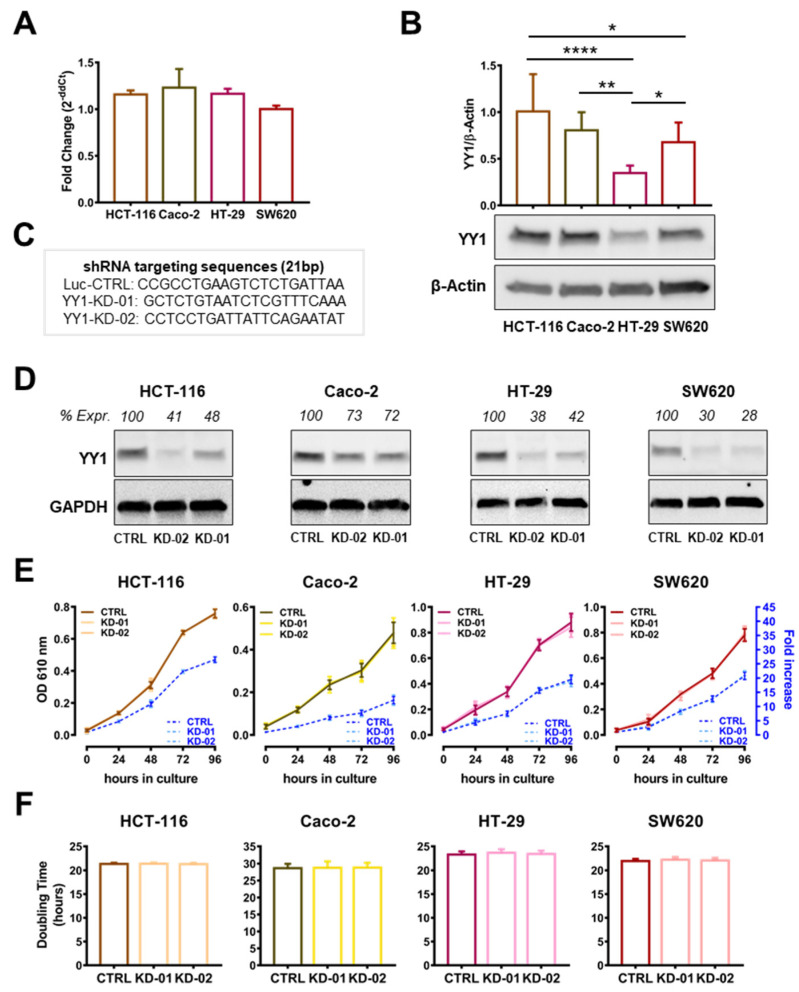
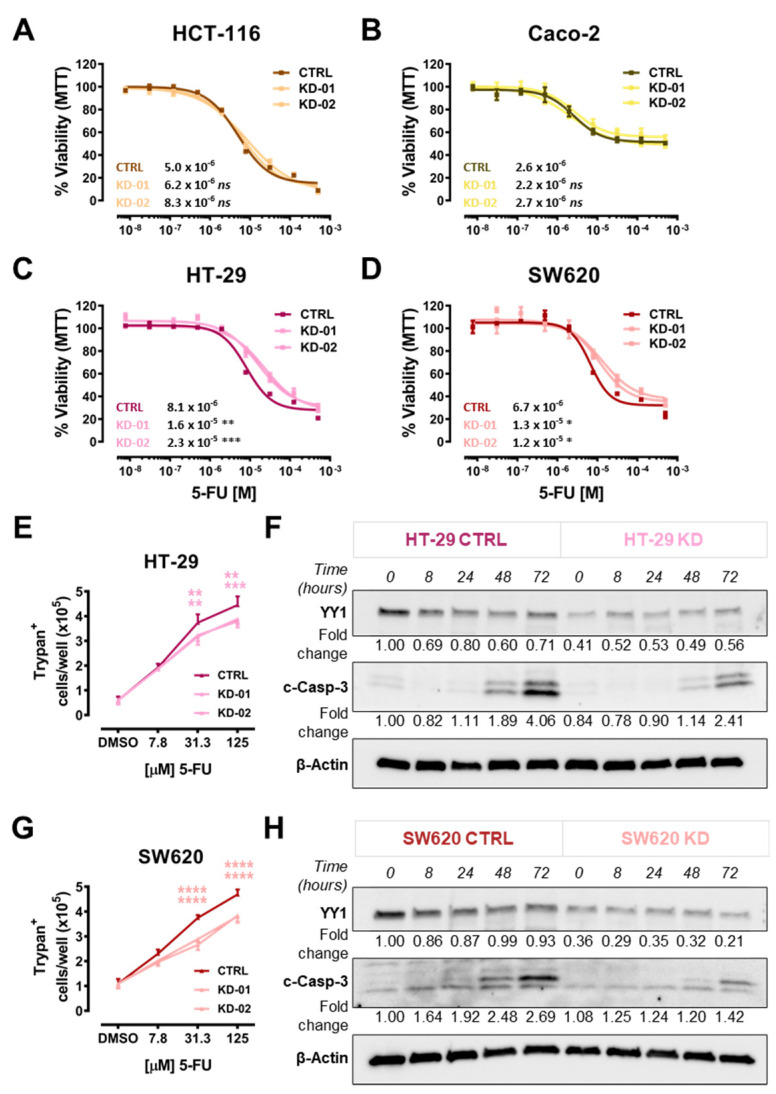
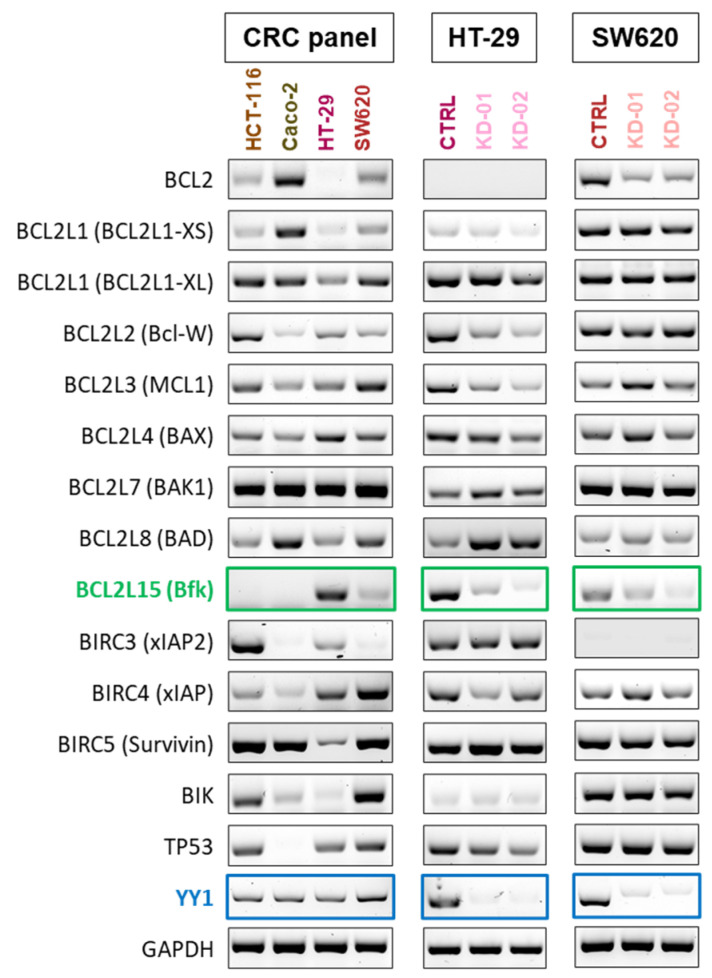
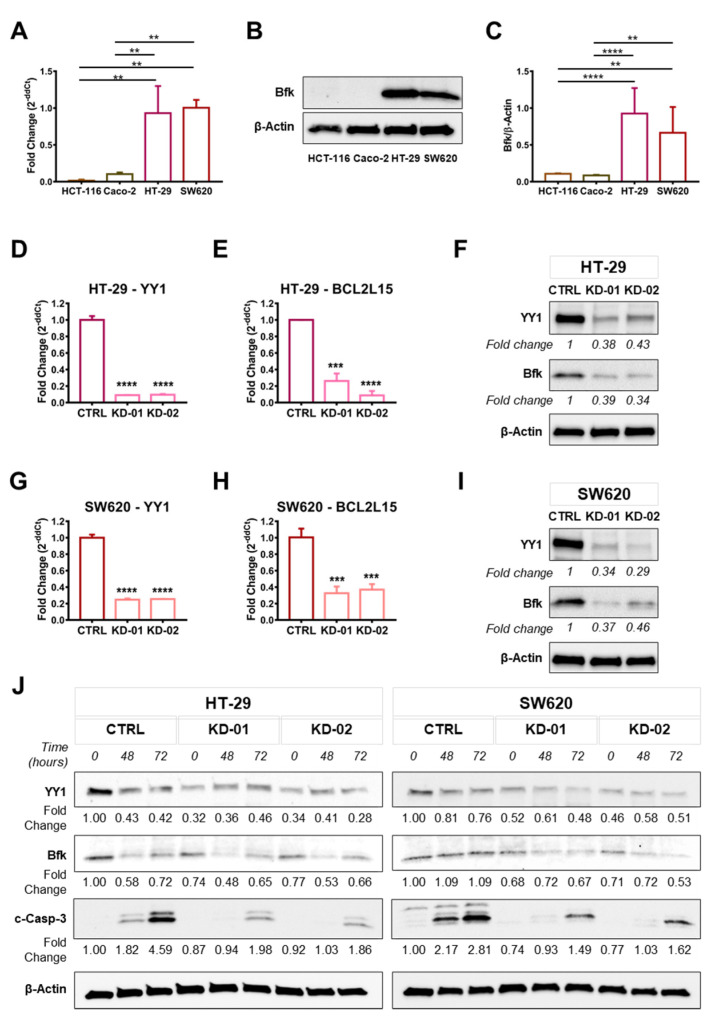
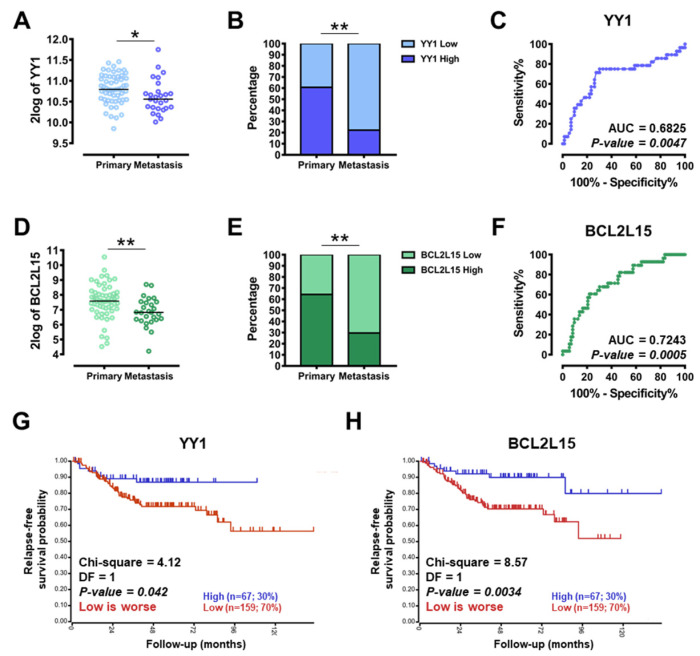
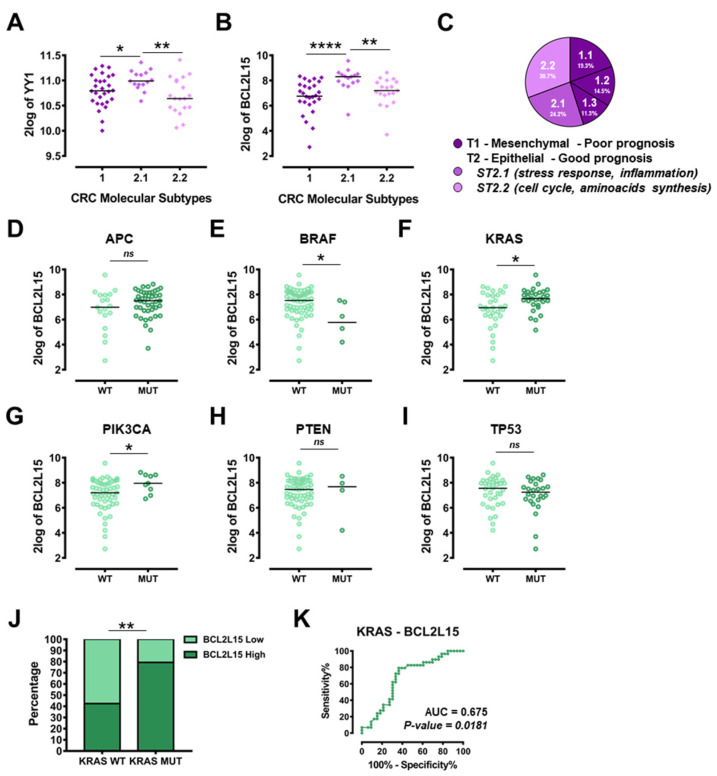
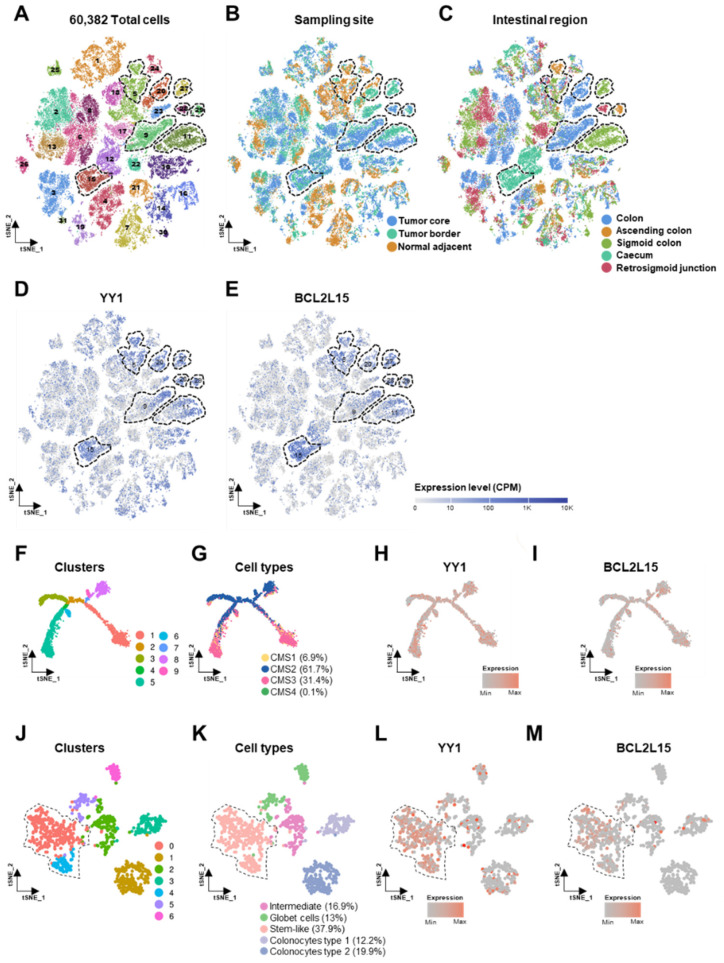
Colorectal cancer (CRC) is characterized by genetic heterogeneity and is often diagnosed at an advanced stage. Therefore, there is a need to identify novel predictive markers. Yin Yang 1 (YY1) is a transcription factor playing a dual role in cancer. The present study aimed to investigate whether YY1 expression levels influence CRC cell response to therapy and to identify the transcriptional targets involved. The diagnostic and prognostic values of YY1 and the identified factor(s) in CRC patients were also explored. Silencing of YY1 increased the resistance to 5-Fluorouracil-induced cytotoxicity in two out of four CRC cells with different genotypes. BCL2L15/Bfk pro-apoptotic factor was found selectively expressed in the responder CRC cells and downregulated upon YY1 knockdown. CRC dataset analyses corroborated a tumor-suppressive role for both YY1 and BCL2L15 whose expressions were inversely correlated with aggressiveness. CRC single-cell sequencing dataset analyses demonstrated higher co-expression levels of both YY1 and BCL2L15 within defined tumor cell clusters. Finally, elevated levels of YY1 and BCL2L15 in CRC patients were associated with larger relapse-free survival. Given their observed anti-cancer role, we propose YY1 and BCL2L15 as candidate diagnostic and prognostic CRC biomarkers.

Keywords: BCL2L15/Bfk; Yin Yang 1; biomarkers; colorectal cancer; tumor-suppressor.


Conflict of interest statement

The authors declare no conflict of interest.

Figures

Figure 1
Figure 1
YY1 silencing does not affect CRC cellular growth and viability. (A) q-RT-PCR analysis of YY1 expression in the four CRC cell lines (GAPDH used as housekeeping); data expressed as 2−ddCt and compared with SW620 normalized expression. (B) Immunoblot of YY1 (60 KDa) and β-Actin (42 KDa) proteins expression in the four CRC cell lines, densitometry analysis of YY1 expression (normalized to β-Actin). (C) shRNA targeting sequences against luciferase (CTRL) and YY1 (KD-01 and KD-02) transcripts. (D) Immunoblot of YY1 and GAPDH (37 KDa) proteins expression in HCT-116, Caco-2, HT-29 and SW620 clones (CTRL, KD-02, KD-01), densitometry analysis of YY1 expression (as percentage compared to CTRL). (E) MTT-based growth curve of the CTRL, KD-01 and KD-02 HCT-116, Caco-2, HT-29 and SW620 CRC cells (left y-axis: OD at 610 nm over days in culture; right y-axis: fold increase in the OD over the baseline). (F) Doubling time of the CTRL, KD-01 and KD-02 HCT-116, Caco-2, HT-29 and SW620 CRC cells. Values are presented as Mean  ±  SD. * p < 0.05; ** p  <  0.01; **** p  <  0.0001; no asterisk = not significant.
Figure 2
Figure 2
YY1 silencing increases viability and reduces apoptosis in HT-29 and SW620 CRC cells. 5-FU concentration-response curves of: (A) HCT-116 (CTRL, KD-01, KD-02). (B) Caco-2 (CTRL, KD-01, KD-02). (C) HT-29 (CTRL, KD-01, KD-02). (D) SW620 (CTRL, KD-01, KD-02). (E) Trypan blue count of HT-29 (CTRL, KD-01, KD-02) at 0 (DMSO only mock control), 7.8, 31.3, 125 µM, 5-FU. (F) Immunoblot and densitometry of HT-29 (CTRL, KD-01) treated with 30 µM 5-FU, from 0 to 72 h. Signal detected for YY1 (60 KDa), cleaved Caspase 3 (c-Casp-3; two bands at 17 and 19 KDa) and β-Actin (normalization control, 42 KDa). (G) Trypan blue count of SW620 (CTRL, KD-01, KD-02) at 0 (DMSO only mock control), 7.8, 31.3, 125 µM, 5-FU. (H) Immunoblot and densitometry of SW620 (CTRL, KD-01) treated with 30µM 5-FU, from 0 to 72 h. Signal detected for YY1, c-Casp-3 and β-Actin. Values are presented as Mean  ±  SD. * p < 0.05; ** p < 0.01; *** p < 0.001; **** p < 0.0001.
Figure 3
Figure 3
sq-RT-PCR analysis of YY1 putative transcriptional targets within the apoptotic pathway. Gel electrophoresis results. In CRC cells panel (HCT-116, Caco-2, HT-29 SW620); HT-29 (CTRL, KD-01, KD-02); SW620 (CTRL, KD-01, KD-02). YY1 (blue) is expressed in all four cell lines. BCL2L15 (green) is selectively expressed in HT-29 and SW620 cells and not detected in HCT-116 and Caco-2 cells. Upon YY1 knock-down (blue boxes), BCL2L15 is downregulated in both HT-29 and SW620 CRC cells (both KD-01 and KD-02, green boxes).
Figure 4
Figure 4
BCL2L15/Bfk is selectively expressed in HT-29 and SW620 CRC cells and it is downregulated upon YY1 silencing. (A) q-RT-PCR analysis of BCL2L15 expression in the four CRC cell lines (GAPDH used as housekeeping); data are expressed as 2−ddCt and compared with SW620 normalized expression. (B) Immunoblot of Bfk (17 KDa) and β-Actin (42 KDa) proteins expression in the four CRC cell lines. (C) Densitometry analysis of Bfk expression (normalized to β-Actin). (D) q-RT-PCR analysis of YY1 expression in HT-29 (CTRL, KD-01, KD-02), GAPDH used as housekeeping, data are expressed as 2−ddCt compared to CTRL. (E) q-RT-PCR analysis of BCL2L15 expression in HT-29 (CTRL, KD-01, KD-02), GAPDH used as housekeeping, data are expressed as 2−ddCt compared to CTRL. (F) Immunoblot and densitometry of HT-29 (CTRL, KD-01, KD-02). Signal detected for YY1, Bfk and β-Actin. (G) q-RT-PCR analysis of YY1 expression in SW620 (CTRL, KD-01, KD-02), GAPDH used as housekeeping, data are expressed as 2−ddCt compared to CTRL. (H) q-RT-PCR analysis of BCL2L15 expression in SW620 (CTRL, KD-01, KD-02), GAPDH used as housekeeping, data are expressed as 2−ddCt compared to CTRL. (I) Immunoblot and densitometry of SW620 (CTRL, KD-01, KD-02). Signal detected for YY1, Bfk and β-Actin. (J) Immunoblot and densitometry of HT-29 and SW620 (CTRL, KD-01, KD-02) treated with 30µM 5-FU, from 0 to 72 h. Signal detected for YY1, Bfk, c-Casp-3 and β-Actin. Values are presented as Mean  ±  SD. ** p < 0.01; *** p < 0.001; **** p < 0.0001.
Figure 5
Figure 5
Diagnostic and prognostic value of YY1 and BCL2L15 in CRC patients’ cohorts. (A) GSE28702, dot plots with median of YY1 2log expression in CRC samples primary and metastasis. (B) GSE28702, Fisher’s exact test, data represented as YY1 low vs. high percentage expression in CRC samples, primary vs. metastasis. (C) GSE28702, receiver operating characteristics (ROC) analysis of YY1 expression in CRC samples primary vs. metastasis. (D) GSE28702, dot plots with median of BCL2L15 2log expression in CRC samples primary and metastasis. (E) GSE28702, Fisher’s exact test, data represented as BCL2L15 low vs. high percentage expression in CRC samples primary vs. metastasis. (F) GSE28702, ROC analysis of BCL2L15 expression in CRC samples primary vs. metastasis. (G) GSE14333, Kaplan–Meier analysis of relapse-free survival correlated with YY1 expression (high:low = 30%:70%). (H) GSE14333, Kaplan–Meier analysis of relapse-free survival correlated with BCL2L15 expression (high:low = 30%:70%). * p < 0.05; ** p  <  0.01.
Figure 6
Figure 6
Correlation of YY1 and BCL2L15 expression with CRC molecular subtypes and mutational status. (A) GSE35896, dot plots with median of YY1 2log expression in CRC samples (T1, ST2.1, ST2.2). (B) GSE35896, dot plots with median of BCL2L15 2log expression in CRC samples (T1, ST2.1, ST2.2). (C) GSE35896, cake plot of CRC samples types and subtypes (percentage of the total). GSE35896, dot plots with median of BCL2L15 2log expression in CRC samples of: (D) APC (WT vs. MUT). (E) BRAF (WT vs. MUT). (F) KRAS (WT vs. MUT). (G) PIK3CA (WT vs. MUT). (H) PTEN (WT vs. MUT). (I) TP53 (WT vs. MUT). (J) GSE35896, Fisher’s exact test, data represented as BCL2L15 low vs. high percentage expression in CRC samples, KRAS WT vs. KRAS MUT. (K) ROC analysis of BCL2L15 expression in CRC samples KRAS WT vs. KRAS MUT. * p < 0.05; ** p  <  0.01; **** p  <  0.0001; n.s. = not significant.
Figure 7
Figure 7
Correlation of YY1 and BCL2L15 expression with single-CRC-cells features in GSE132465 and GSE144735 datasets. (A) t-distributed stochastic neighbor embedding (t-SNE) plot of 60,382 CRC total cells (clusters). (B) t-SNE plot of CRC total cells (sampling site). (C) t-SNE plot of CRC total cells (intestinal region). (D) t-SNE plot of CRC total cells (YY1 expression). (E) t-SNE plot of CRC total cells (BCL2L15 expression). Expression level as counts per million reads mapped (CPM). (F) t-SNE plot of 17,469 tumor epithelial cells (clusters). (G) t-SNE plot of tumor epithelial cells (CMS signatures). (H) t-SNE plot of tumor epithelial cells (YY1 expression). (I) t-SNE plot of tumor epithelial cells (BCL2L15 expression). (J) t-SNE plot of 1070 normal epithelial cells (clusters). (K) t-SNE plot of normal epithelial cells (cell types). (L) t-SNE plot of normal epithelial cells (YY1 expression). (M) t-SNE plot of normal epithelial cells (BCL2L15 expression). Dotted lines highlight areas of YY1 and BCL2L15 high expression.

References

    1. Bray F., Ferlay J., Soerjomataram I., Siegel R.L., Torre L.A., Jemal A. Global cancer statistics 2018: GLOBOCAN estimates of incidence and mortality worldwide for 36 cancers in 185 countries. CA Cancer J. Clin. 2018;68:394–424. doi: 10.3322/caac.21492. - DOI - PubMed
    1. Arnold M., Sierra M.S., Laversanne M., Soerjomataram I., Jemal A., Bray F. Global patterns and trends in colorectal cancer incidence and mortality. Gut. 2017;66:683–691. doi: 10.1136/gutjnl-2015-310912. - DOI - PubMed
    1. Molinari C., Marisi G., Passardi A., Matteucci L., De Maio G., Ulivi P. Heterogeneity in Colorectal Cancer: A Challenge for Personalized Medicine? Int. J. Mol. Sci. 2018;19:3733. doi: 10.3390/ijms19123733. - DOI - PMC - PubMed
    1. Guinney J., Dienstmann R., Wang X., de Reyniès A., Schlicker A., Soneson C., Marisa L., Roepman P., Nyamundanda G., Angelino P., et al. The consensus molecular subtypes of colorectal cancer. Nat. Med. 2015;21:1350–1356. doi: 10.1038/nm.3967. - DOI - PMC - PubMed
    1. Menter D.G., Davis J.S., Broom B.M., Overman M.J., Morris J., Kopetz S. Back to the Colorectal Cancer Consensus Molecular Subtype Future. Curr. Gastroenterol. Rep. 2019;21:5. doi: 10.1007/s11894-019-0674-9. - DOI - PMC - PubMed

MeSH terms