Multicenter Study
. 2021 Aug 14;22(16):8735.
doi: 10.3390/ijms22168735.

Altered Follicular Fluid Metabolic Pattern Correlates with Female Infertility and Outcome Measures of In Vitro Fertilization

Affiliations
Multicenter Study

Altered Follicular Fluid Metabolic Pattern Correlates with Female Infertility and Outcome Measures of In Vitro Fertilization

Giacomo Lazzarino et al. Int J Mol Sci. .

Abstract

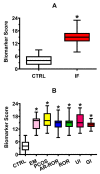
Nearly 40-50% of infertility problems are estimated to be of female origin. Previous studies dedicated to the analysis of metabolites in follicular fluid (FF) produced contrasting results, although some valuable indexes capable to discriminate control groups (CTRL) from infertile females (IF) and correlate with outcome measures of assisted reproduction techniques were in some instances found. In this study, we analyzed in blind FF of 35 control subjects (CTRL = patients in which inability to obtain pregnancy was exclusively due to a male factor) and 145 IF (affected by: endometriosis, n = 19; polycystic ovary syndrome, n = 14; age-related reduced ovarian reserve, n = 58; reduced ovarian reserve, n = 29; unexplained infertility, n = 14; genetic infertility, n = 11) to determine concentrations of 55 water- and fat-soluble low molecular weight compounds (antioxidants, oxidative/nitrosative stress-related compounds, purines, pyrimidines, energy-related metabolites, and amino acids). Results evidenced that 27/55 of them had significantly different values in IF with respect to those measured in CTRL. The metabolic pattern of these potential biomarkers of infertility was cumulated (in both CTRL and IF) into a Biomarker Score index (incorporating the metabolic anomalies of FF), that fully discriminated CTRL (mean Biomarker Score value = 4.00 ± 2.30) from IF (mean Biomarker Score value = 14.88 ± 3.09, p < 0.001). The Biomarker Score values were significantly higher than those of CTRL in each of the six subgroups of IF. Posterior probability curves and ROC curve indicated that values of the Biomarker Score clustered CTRL and IF into two distinct groups, based on the individual FF metabolic profile. Furthermore, Biomarker Score values correlated with outcome measures of ovarian stimulation, in vitro fertilization, number and quality of blastocysts, clinical pregnancy, and healthy offspring. These results strongly suggest that the biochemical quality of FF deeply influences not only the effectiveness of IVF procedures but also the following embryonic development up to healthy newborns. The targeted metabolomic analysis of FF (using empowered Redox Energy Test) and the subsequent calculation of the Biomarker Score evidenced a set of 27 low molecular weight infertility biomarkers potentially useful in the laboratory managing of female infertility and to predict the success of assisted reproduction techniques.

Keywords: amino acids; antioxidants; assisted reproduction techniques; biomarkers; energy metabolites; female infertility; follicular fluid; oxidative/nitrosative stress; targeted metabolomics.


Conflict of interest statement

The authors declare no conflict of interest.

Figures

Figure 1
Figure 1
Box plots reporting median, 1st and 3rd quartiles, minimum and maximum values of the concentrations of glucose (A), lactate (B), hypoxanthine (C), xanthine (D), β-pseudouridine (E), uracil (F), cytosine (G), cytidine (H), ascorbate (I), GSH (J), MDA (K), 8-OH-dG (L), nitrite (M), and nitrate (N) detected in FF of 35 control subjects (CTRL) and in infertile females categorized into endometriosis (EM, n = 19), polycystic ovary syndrome (PCOS, n = 14), age-related reduced ovarian reserve (AR-ROR, n = 58), reduced ovarian reserve (ROR, n = 29), unexplained infertile (UI, n = 14) and genetic infertile (GI, n = 11), according to their clinical diagnosis. Energy-related metabolites (A,B); purines (C,D); pyrimidines (EH); water-soluble antioxidants (I,J); oxidative stress indexes (K,L); nitrosative stress indexes (M,N). * Significantly different from CTRL, q < 0.005.
Figure 2
Figure 2
Box plots reporting median, 1st and 3rd quartiles, minimum and maximum values of the concentrations of α-tocopherol (A), vitamin A (B), vitamin D (C), coenzyme Q10 (D), carotenoids (E), serine (F), threonine (G), arginine (H), valine (I), methionine (J), tryptophan (K), isoleucine (L), and leucine (M) detected in FF of 35 control subjects (CTRL) and in infertile females categorized into endometriosis (EM, n = 19), polycystic ovary syndrome (PCOS, n = 14), age-related reduced ovarian reserve (AR-ROR, n = 58), reduced ovarian reserve (ROR, n = 29), unexplained infertile (UI, n = 14) and genetic infertile (GI, n = 11), according to their clinical diagnosis. Fat-soluble vitamins and antioxidants (AE); amino acids (FM). * Significantly different from CTRL, q < 0.005.
Figure 3
Figure 3
Box plots reporting the Biomarker Score values calculated in: (A) the group of 35 control subjects (CTRL) and the group of 145 infertile females (IF) pooled into a single group of infertility, independently on their clinical diagnosis; (B) 35 control subjects (CTRL) and infertile females categorized into endometriosis (EM, n = 19), polycystic ovary syndrome (PCOS, n = 14), age-related reduced ovarian reserve (AR-ROR, n = 58), reduced ovarian reserve (ROR, n = 29), unexplained infertile (UI, n = 14) and genetic infertile (GI, n = 11), according to their clinical diagnosis. * In (A), significantly different from CTRL, p < 0.001. * In (B), significantly different from CTRL, q < 0.005.
Figure 4
Figure 4
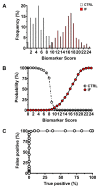
Distribution frequency (A), posterior probability curves (B), and the ROC curve of the Biomarker Score values (C) calculated in the group of 35 control subjects (CTRL) and in the group of 145 infertile females (IF) pooled into a single group of infertility, independently on their clinical diagnosis.
Figure 5
Figure 5
Box plots reporting the median, 1st and 3rd quartiles, minimum and maximum values of the number of retrieved oocytes (A), number of mature oocytes (B), number of fertilized oocytes (C), number of blastocysts (D), number of high-quality blastocysts (E), and % of β-HCG positive patients (F) in 35 control subjects (CTRL) and 145 infertile females (IF) pooled into a single group of infertility, independently of their clinical diagnosis. * Significantly different from CTRL, p < 0.001.
Figure 6
Figure 6
Box plots reporting the median, 1st and 3rd quartiles, minimum and maximum values of the number of retrieved oocytes (A), number of mature oocytes (B), number of fertilized oocytes (C), number of blastocysts (D), number of high-quality blastocysts (E), and % of β-HCG positive patients (F) in 35 control subjects (CTRL) and in infertile females categorized into endometriosis (EM, n = 19), polycystic ovary syndrome (PCOS, n = 14), age-related reduced ovarian reserve (AR-ROR, n = 58), reduced ovarian reserve (ROR, n = 29), unexplained infertile (UI, n = 14) and genetic infertile (GI, n = 11), according to their clinical diagnosis. * Significantly different from CTRL, q < 0.001.
Figure 7
Figure 7
Linear correlations between the Biomarker Score values and number of retrieved oocytes (A), number of mature oocytes (B), number of fertilized oocytes (C), number of blastocysts (D), and number of high-quality blastocysts (E) in pooled FF donors, independently of initially being CTRL or IF. Spearman’s correlation coefficients were significant in any of the aforementioned associations (p < 0.001).
Figure 8
Figure 8
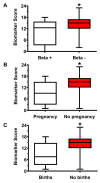
Box plots reporting the median, 1st and 3rd quartiles, minimum and maximum values of the Biomarker Score values in those FF donors who underwent embryo transfer and who were positive for β-HCG (A), who had a clinical pregnancy (B), and who delivered healthy offspring (C). FF donors were pooled into a single group, independently of initially being CTRL or IF. * Significantly different from beta +, pregnancy and births, p < 0.001.

References

    1. Winters B.R., Walsh T.J. The epidemiology of male infertility. Urol. Clin. N. Am. 2014;41:195–204. doi: 10.1016/j.ucl.2013.08.006. - DOI - PubMed
    1. Pisarska M.D., Chan J.L., Lawrenson K., Gonzalez T.L., Wang E.T. Genetics and Epigenetics of Infertility and Treatments on Outcomes. J. Clin. Endocrinol. Metab. 2019;104:1871–1886. doi: 10.1210/jc.2018-01869. - DOI - PMC - PubMed
    1. Patrizio P., Sakkas D. From oocyte to baby: A clinical evaluation of the biological efficiency of in vitro fertilization. Fertil. Steril. 2009;91:1061–1066. doi: 10.1016/j.fertnstert.2008.01.003. - DOI - PubMed
    1. Dumesic D.A., Meldrum D.R., Katz-Jaffe M.G., Krisher R.L., Schoolcraft W.B. Oocyte environment: Follicular fluid and cumulus cells are critical for oocyte health. Fertil. Steril. 2015;103:303–316. doi: 10.1016/j.fertnstert.2014.11.015. - DOI - PubMed
    1. Zhao H., Zhao Y., Li T., Li M., Li J., Li R., Liu P., Yu Y., Qiao J. Metabolism alteration in follicular niche: The nexus among intermediary metabolism, mitochondrial function, and classic polycystic ovary syndrome. Free Radic. Biol. Med. 2015;86:295–307. doi: 10.1016/j.freeradbiomed.2015.05.013. - DOI - PubMed

Publication types